
Market Overview
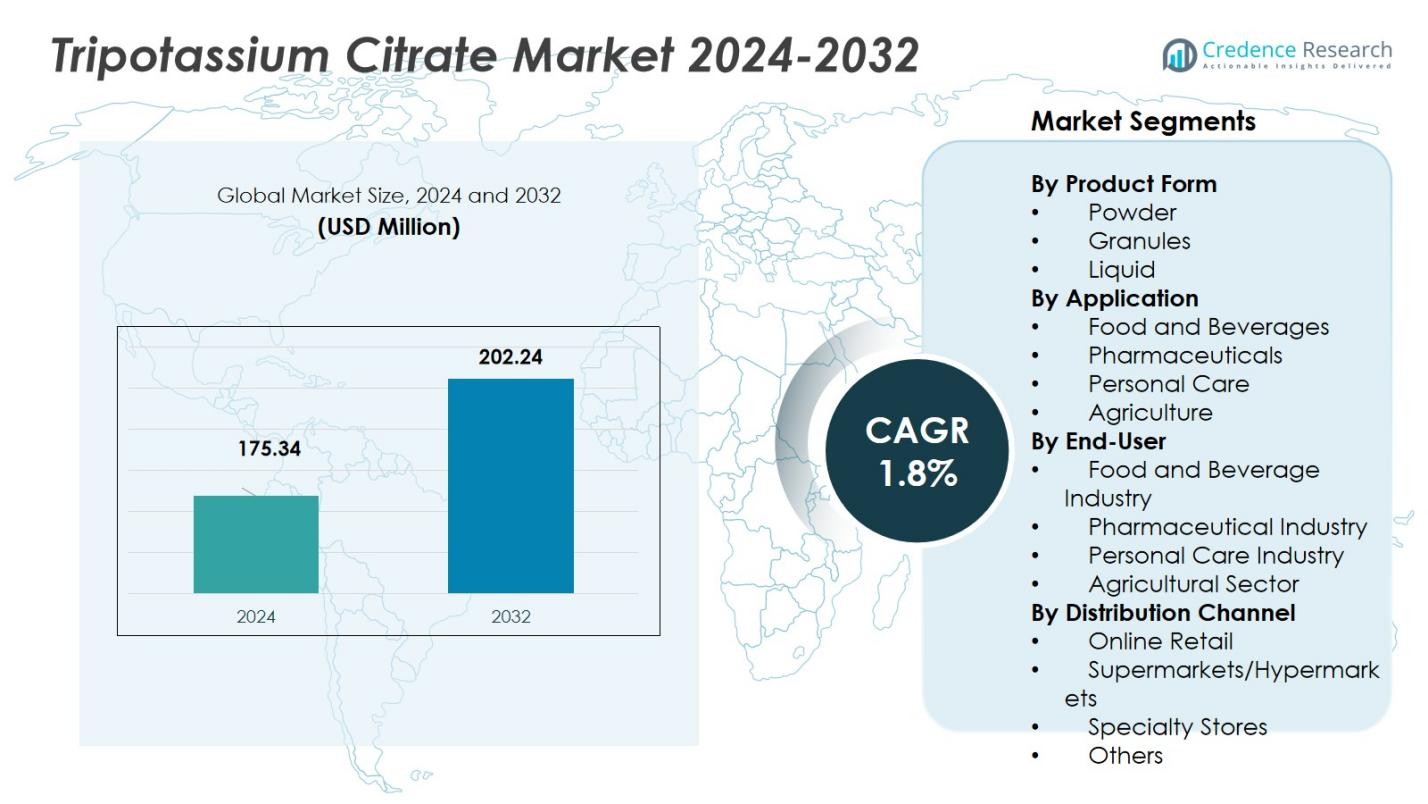
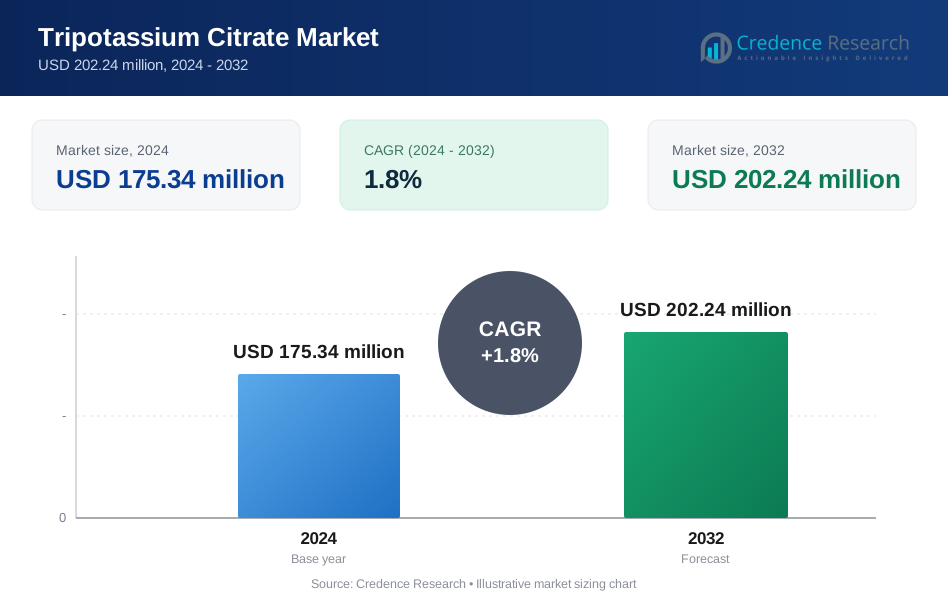
Tripotassium Citrate Market size was valued at USD 175.34 million in 2024 and is anticipated to reach USD 202.24 million by 2032, at a CAGR of 1.8% during the forecast period.
| REPORT ATTRIBUTE | DETAILS |
|---|---|
| Historical Period | 2020-2023 |
| Base Year | 2024 |
| Forecast Period | 2025-2032 |
| Tripotassium Citrate Market Size 2024 | USD 175.34 Million |
| Tripotassium Citrate Market, CAGR | 1.8% |
| Tripotassium Citrate Market Size 2032 | USD 202.24 Million |
The Tripotassium Citrate market features several established producers such as Cargill, Incorporated; Jungbunzlauer Suisse AG; Gadot Biochemical Industries Ltd.; ADM (Archer Daniels Midland Company); Tate & Lyle PLC; FBC Industries, Inc.; American Tartaric Products, Inc.; Hawkins, Inc.; Jiangsu Mupro IFT Corp.; and Shandong TTCA Co., Ltd. as leading suppliers, driving global supply through extensive production capacity and broad distribution reach. The region leading consumption and production is Asia Pacific, which holds exactly 45 % of the global Tripotassium Citrate market share. Europe follows with 28 %, and North America accounts for 32 %. These players and regions together define current market dynamics and set the foundation for future expansion, leveraging strong demand in food & beverage, pharmaceutical, and specialty‑grade applications.
Market Insights
- The Tripotassium Citrate market was valued at USD 175.34 million in 2024 and is projected to reach USD 202.24 million by 2032, growing at a CAGR of 1.8% during the forecast period.
- The primary driver for market growth is the increasing demand for low‑sodium formulations in the food and beverage sector, particularly as consumers opt for healthier alternatives to sodium-based additives.
- Key trends include the rising popularity of clean-label ingredients and the growing use of Tripotassium Citrate in personal care and nutraceutical products, expanding beyond traditional food and pharmaceutical applications.
- Competition in the market remains fragmented, with major players such as Cargill, Jungbunzlauer, and ADM holding over 45% of the global market share, fostering opportunities for regional players to target niche markets.
- Asia Pacific dominates with a 45% market share, followed by North America at 32%, and Europe at 28%, with growth driven by increasing urbanization and processed food consumption across emerging markets.
Market Segmentation Analysis:
By Product Form
The market for Tripotassium Citrate is dominated by the powder sub‑segment, which accounts for the majority share (estimated at over 60%) of total volume. Powdered form remains preferable due to its high solubility, ease of blending, and flexibility in dosing, making it ideal for diverse applications across food, beverage, pharmaceutical, and personal‑care formulations. Powder format simplifies manufacturing operations and supports consistent quality driving its dominance over granules and liquid forms.
- For instance, in pharmaceuticals, powdered tripotassium citrate is used as a potassium supplement and active ingredient to treat urinary conditions due to its rapid absorption and alkaline properties.
By Application
Within application segments, Food and Beverages lead with 55% share of global tripotassium citrate consumption. This dominance stems from widespread use as an acidity regulator, pH buffer, flavor stabilizer, and potassium fortifying agent in processed foods, dairy, confectioneries, soft drinks, and functional beverages. Rising consumer demand for low‑sodium, clean‑label, and health‑oriented foods along with growth in convenience and processed food consumption underpins this strong share and continued growth.
- For instance, Nestlé employs tripotassium citrate in functional beverages to boost potassium content while ensuring product stability.
By End‑User
The Food and Beverage Industry end‑user segment holds the largest share of end‑use demand for tripotassium citrate, estimated at more than 50% of the overall market. This reflects intensive use of tripotassium citrate by food and beverage manufacturers seeking functionality such as acidity regulation, flavor enhancement, mineral fortification (potassium), and shelf‑life extension. Growing global demand for processed foods, beverages, and health‑fortified products combined with regulatory and consumer trends toward reduced sodium and enriched nutrient content continues to drive uptake in this end‑user segment.
 Key Growth Drivers
Rising Demand for Low‑Sodium Formulations
A major growth driver for the Tripotassium Citrate (TPC) market is the increasing shift by food and beverage manufacturers toward low‑sodium formulations. As consumers become more health‑conscious and regulatory emphasis on sodium reduction intensifies, TPC a potassium salt offers a desirable alternative to sodium‑based additives such as trisodium citrate. Its functionality as a pH buffer, acidity regulator, and stabilizer, while enabling “reduced sodium” or “low‑sodium” claims, accelerates penetration in processed foods and beverages. This health‑driven substitution supports consistent growth in global demand for TPC.
- For instance, Wang Pharmaceuticals & Chemicals in India, a leading supplier of high-purity Tripotassium Citrate, which is used extensively to formulate reduced sodium food products and beverages, offering a healthier alternative to trisodium citrate.
Expansion of Processed Food & Beverage Industry
Another core growth driver is the continuous expansion of the global processed food and beverage sector. The demand for convenience foods, soft drinks, dairy‑based products, confectioneries, and functional beverages is rising all of which often require acidity regulation, flavor stabilization, and shelf‑life extension. TPC’s multifunctional properties (acidulant, buffer, stabilizer) make it a preferred additive for such applications. As the processed food market scales especially in emerging markets with growing urbanisation and changing dietary patterns TPC consumption grows in tandem, underpinning market expansion.
- For instance, Coca-Cola, one of the largest global soft drink producers, uses potassium citrate in some of its beverages, particularly zero sugar and diet varieties, to balance acidity and enhance flavor stability.
Growing Pharmaceutical and Healthcare Applications
The increasing adoption of TPC in pharmaceutical and healthcare applications represents a significant growth driver. TPC serves as a potassium supplement, urinary alkalinizer, and a therapeutic agent for conditions such as kidney stones and metabolic acidosis. With rising incidence of kidney‑related disorders, aging populations, and greater medical awareness worldwide especially in regions with expanding healthcare access demand for potassium citrate in medical formulations is growing. This trend diversifies the demand base beyond food applications and contributes substantially to overall market growth.
Key Trends & Opportunities
Clean‑Label & Natural Ingredient Movement
An important trend benefiting the TPC market is the growing consumer and regulatory shift toward “clean‑label” and natural ingredients. TPC, accepted as a food additive with E‑number status, offers a clean, non‑synthetic option for acidity regulation and mineral fortification. Its dual role functionality plus nutritional benefit (potassium fortification) makes it especially attractive for brands positioning their products as healthy, transparent, or “better‑for‑you.” This creates opportunities for TPC to displace less desirable additives and gain share in foods, beverages, and dietary‑supplement segments.
- For instance, major beverage manufacturers such as PepsiCo use acidulants to regulate acidity in carbonated soft drinks, maintaining taste integrity during prolonged storage.
Growth in Specialty Applications: Personal Care & Nutraceuticals
Beyond traditional food and pharmaceutical uses, TPC is gaining traction in personal care, cosmetics, and nutraceutical applications, offering a compelling growth opportunity. Its properties pH‑adjustment, chelation, buffering make it useful in formulations such as oral‑care products, skincare, cosmetics, and functional supplements. As demand for “clean,” biodegradable, and multifunctional ingredients grows in these sectors (especially in emerging economies), TPC is increasingly adopted in new product formulations. This diversification beyond core markets enhances long‑term growth potential.
- For instance, certain dietary supplement and nutritional‑grade TPC sources from manufacturers like Dr. Paul Lohmann GmbH supply potassium salts that are explicitly positioned for use in cosmetics, supplements, and pharmaceuticals underlining TPC’s versatility as a mineral‑fortifying, pH‑regulating ingredient.
Key Challenges
Competition from Alternative Additives and Substitutes
One major challenge for the TPC market is substitution risk manufacturers may opt for alternative acidity regulators, salts, or buffering agents depending on cost, availability, or formulation requirements. For example, other citrate salts or mineral salts could be selected if they are cheaper or easier to procure. Such substitution potential may restrain TPC’s market growth, especially in cost-sensitive segments or regions. This competitive pressure from alternative additives represents a significant market risk.
Raw Material and Regulatory Constraints
The production of TPC depends on high‑purity citric acid and potassium sources, and regulatory compliance for food‑ or pharma‑grade products demands rigorous quality control. Fluctuations in raw material availability, supply‑chain disruptions, or tightening regulations on additives and food safety standards may increase production cost or limit supply. These factors can hinder scalability and affect pricing, thereby challenging market growth especially in emerging markets with less stable supply chains.
Regional Analysis
North America
North America holds a market share of 32% in the global Tripotassium Citrate market. The region’s established food and beverage industry, strong pharmaceutical manufacturing base, and stringent quality and safety standards support robust demand for Tripotassium Citrate in acidity control, mineral fortification, and pharmaceutical excipient applications. Stable consumption patterns, combined with ongoing innovation in processed foods and health‑oriented formulations, ensure sustained demand growth across end‑use sectors, making North America a key player in the global market.
Europe
Europe represents 28% of the global Tripotassium Citrate market, benefiting from increasing demand for clean‑label food products and functional beverages, particularly in countries such as Germany, France, and the UK. The region’s mature regulatory environment, high consumer awareness of food safety, and the strong pharmaceutical and nutraceutical sectors contribute to this market share. Pharmaceutical applications are significant in the region due to established healthcare infrastructure, ensuring Europe remains a stable and important market for Tripotassium Citrate.
Asia Pacific
Asia Pacific is the dominant region, commanding 45% of the global Tripotassium Citrate market. Rapid urbanization, rising disposable incomes, and an expanding processed food and beverage industry in populous countries like China and India drive high demand. Additionally, growing adoption in pharmaceutical sectors and increasing regulatory acceptance of food additives further boost consumption. As consumer preferences shift toward fortified, convenient, and health‑oriented foods and beverages, the region is poised for continued strong growth in the Tripotassium Citrate market.
Latin America
Latin America holds a market share of 6% in the global Tripotassium Citrate market, with growth driven by the rising processed food industry and expanding food additive use. While its overall share remains smaller than Asia Pacific, North America, and Europe, the demand for convenience foods, beverages, and fortification is increasing, particularly in urban centers. As consumer awareness around health‑oriented formulations continues to grow, the adoption of Tripotassium Citrate in food and beverage products is expected to expand in this region.
Middle East & Africa (MEA)
The Middle East & Africa (MEA) region holds a market share of 4% in the Tripotassium Citrate market, with modest but growing demand driven by expanding food processing and beverage manufacturing capacities, particularly in the Gulf and North African countries. While its current market share is smaller compared to other regions, improving infrastructure, rising urban consumption, and increasing regulatory acceptance of food additives foster gradual growth. MEA is expected to emerge as a niche growth region for Tripotassium Citrate, particularly in processed foods and beverages.
Market Segmentations:
By Product Form
- Powder
- Granules
- Liquid
By Application
- Food and Beverages
- Pharmaceuticals
- Personal Care
- Agriculture
By End-User
- Food and Beverage Industry
- Pharmaceutical Industry
- Personal Care Industry
- Agricultural Sector
By Distribution Channel
- Online Retail
- Supermarkets/Hypermarkets
- Specialty Stores
- Others
By Geography
- North America
- U.S.
- Canada
- Mexico
- Europe
- Germany
- France
- U.K.
- Italy
- Spain
- Rest of Europe
- Asia Pacific
- China
- Japan
- India
- South Korea
- South-east Asia
- Rest of Asia Pacific
- Latin America
- Brazil
- Argentina
- Rest of Latin America
- Middle East & Africa
- GCC Countries
- South Africa
- Rest of the Middle East and Africa
Competitive Landscape
The competitive landscape of the Tripotassium Citrate market is driven by key players such as Cargill, Incorporated, Jungbunzlauer Suisse AG, Gadot Biochemical Industries Ltd., ADM (Archer Daniels Midland Company), Tate & Lyle PLC, FBC Industries, Inc., American Tartaric Products, Inc., Hawkins, Inc., Jiangsu Mupro IFT Corp., and Shandong TTCA Co., Ltd. These companies are engaged in expanding their production capabilities, improving product quality, and increasing their geographic reach to meet the growing demand across food and beverage, pharmaceutical, and personal care sectors. Despite the presence of several major players, the market remains fragmented, with the leading firms collectively holding just over 45% of the market share. This fragmentation creates opportunities for regional players to capture niche markets with competitive pricing and customized solutions. Companies that focus on product purity, regulatory compliance, and cost‑efficiency are likely to maintain or enhance their competitive edge.
Key Player Analysis
- Jiangsu Mupro IFT Corp.
- Cargill, Incorporated
- Hawkins, Inc.
- Gadot Biochemical Industries Ltd.
- American Tartaric Products, Inc.
- Jungbunzlauer Suisse AG
- FBC Industries, Inc.
- Shandong TTCA Co., Ltd.
- Tate & Lyle PLC
- ADM (Archer Daniels Midland Company)
Recent Developments
- In 2025, Jungbunzlauer Suisse AG continues to prioritize sustainability in its production of potassium citrate, utilizing renewable energy and sustainably sourced raw materials.
- In June 2023, Gadot Biochemical Industries Ltd. reported that its Tri‑Potassium Citrate (Tripotassium Citrate) continues to thrive, driven by rising demand for low-salt foods and growing use in food, beverage and nutraceutical applications.
Report Coverage
The research report offers an in-depth analysis based on Product Form, Application, End User, Distribution Channel and Geography. It details leading market players, providing an overview of their business, product offerings, investments, revenue streams, and key applications. Additionally, the report includes insights into the competitive environment, SWOT analysis, current market trends, as well as the primary drivers and constraints. Furthermore, it discusses various factors that have driven market expansion in recent years. The report also explores market dynamics, regulatory scenarios, and technological advancements that are shaping the industry. It assesses the impact of external factors and global economic changes on market growth. Lastly, it provides strategic recommendations for new entrants and established companies to navigate the complexities of the market.
Future Outlook
- Global demand for tripotassium citrate will rise as food and beverage producers increasingly seek low‑sodium and mineral‑fortified formulations, boosting its use as a sodium‑substitute additive.
- Growth in processed and convenience food consumption worldwide will drive greater adoption of tripotassium citrate for acidity regulation, flavor stabilization, and shelf‑life extension.
- Rising health awareness and increasing prevalence of diet‑related conditions will spur demand for dietary supplements and pharmaceutical formulations using tripotassium citrate for electrolyte balance and urinary alkalinization.
- Expansion of the personal‑care and nutraceutical sectors will create new opportunities for tripotassium citrate as a buffering and stabilizing agent in skin care, oral care, and supplement products.
- Emerging markets in Asia-Pacific, Latin America and MEA will contribute significantly as urbanization, disposable incomes, and regulatory acceptance of food additives increase.
- Manufacturers will focus on optimizing production processes to improve purity and reduce costs, enabling broader market penetration and competitive pricing.
- Suppliers will increasingly emphasize clean‑label, GRAS‑certified and “natural/mineral‑based” positioning to align with consumer demand for transparency and clean‑label products.
- Diversification into customized or micronized tripotassium citrate grades for specialized applications (e.g., dietary supplements, functional foods) will support niche market growth.
- Strengthened regulatory frameworks and rising global food safety standards will support broader adoption of certified tripotassium citrate in food, beverage, and pharmaceutical applications.
- Strategic expansions by global producers into regional markets combined with growing distribution networks will enhance supply chain stability and facilitate market expansion globally.
Request a Free Sample
Fill in your details and we'll send you a free sample report.
- Sample data tables & charts
- Research methodology
Need a Custom Version of This Report?
Tailor the scope, geography, or segments to your exact requirements.
- Custom geography or segment scope
- Direct access to our analyst team
Frequently Asked Questions
What is the current market size for Tripotassium Citrate Market, and what is its projected size in 2032?
At what Compound Annual Growth Rate is the Tripotassium Citrate Market projected to grow between 2025 and 2032?
Which Tripotassium Citrate Market segment held the largest share in 2024?
What are the primary factors fueling the growth of the Tripotassium Citrate Market?
Who are the leading companies in the Tripotassium Citrate Market?
Which region commanded the largest share of the Tripotassium Citrate Market in 2024?
Table of Content
Chapter 1. Report Introduction
- 1.1 Report Description & Purpose
- 1.1.1 Report Title & Market Definition
- 1.1.2 Unique Selling Propositions (USP) & Key Differentiators
- 1.1.3 Value Proposition for Stakeholders
- 1.2 Research Objectives
- 1.2.1 Market Sizing Objectives (Volume & Revenue)
- 1.2.2 Segmentation Objectives
- 1.2.3 Competitive Intelligence Objectives
- 1.2.4 Forecast & Scenario Objectives
- 1.3 Report Scope
- 1.3.1 Tripotassium Citrate Scope – Types & Subtypes Covered
- 1.3.2 Geographic Scope – Regions & Countries Covered
- 1.3.3 Historical Period, Base Year & Forecast Period (2024; forecast to 2032)
- 1.3.4 Inclusions & Exclusions
- 1.4 HS Code & Classification Framework
- 1.5 Currency, Units & Pricing Basis
- 1.6 Target Stakeholders
- 1.7 Limitations & Assumptions
Chapter 2. Executive Summary
- 2.1 Global Tripotassium Citrate Market Snapshot
- 2.1.1 Market Size – Historical (2024) & Forecast (2024-2032) (2024: USD 175.34 million → 2032: USD 202.24 million)
- 2.1.2 Volume & Revenue – Global Totals
- 2.1.3 Key Market Highlights – Top Five Facts
- 2.2 Tripotassium Citrate Market Segmentation Snapshot
- 2.2.1 Market Split by Region – 2024 vs. 2032
- 2.3 Competitive Snapshot
- 2.3.1 Top 10 Players by Revenue Share – 2024
- 2.3.2 Top 10 Players by Volume Share – 2024
- 2.3.3 Recent Strategic Developments (18-Month Summary)
- 2.4 Key Investment Highlights & Strategic Conclusions
Chapter 3. Tripotassium Citrate Market Dynamics & Industry Analysis
- 3.1 Market Overview & Context
- 3.1.1 Tripotassium Citrate Market Position in the Broader Automotive Value Chain
- 3.1.2 OEM vs. Replacement Market Dynamics
- 3.1.3 Market Maturity & Development Stage by Region
- 3.2 Tripotassium Citrate Market Drivers
- 3.3 Tripotassium Citrate Market Restraints & Challenges
- 3.4 Tripotassium Citrate Market Opportunities
- 3.5 Porter's Five Forces Analysis
- 3.5.1 Threat of New Entrants
- 3.5.2 Bargaining Power of Suppliers
- 3.5.3 Bargaining Power of Buyers
- 3.5.4 Threat of Substitutes
- 3.5.5 Competitive Rivalry – Intensity Assessment
- 3.6 Tripotassium Citrate Value Chain Analysis
- 3.6.1 Upstream – Raw Material/Input Suppliers
- 3.6.1.1 Raw Material/Input 1
- 3.6.1.2 Raw Material/Input 2
- 3.6.1.3 Raw Material/Input 3
- 3.6.2 Midstream – Production/Manufacturing/Service Delivery
- 3.6.2.1 Production/Process Overview
- 3.6.2.2 Key Facility Locations & Capacity by Manufacturer
- 3.6.3 Downstream – Distribution & End Consumer
- 3.6.3.1 Primary Channel – B2B/OEM
- 3.6.3.2 Secondary Channels – Dealer, Retail, Online, Direct
- 3.6.4 Value Chain Profitability Analysis
- 3.6.1 Upstream – Raw Material/Input Suppliers
- 3.7 PESTEL Analysis
- 3.7.1 Political Factors
- 3.7.2 Economic Factors
- 3.7.3 Social Factors
- 3.7.4 Technological Factors
- 3.7.5 Environmental Factors
- 3.7.6 Legal Factors
- 3.8 Tripotassium Citrate Supply Chain Analysis
- 3.8.1 Raw Material/Input Supply Risk Assessment
- 3.8.2 Manufacturing Concentration Risk (Geographic Exposure)
- 3.8.3 Trade Disruption Impact Analysis
- 3.9 Regulatory & Policy Landscape
Note: The regulatory and policy landscape section covers regulations based on their applicability to the market, Tripotassium Citrate category, geography, and scope of the study. Only regulatory frameworks with a material impact on operations, compliance, trade, sustainability, or market access are analyzed in detail.
Chapter 4. Key Investment Pockets & Opportunity Analysis
- 4.1 Tripotassium Citrate Market Attractiveness Analysis
- 4.1.1 By Region – Investment Attractiveness Matrix (Volume × CAGR)
- 4.2 Absolute Revenue Growth Opportunity
- 4.2.1 By Region – Absolute USD Growth Through 2032
- 4.3 Incremental Volume Opportunity
- 4.3.1 By Region – Incremental Volume Through 2032
- 4.3.2 Segment – Incremental Volume
- 4.4 Emerging Submarket Opportunity Deep Dive (Subject to Applicability)
- 4.5 Emerging Market Opportunity Scorecards
- 4.5.1 United States
- 4.5.2 Europe
- 4.5.3 Asia
- 4.5.4 Middle East & Africa
Note: Emerging Market Opportunity Scorecards will be included based on relevance and strategic importance. Regions listed are indicative and may vary depending on data availability and market dynamics.
Chapter 5. Tripotassium Citrate Import-Export Analysis & Trade Flows
- 5.1 Global Trade Overview
- 5.1.1 Global Export Value by Country (2024)
- 5.1.2 Global Export Volume by Country (2024)
- 5.1.3 Global Import Value by Country (2024)
- 5.1.4 Global Import Volume by Country (2024)
- 5.1.5 Net Trade Balance by Country (2024)
- 5.2 Export Analysis – Segment
- 5.2.1 Type 1 (HS Code)
- 5.2.2 Type 2 (HS Code)
- 5.2.3 Type 3 (HS Code)
- 5.2.4 Type 4 (HS Code)
- 5.2.5 Type 5 (HS Code)
- 5.3 Import Analysis – Segment
- 5.3.1 Type 1 (HS Code)
- 5.3.2 Type 2 (HS Code)
- 5.3.3 Type 3 (HS Code)
- 5.3.4 Type 4 (HS Code)
- 5.3.5 Type 5 (HS Code)
- 5.4 Average Unit Trade Prices
- 5.4.1 Average Export Price – Segment & Country
- 5.4.2 Average Import Price – Segment & Source Country
- 5.4.3 Price Trends (2024)
- 5.5 Key Trade Route Analysis
- 5.5.1 Trade Route 1
- 5.5.2 Trade Route 2
- 5.5.3 Trade Route 3
- 5.5.4 Trade Route 4
- 5.5.5 Trade Route 5
- 5.6 Trade Policy Impact Assessment
- 5.6.1 US Anti-Dumping & Section 301 Tariffs
- 5.6.2 EU Customs Union Impact
- 5.6.3 Major Free Trade Agreements
- 5.6.4 USMCA Rules of Origin
Note: Trade policy analysis will be included only where relevant to the Tripotassium Citrate market.
Chapter 6. Competitive Landscape & Company Benchmarking
- 6.1 Tripotassium Citrate Market Concentration & Structure
- 6.1.1 Herfindahl-Hirschman Index (HHI) – vs. 2024
- 6.1.2 Tier 1, Tier 2 & Tier 3 Market Structure
- 6.1.3 Global, Regional & Local Player Dynamics
- 6.2 Tripotassium Citrate Market Share Analysis – 2024
- 6.2.1 Global Revenue Share by Company
- 6.2.2 Global Volume Share by Company
- 6.2.3 Regional Revenue Share
- 6.2.4 Market Share Evolution ( vs. 2024)
- 6.2.5 OEM Segment Share by Company
- 6.2.6 Replacement Segment Share by Company
- 6.3 Production/Delivery Capacity & Facility Analysis
- 6.3.1 Global Installed Capacity
- 6.3.2 Capacity Utilization Rates
- 6.3.3 Production/Output Volume
- 6.3.4 Facility Locations & Capacity Map
- 6.3.5 Planned Capacity Additions
- 6.4 Tripotassium Citrate Competitive Benchmarking Matrix
- 6.4.1 Revenue, Volume, CAGR & Profitability Comparison
- 6.4.2 Channel Revenue Mix
- 6.4.3 Geographic Revenue Exposure
- 6.4.4 R&D Intensity
- 6.4.5 Sustainability Maturity
- 6.5 Strategic Developments in Tripotassium Citrate (Last 24 Months)
- 6.5.1 Mergers, Acquisitions & Divestments
- 6.5.2 New Tripotassium Citrate Launches
- 6.5.3 Facility Expansions
- 6.5.4 Strategic Alliances, Joint Ventures & Partnerships
- 6.5.5 Distribution Expansion & Market Entry
- 6.5.6 Sustainability & ESG Initiatives
- 6.6 Competitive Strategy Mapping
- 6.6.1 Leader, Challenger, Follower & Niche Classification
- 6.6.2 Pricing Strategy Comparison
- 6.6.3 Channel Strategy Matrix
Note: Strategic developments are included based on their materiality and the availability of reliable information.
Chapter 7. Global Tripotassium Citrate Market – By Distribution Channel
- 7.1 Segment Overview
- 7.1.1 Volume & Revenue Split by Channel (2024 & 2032)
- 7.1.2 Channel Mix Evolution (2024-2032)
Chapter 8. Regional Market Analysis – Global Overview
- 8.1 Global Regional Overview
- 8.1.1 Regional Volume Share
- 8.1.2 Regional Revenue Share
- 8.1.3 Regional Volume by Region
- 8.1.4 Regional Revenue by Region
- 8.1.5 Regional Forecast Through 2032
- 8.2 Cross-Regional Segment Analysis
- 8.2.1 By Distribution Channel
- 8.2.2 By Brand/Price Tier
Chapter 9. North America Tripotassium Citrate Market
- 9.1 United States
- 9.2 Canada
- 9.3 Mexico
Chapter 10. Europe Tripotassium Citrate Market
- 10.1 Germany
- 10.2 France
- 10.3 Italy
- 10.4 United Kingdom
- 10.5 Spain
- 10.6 Poland
- 10.7 Russia
- 10.8 Netherlands
- 10.9 Belgium
- 10.10 Sweden
- 10.11 Denmark
- 10.12 Norway
- 10.13 Rest of Europe
Chapter 11. Asia Pacific Tripotassium Citrate Market
- 11.1 China
- 11.2 India
- 11.3 Japan
- 11.4 South Korea
- 11.5 Thailand
- 11.6 Indonesia
- 11.7 Vietnam
- 11.8 Malaysia
- 11.9 Australia
- 11.10 Rest of Asia Pacific
Chapter 12. Latin America Tripotassium Citrate Market
- 12.1 Brazil
- 12.2 Argentina
- 12.3 Colombia
- 12.4 Chile
- 12.5 Rest of Latin America
Chapter 13. Middle East Tripotassium Citrate Market
- 13.1 Saudi Arabia
- 13.2 United Arab Emirates
- 13.3 Turkey
- 13.4 Israel
- 13.5 Iran
- 13.6 Rest of the Middle East
Chapter 14. Africa Tripotassium Citrate Market
- 14.1 South Africa
- 14.2 Egypt
- 14.3 Nigeria
- 14.4 Morocco
- 14.5 Rest of Africa
Chapter 15. Tripotassium Citrate Company Profiles
- 15.1 [Company 01]
- 15.1.1 Company Overview
- 15.1.2 Key Management Personnel
- 15.1.3 Products & Services Portfolio
- 15.1.4 Financial Performance
- 15.1.5 Key Market Focus & Geographic Presence
- 15.1.6 Recent Developments & Strategic Initiatives
Note: The company profile list is preliminary and may change based on research findings, market developments, data availability, and client requirements.
Chapter 16. Appendices
- Appendix A – List of Abbreviations & Acronyms
- Appendix B – Industry Classification Code Reference – Full Series
- Appendix C – Production & Capacity Data Tables
- Appendix D – End-Use & Demand Base Tables
- Appendix E – Consumption & Replacement Rate Assumptions
- Appendix F – ASP Reference Tables
- Appendix G – Manufacturing & Facility Database
- Appendix H – Import-Export Data Tables
- Appendix I – Regulatory Summary Tables
- Appendix J – Primary Research Participant List (Anonymized)
- Appendix K – Primary Research Questionnaire Framework
- Appendix L – Data Sources & Bibliography
- Appendix M – Market Size Divergence & Source Comparison
Chapter 17. Research Methodology
- 17.1 Research Framework & Philosophy
- 17.2 Secondary Research – Sources, Hierarchy & Data Extraction
- 17.3 Data Modeling – Bottom-Up & Top-Down Market Sizing
- 17.4 Primary Research – Stakeholder Framework, LOI & Sample Sizes
- 17.5 Forecast Methodology – Regression, Scenario & Sensitivity Analysis
- 17.6 Quality Control – Four-Layer Validation Framework
- 17.7 Limitations & Standard Assumptions
- 17.8 Disclaimer
