
Market Overview
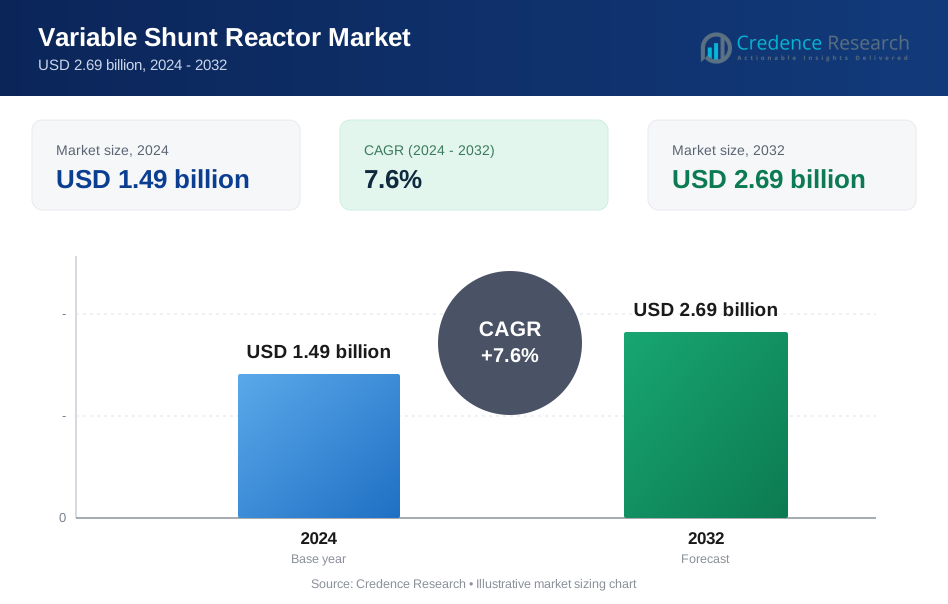
The variable shunt reactor market was valued at USD 1.49 billion in 2024 and is projected to reach USD 2.69 billion by 2032, growing at a CAGR of 7.6% during the forecast period.
| REPORT ATTRIBUTE | DETAILS |
|---|---|
| Historical Period | 2020-2023 |
| Base Year | 2024 |
| Forecast Period | 2025-2032 |
| Variable Shunt Reactor Market Size 2024 | USD 1.49 Billion |
| Variable Shunt Reactor Market, CAGR | 7.6% |
| Variable Shunt Reactor Market Size 2032 | USD 2.69 Billion |
The variable shunt reactor market is driven by key players including Hitachi Energy, GBE, Siemens Energy, Getra, Hyosung Heavy Industries, Nissin Electric, CG Power & Industrial Solutions, GE, Fuji Electric, and SGB Smit. These companies focus on expanding production capacity, developing digitally monitored reactors, and delivering turnkey solutions to meet growing demand for grid stability. Asia-Pacific led the market with over 40% share in 2024, supported by large-scale transmission projects and renewable integration. North America accounted for 28% share, driven by grid modernization and renewable energy expansion, while Europe held 20% share, supported by offshore wind and interconnection projects.

Market Insights
- The variable shunt reactor market was valued at USD 1.49 billion in 2024 and is projected to reach USD 2.69 billion by 2032, growing at a CAGR of 7.6% during the forecast period.
- Rising investments in transmission infrastructure and renewable integration drive demand, with oil-immersed reactors holding over 70% share due to high reliability and suitability for high-voltage networks.
- Smart grid adoption and digital monitoring systems are key trends, enabling real-time voltage regulation and predictive maintenance for improved grid efficiency.
- Key players such as Hitachi Energy, Siemens Energy, GE, Fuji Electric, and Hyosung Heavy Industries focus on capacity expansion, turnkey grid solutions, and R&D in ultra-high voltage (UHV) designs to strengthen market presence.
- Asia-Pacific led with over 40% share, followed by North America at 28% and Europe at 20%, while utility applications accounted for around 65% share, making them the dominant end-use segment globally.
Market Segmentation Analysis:
By Phase
Oil-immersed variable shunt reactors dominated the market, capturing over 70% share in 2024. Their dominance is driven by superior cooling efficiency, reliable operation under high-voltage conditions, and longer service life compared to dry-type designs. Utilities prefer oil-immersed units for transmission and distribution networks where load fluctuation control and reactive power compensation are critical. Dry-type reactors held the remaining share, favored for urban substations and indoor installations due to compact design and lower fire risk. Rising grid investments and expansion of high-voltage transmission lines support continued demand for oil-immersed designs.
- For instance, Hitachi Energy announced in late 2024 the development of a 500 kV variable shunt reactor. The reactor was manufactured for the Dzhankeldy wind farm in Uzbekistan, where it will enhance grid stability and reliability.
By Insulation
Utility applications accounted for around 65% share in 2024, making them the leading end-user segment. Growing electricity consumption, grid modernization projects, and integration of renewable energy sources drive the need for variable shunt reactors to stabilize voltage and control reactive power flow. Industrial users represent a smaller share, using reactors in large manufacturing plants and heavy industries with fluctuating power loads. Increasing smart grid deployment and expansion of high-voltage transmission corridors further boost reactor adoption to improve grid reliability and minimize energy losses.
- For instance, CG Power and Industrial Solutions Limited has over 30 years of experience designing and manufacturing gapped-core shunt reactors and has delivered more than 800 shunt reactors globally.
By End-Use
The 220 kV to 400 kV voltage range held nearly 50% share in 2024, making it the most significant segment. These reactors are widely deployed in high-voltage transmission systems to optimize power flow, minimize voltage deviations, and improve network efficiency. Reactors below 220 kV are common in distribution networks and regional substations, while those above 400 kV serve ultra-high voltage grids and cross-border transmission projects. Rising demand for reliable power supply and investments in interregional transmission infrastructure will continue driving growth in the 220–400 kV segment through 2032.
Key Growth Drivers
Rising Demand for Grid Stability
The growing need to maintain grid stability is a major driver for the variable shunt reactor market. These reactors help control reactive power flow and stabilize voltage levels, which is crucial as electricity demand rises globally. Utilities are investing heavily in smart grid infrastructure and transmission network upgrades, particularly in developing countries. Integration of renewable energy sources such as wind and solar further increases voltage fluctuations, driving demand for reliable reactive power compensation. This trend ensures a steady rise in reactor installations across transmission and distribution networks.
- For instance, in 2024, Siemens Energy announced investments in a North Carolina factory to manufacture high-voltage power transformers for the US market. This move supports grid modernization and the integration of renewable energy sources, which benefit from smart grid technologies like those incorporating PMUs for advanced grid monitoring and stability.
Expansion of Transmission Infrastructure
The rapid expansion of high-voltage transmission lines is fueling market growth. Governments and utilities are investing in interregional and cross-border transmission projects to meet growing electricity demand and enhance energy security. Variable shunt reactors are essential in these projects to regulate voltage, minimize losses, and optimize power transfer capacity. Developing economies, particularly in Asia-Pacific and the Middle East, are deploying these systems in new substations and transmission corridors, creating a strong pipeline of projects that will continue to support market expansion through the forecast period.
- For instance, the global shunt reactor market saw significant activity in the Asia-Pacific region in 2024, with various manufacturers supplying equipment for regional grid projects. Separately, CHINT delivered a high-voltage, oil-immersed variable shunt reactor for a grid stability project in Central Europe in 2024.
Integration of Renewable Energy Sources
The global energy transition is driving a surge in renewable energy generation, which creates variable power output and reactive power imbalances in the grid. Variable shunt reactors play a crucial role in stabilizing voltage and preventing overvoltage issues caused by fluctuating renewable inputs. As solar and wind capacities grow rapidly, particularly in China, India, and Europe, utilities increasingly deploy reactors to ensure grid reliability. Supportive policies and renewable energy targets worldwide will continue to stimulate demand for advanced variable shunt reactor installations in the coming years.
Key Trends & Opportunities
Adoption of Smart Grid Technologies
Smart grid development is a key trend enabling greater control and automation of power systems. Variable shunt reactors are being integrated with digital monitoring and control systems to provide real-time voltage regulation and improve overall grid efficiency. Advanced solutions offer remote operability and predictive maintenance features, reducing downtime and operating costs. The opportunity lies in offering smart, IoT-enabled reactors to utilities focusing on digital transformation and grid automation, particularly in mature markets such as North America and Europe where grid modernization is a priority.
- For instance, in 2024, GE Vernova's Grid Solutions business received multi-million dollar orders to supply dozens of 765 kV shunt reactors for projects in India to support renewable energy integration.
Growing Investment in Ultra-High Voltage Projects
The rise in ultra-high voltage (UHV) transmission projects presents significant growth opportunities for the market. UHV networks are essential for long-distance, bulk power transmission with minimal losses. Variable shunt reactors rated above 400 kV are increasingly being deployed to manage reactive power in these networks. China, India, and GCC countries are leading investments in UHV corridors, and similar projects are under consideration in Europe. Manufacturers focusing on high-capacity, reliable reactor designs stand to gain as demand for UHV systems accelerates globally.
- For instance, Siemens Energy manufactures variable shunt reactors with different power capacities and voltage levels to enhance grid stability in ultra-high-voltage transmission corridors worldwide. These reactors are key components of Flexible AC Transmission Systems (FACTS), and their ability to absorb reactive power is essential for managing voltage fluctuations, particularly with the integration of renewable energy sources.
Key Challenges
High Capital and Installation Costs
One of the major challenges for the variable shunt reactor market is the high capital cost associated with manufacturing and installing these systems. Utilities often face budget constraints, which can delay or reduce the scale of deployment. Additionally, installation in existing substations may require significant upgrades and space allocation. These costs can deter smaller utilities from adopting advanced solutions, slowing market growth. Vendors are working to develop more cost-efficient designs and modular systems to make adoption financially feasible.
Technical Complexity and Maintenance Requirements
Variable shunt reactors involve sophisticated design and require precise control for optimal performance. Any failure or misoperation can lead to voltage instability and grid disturbances. Maintenance and calibration demand skilled personnel, which can be a challenge in developing regions with limited technical expertise. Unplanned outages also increase operational costs for utilities. Manufacturers are addressing this challenge by offering training programs, digital diagnostics, and predictive maintenance solutions, but the complexity of operation remains a barrier to widespread adoption.
Regional Analysis
Asia-Pacific
Asia-Pacific led the variable shunt reactor market with over 40% share in 2024, driven by extensive transmission network expansion and renewable energy integration in China, India, and Southeast Asia. Governments are investing in grid modernization projects to handle rising electricity consumption and maintain stability amid fluctuating loads. High-voltage and ultra-high-voltage (UHV) projects across China and India are key growth drivers, boosting demand for reactors rated between 220 kV and 765 kV. Local manufacturing capabilities, supportive policies, and increasing adoption of smart grid technologies continue to make Asia-Pacific the largest and fastest-growing regional market.
North America
North America accounted for around 28% share in 2024, supported by aging grid infrastructure upgrades and integration of renewable power sources. Utilities in the United States and Canada are deploying variable shunt reactors to minimize transmission losses and stabilize voltage in long transmission lines. Rising investments in wind and solar energy projects, particularly in Texas and the Midwest, are accelerating demand for voltage regulation equipment. Digitalization initiatives and adoption of advanced monitoring systems are further enhancing reactor efficiency. Government funding for grid resilience and modernization programs will sustain steady growth across the region through the forecast period.
Europe
Europe captured around 20% share in 2024, driven by the region’s strong focus on energy transition and renewable integration. Countries such as Germany, France, and the UK are investing heavily in offshore wind and cross-border transmission projects, which require advanced reactive power compensation solutions. The adoption of variable shunt reactors supports voltage stability and compliance with stringent grid codes across the EU. Modernization of aging infrastructure and expansion of high-voltage transmission networks in Eastern Europe are further boosting demand. Efforts to create a unified European power grid are expected to provide additional opportunities for reactor deployment.
Latin America
Latin America held about 7% share in 2024, supported by ongoing grid development projects in Brazil, Mexico, and Chile. Expansion of renewable energy capacity, particularly wind and solar farms, drives the need for reactive power compensation equipment. Governments are investing in high-voltage transmission corridors to connect remote generation sites with major load centers. Utilities prefer oil-immersed variable shunt reactors for their reliability in high-load conditions. Increasing foreign investments in energy infrastructure and the privatization of power sectors in some countries are creating opportunities for manufacturers and technology providers in the region.
Middle East & Africa
The Middle East & Africa region accounted for 5% share in 2024, driven by rising electricity demand, urbanization, and large-scale infrastructure development projects. GCC countries are expanding their power grids to support industrial growth and interconnection initiatives, which boosts the installation of high-capacity reactors. Africa is witnessing gradual growth, with countries such as South Africa and Egypt focusing on grid reinforcement and renewable energy integration. Investment in smart substations and high-voltage transmission lines is expected to accelerate demand. Local manufacturing and partnerships are becoming crucial to meet cost efficiency and project execution timelines in this region.
Market Segmentations:
By Phase
- Single phase
- Three phase
By Insulation
- Oil immersed
- Air core
By End use
- Electric utility
- Renewable energy
By Geography
- North America
- U.S.
- Canada
- Mexico
- Europe
- Germany
- France
- U.K.
- Italy
- Spain
- Rest of Europe
- Asia Pacific
- China
- Japan
- India
- South Korea
- South-east Asia
- Rest of Asia Pacific
- Latin America
- Brazil
- Argentina
- Rest of Latin America
- Middle East & Africa
- GCC Countries
- South Africa
- Rest of the Middle East and Africa
Competitive Landscape
The competitive landscape of the variable shunt reactor market is shaped by leading players such as Hitachi Energy, GBE, Siemens Energy, Getra, Hyosung Heavy Industries, Nissin Electric, CG Power & Industrial Solutions, GE, Fuji Electric, and SGB Smit. These companies compete through technological innovation, manufacturing capacity, and global service networks. Key strategies include expanding production facilities, collaborating with utilities for turnkey grid solutions, and developing advanced digitally monitored reactors for smart grid integration. Manufacturers are also focusing on energy-efficient and compact designs to meet space-constrained substation requirements. Strategic partnerships and supply chain strengthening are common, particularly in Asia-Pacific and the Middle East, where major transmission projects are under development. R&D investment in ultra-high voltage (UHV) and low-loss designs positions these players to address the rising demand for voltage stability and grid reliability in regions undergoing rapid renewable energy integration and transmission expansion.
Key Player Analysis
- Hitachi Energy
- GBE
- Siemens Energy
- Getra
- Hyosung Heavy Industries
- Nissin Electric
- CG Power & Industrial Solutions
- GE
- Fuji Electric
- SGB Smit
Recent Developments
- In August 2025, Hitachi Energy delivered shunt reactors to NKT’s new HV test center.
- In June 2025, CG Power & Industrial Solutions bagged a ₹641 crore PGCIL order including shunt reactors.
- In May 2025, GE Vernova won POWERGRID India orders for 765 kV shunt reactors.
- In October 2024, Hitachi Energy has scaled its variable shunt reactor to 500 kV to enhance grid stability for wind power applications. This development aims to address the increasing demand for flexible and efficient solutions in renewable energy transmission, particularly for wind energy integration.
Report Coverage
The research report offers an in-depth analysis based on Phase, Insulation, End use and Geography. It details leading market players, providing an overview of their business, product offerings, investments, revenue streams, and key applications. Additionally, the report includes insights into the competitive environment, SWOT analysis, current market trends, as well as the primary drivers and constraints. Furthermore, it discusses various factors that have driven market expansion in recent years. The report also explores market dynamics, regulatory scenarios, and technological advancements that are shaping the industry. It assesses the impact of external factors and global economic changes on market growth. Lastly, it provides strategic recommendations for new entrants and established companies to navigate the complexities of the market.
Future Outlook
- The market will grow steadily as demand for grid stability solutions increases.
- Oil-immersed reactors will remain the preferred choice for high-voltage transmission networks.
- Smart grid adoption will boost demand for digitally monitored and automated reactors.
- Renewable energy integration will drive installations to manage fluctuating power flows.
- Utility applications will continue to dominate due to grid modernization investments.
- Manufacturers will focus on compact, energy-efficient, and low-loss reactor designs.
- Asia-Pacific will remain the largest and fastest-growing regional market.
- Ultra-high voltage projects will create opportunities for advanced high-capacity reactors.
- Strategic collaborations and turnkey project solutions will strengthen competitive positioning.
- R&D in digital diagnostics and predictive maintenance will enhance reactor reliability.
Request a Free Sample
Fill in your details and we'll send you a free sample report.
- Sample data tables & charts
- Research methodology
Need a Custom Version of This Report?
Tailor the scope, geography, or segments to your exact requirements.
- Custom geography or segment scope
- Direct access to our analyst team
Frequently Asked Questions
What is the current market size for Variable Shunt Reactor market, and what is its projected size in 2032?
At what Compound Annual Growth Rate is the Variable Shunt Reactor market projected to grow between 2025 and 2032?
Which Variable Shunt Reactor market segment held the largest share in 2024?
What are the primary factors fueling the growth of the Variable Shunt Reactor market?
Who are the leading companies in the Variable Shunt Reactor market?
Which region commanded the largest share of the Variable Shunt Reactor market in 2024?
Table of Content
Chapter 1. Report Introduction
- 1.1 Report Description & Purpose
- 1.1.1 Report Title & Market Definition
- 1.1.2 Unique Selling Propositions (USP) & Key Differentiators
- 1.1.3 Value Proposition for Stakeholders
- 1.2 Research Objectives
- 1.2.1 Market Sizing Objectives (Volume & Revenue)
- 1.2.2 Segmentation Objectives
- 1.2.3 Competitive Intelligence Objectives
- 1.2.4 Forecast & Scenario Objectives
- 1.3 Report Scope
- 1.3.1 Variable Shunt Reactor Scope – Types & Subtypes Covered
- 1.3.2 Geographic Scope – Regions & Countries Covered
- 1.3.3 Historical Period, Base Year & Forecast Period (2024; forecast to 2032)
- 1.3.4 Inclusions & Exclusions
- 1.4 HS Code & Classification Framework
- 1.5 Currency, Units & Pricing Basis
- 1.6 Target Stakeholders
- 1.7 Limitations & Assumptions
Chapter 2. Executive Summary
- 2.1 Global Variable Shunt Reactor Market Snapshot
- 2.1.1 Market Size – Historical (2024) & Forecast (2024-2032) (2024: USD 1.49 billion → 2032: USD 2.69 billion)
- 2.1.2 Volume & Revenue – Global Totals
- 2.1.3 Key Market Highlights – Top Five Facts
- 2.2 Variable Shunt Reactor Market Segmentation Snapshot
- 2.2.1 Market Split by Region – 2024 vs. 2032
- 2.3 Competitive Snapshot
- 2.3.1 Top 10 Players by Revenue Share – 2024
- 2.3.2 Top 10 Players by Volume Share – 2024
- 2.3.3 Recent Strategic Developments (18-Month Summary)
- 2.4 Key Investment Highlights & Strategic Conclusions
Chapter 3. Variable Shunt Reactor Market Dynamics & Industry Analysis
- 3.1 Market Overview & Context
- 3.1.1 Variable Shunt Reactor Market Position in the Broader Automotive Value Chain
- 3.1.2 OEM vs. Replacement Market Dynamics
- 3.1.3 Market Maturity & Development Stage by Region
- 3.2 Variable Shunt Reactor Market Drivers
- 3.3 Variable Shunt Reactor Market Restraints & Challenges
- 3.4 Variable Shunt Reactor Market Opportunities
- 3.5 Porter's Five Forces Analysis
- 3.5.1 Threat of New Entrants
- 3.5.2 Bargaining Power of Suppliers
- 3.5.3 Bargaining Power of Buyers
- 3.5.4 Threat of Substitutes
- 3.5.5 Competitive Rivalry – Intensity Assessment
- 3.6 Variable Shunt Reactor Value Chain Analysis
- 3.6.1 Upstream – Raw Material/Input Suppliers
- 3.6.1.1 Raw Material/Input 1
- 3.6.1.2 Raw Material/Input 2
- 3.6.1.3 Raw Material/Input 3
- 3.6.2 Midstream – Production/Manufacturing/Service Delivery
- 3.6.2.1 Production/Process Overview
- 3.6.2.2 Key Facility Locations & Capacity by Manufacturer
- 3.6.3 Downstream – Distribution & End Consumer
- 3.6.3.1 Primary Channel – B2B/OEM
- 3.6.3.2 Secondary Channels – Dealer, Retail, Online, Direct
- 3.6.4 Value Chain Profitability Analysis
- 3.6.1 Upstream – Raw Material/Input Suppliers
- 3.7 PESTEL Analysis
- 3.7.1 Political Factors
- 3.7.2 Economic Factors
- 3.7.3 Social Factors
- 3.7.4 Technological Factors
- 3.7.5 Environmental Factors
- 3.7.6 Legal Factors
- 3.8 Variable Shunt Reactor Supply Chain Analysis
- 3.8.1 Raw Material/Input Supply Risk Assessment
- 3.8.2 Manufacturing Concentration Risk (Geographic Exposure)
- 3.8.3 Trade Disruption Impact Analysis
- 3.9 Regulatory & Policy Landscape
Note: The regulatory and policy landscape section covers regulations based on their applicability to the market, Variable Shunt Reactor category, geography, and scope of the study. Only regulatory frameworks with a material impact on operations, compliance, trade, sustainability, or market access are analyzed in detail.
Chapter 4. Key Investment Pockets & Opportunity Analysis
- 4.1 Variable Shunt Reactor Market Attractiveness Analysis
- 4.1.1 By Region – Investment Attractiveness Matrix (Volume × CAGR)
- 4.2 Absolute Revenue Growth Opportunity
- 4.2.1 By Region – Absolute USD Growth Through 2032
- 4.3 Incremental Volume Opportunity
- 4.3.1 By Region – Incremental Volume Through 2032
- 4.3.2 Segment – Incremental Volume
- 4.4 Emerging Submarket Opportunity Deep Dive (Subject to Applicability)
- 4.5 Emerging Market Opportunity Scorecards
- 4.5.1 United States
- 4.5.2 Europe
- 4.5.3 Asia
- 4.5.4 Middle East & Africa
Note: Emerging Market Opportunity Scorecards will be included based on relevance and strategic importance. Regions listed are indicative and may vary depending on data availability and market dynamics.
Chapter 5. Variable Shunt Reactor Import-Export Analysis & Trade Flows
- 5.1 Global Trade Overview
- 5.1.1 Global Export Value by Country (2024)
- 5.1.2 Global Export Volume by Country (2024)
- 5.1.3 Global Import Value by Country (2024)
- 5.1.4 Global Import Volume by Country (2024)
- 5.1.5 Net Trade Balance by Country (2024)
- 5.2 Export Analysis – Segment
- 5.2.1 Type 1 (HS Code)
- 5.2.2 Type 2 (HS Code)
- 5.2.3 Type 3 (HS Code)
- 5.2.4 Type 4 (HS Code)
- 5.2.5 Type 5 (HS Code)
- 5.3 Import Analysis – Segment
- 5.3.1 Type 1 (HS Code)
- 5.3.2 Type 2 (HS Code)
- 5.3.3 Type 3 (HS Code)
- 5.3.4 Type 4 (HS Code)
- 5.3.5 Type 5 (HS Code)
- 5.4 Average Unit Trade Prices
- 5.4.1 Average Export Price – Segment & Country
- 5.4.2 Average Import Price – Segment & Source Country
- 5.4.3 Price Trends (2024)
- 5.5 Key Trade Route Analysis
- 5.5.1 Trade Route 1
- 5.5.2 Trade Route 2
- 5.5.3 Trade Route 3
- 5.5.4 Trade Route 4
- 5.5.5 Trade Route 5
- 5.6 Trade Policy Impact Assessment
- 5.6.1 US Anti-Dumping & Section 301 Tariffs
- 5.6.2 EU Customs Union Impact
- 5.6.3 Major Free Trade Agreements
- 5.6.4 USMCA Rules of Origin
Note: Trade policy analysis will be included only where relevant to the Variable Shunt Reactor market.
Chapter 6. Competitive Landscape & Company Benchmarking
- 6.1 Variable Shunt Reactor Market Concentration & Structure
- 6.1.1 Herfindahl-Hirschman Index (HHI) – vs. 2024
- 6.1.2 Tier 1, Tier 2 & Tier 3 Market Structure
- 6.1.3 Global, Regional & Local Player Dynamics
- 6.2 Variable Shunt Reactor Market Share Analysis – 2024
- 6.2.1 Global Revenue Share by Company
- 6.2.2 Global Volume Share by Company
- 6.2.3 Regional Revenue Share
- 6.2.4 Market Share Evolution ( vs. 2024)
- 6.2.5 OEM Segment Share by Company
- 6.2.6 Replacement Segment Share by Company
- 6.3 Production/Delivery Capacity & Facility Analysis
- 6.3.1 Global Installed Capacity
- 6.3.2 Capacity Utilization Rates
- 6.3.3 Production/Output Volume
- 6.3.4 Facility Locations & Capacity Map
- 6.3.5 Planned Capacity Additions
- 6.4 Variable Shunt Reactor Competitive Benchmarking Matrix
- 6.4.1 Revenue, Volume, CAGR & Profitability Comparison
- 6.4.2 Channel Revenue Mix
- 6.4.3 Geographic Revenue Exposure
- 6.4.4 R&D Intensity
- 6.4.5 Sustainability Maturity
- 6.5 Strategic Developments in Variable Shunt Reactor (Last 24 Months)
- 6.5.1 Mergers, Acquisitions & Divestments
- 6.5.2 New Variable Shunt Reactor Launches
- 6.5.3 Facility Expansions
- 6.5.4 Strategic Alliances, Joint Ventures & Partnerships
- 6.5.5 Distribution Expansion & Market Entry
- 6.5.6 Sustainability & ESG Initiatives
- 6.6 Competitive Strategy Mapping
- 6.6.1 Leader, Challenger, Follower & Niche Classification
- 6.6.2 Pricing Strategy Comparison
- 6.6.3 Channel Strategy Matrix
Note: Strategic developments are included based on their materiality and the availability of reliable information.
Chapter 7. Global Variable Shunt Reactor Market – By Distribution Channel
- 7.1 Segment Overview
- 7.1.1 Volume & Revenue Split by Channel (2024 & 2032)
- 7.1.2 Channel Mix Evolution (2024-2032)
Chapter 8. Regional Market Analysis – Global Overview
- 8.1 Global Regional Overview
- 8.1.1 Regional Volume Share
- 8.1.2 Regional Revenue Share
- 8.1.3 Regional Volume by Region
- 8.1.4 Regional Revenue by Region
- 8.1.5 Regional Forecast Through 2032
- 8.2 Cross-Regional Segment Analysis
- 8.2.1 By Distribution Channel
- 8.2.2 By Brand/Price Tier
Chapter 9. North America Variable Shunt Reactor Market
- 9.1 United States
- 9.2 Canada
- 9.3 Mexico
Chapter 10. Europe Variable Shunt Reactor Market
- 10.1 Germany
- 10.2 France
- 10.3 Italy
- 10.4 United Kingdom
- 10.5 Spain
- 10.6 Poland
- 10.7 Russia
- 10.8 Netherlands
- 10.9 Belgium
- 10.10 Sweden
- 10.11 Denmark
- 10.12 Norway
- 10.13 Rest of Europe
Chapter 11. Asia Pacific Variable Shunt Reactor Market
- 11.1 China
- 11.2 India
- 11.3 Japan
- 11.4 South Korea
- 11.5 Thailand
- 11.6 Indonesia
- 11.7 Vietnam
- 11.8 Malaysia
- 11.9 Australia
- 11.10 Rest of Asia Pacific
Chapter 12. Latin America Variable Shunt Reactor Market
- 12.1 Brazil
- 12.2 Argentina
- 12.3 Colombia
- 12.4 Chile
- 12.5 Rest of Latin America
Chapter 13. Middle East Variable Shunt Reactor Market
- 13.1 Saudi Arabia
- 13.2 United Arab Emirates
- 13.3 Turkey
- 13.4 Israel
- 13.5 Iran
- 13.6 Rest of the Middle East
Chapter 14. Africa Variable Shunt Reactor Market
- 14.1 South Africa
- 14.2 Egypt
- 14.3 Nigeria
- 14.4 Morocco
- 14.5 Rest of Africa
Chapter 15. Variable Shunt Reactor Company Profiles
- 15.1 [Company 01]
- 15.1.1 Company Overview
- 15.1.2 Key Management Personnel
- 15.1.3 Products & Services Portfolio
- 15.1.4 Financial Performance
- 15.1.5 Key Market Focus & Geographic Presence
- 15.1.6 Recent Developments & Strategic Initiatives
Note: The company profile list is preliminary and may change based on research findings, market developments, data availability, and client requirements.
Chapter 16. Appendices
- Appendix A – List of Abbreviations & Acronyms
- Appendix B – Industry Classification Code Reference – Full Series
- Appendix C – Production & Capacity Data Tables
- Appendix D – End-Use & Demand Base Tables
- Appendix E – Consumption & Replacement Rate Assumptions
- Appendix F – ASP Reference Tables
- Appendix G – Manufacturing & Facility Database
- Appendix H – Import-Export Data Tables
- Appendix I – Regulatory Summary Tables
- Appendix J – Primary Research Participant List (Anonymized)
- Appendix K – Primary Research Questionnaire Framework
- Appendix L – Data Sources & Bibliography
- Appendix M – Market Size Divergence & Source Comparison
Chapter 17. Research Methodology
- 17.1 Research Framework & Philosophy
- 17.2 Secondary Research – Sources, Hierarchy & Data Extraction
- 17.3 Data Modeling – Bottom-Up & Top-Down Market Sizing
- 17.4 Primary Research – Stakeholder Framework, LOI & Sample Sizes
- 17.5 Forecast Methodology – Regression, Scenario & Sensitivity Analysis
- 17.6 Quality Control – Four-Layer Validation Framework
- 17.7 Limitations & Standard Assumptions
- 17.8 Disclaimer
