
Market Overview
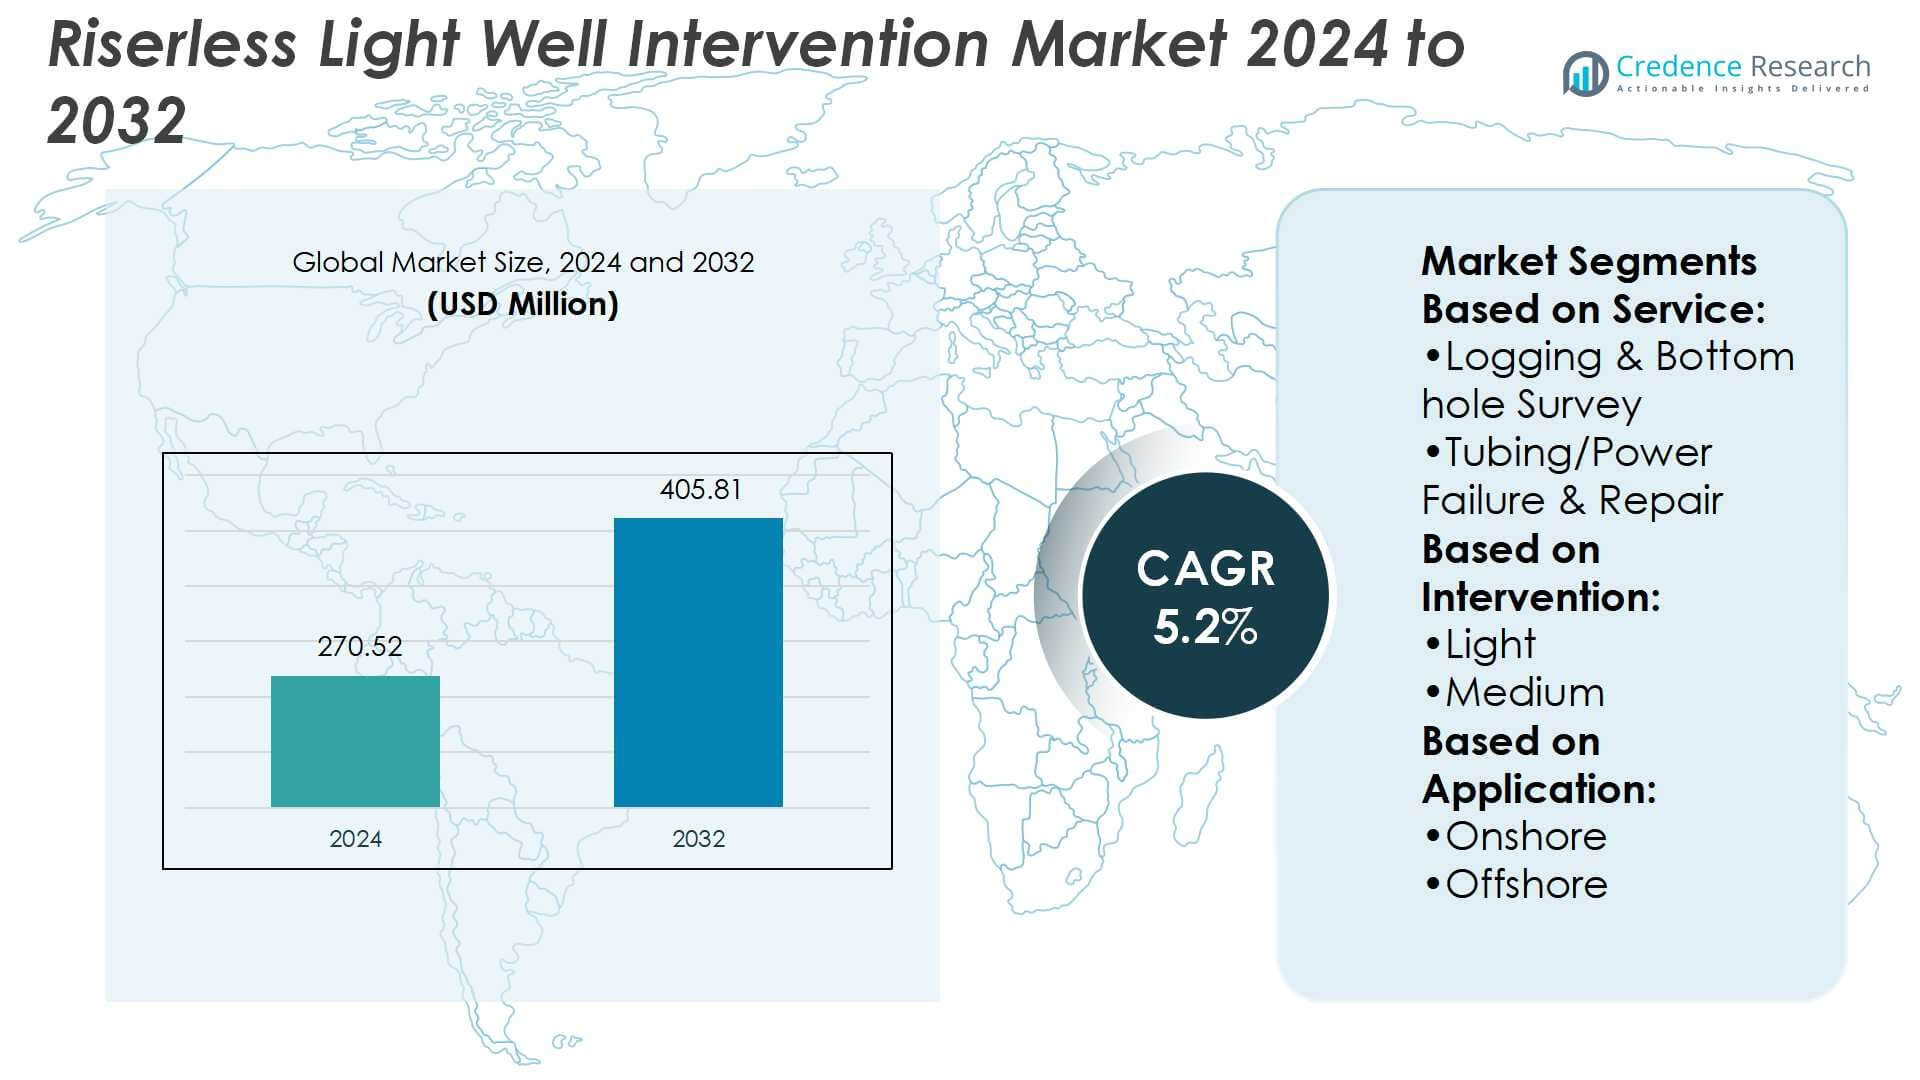
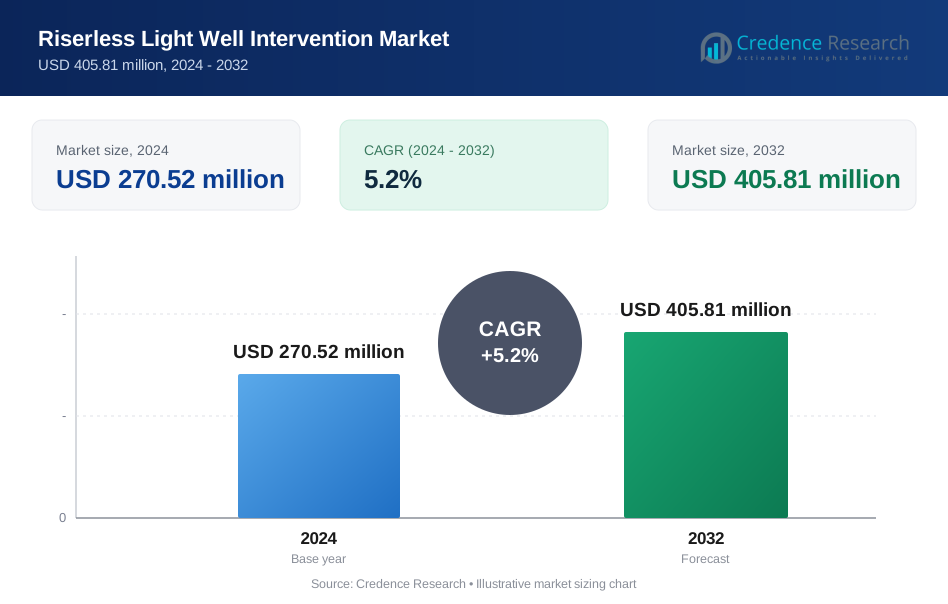
Riserless Light Well Intervention Market size was valued USD 270.52 million in 2024 and is anticipated to reach USD 405.81 million by 2032, at a CAGR of 5.2% during the forecast period.
| REPORT ATTRIBUTE | DETAILS |
|---|---|
| Historical Period | 2020-2023 |
| Base Year | 2024 |
| Forecast Period | 2025-2032 |
| Riserless Light Well Intervention Market Size 2024 | USD 270.52 Million |
| Riserless Light Well Intervention Market, CAGR | 5.2% |
| Riserless Light Well Intervention Market Size 2032 | USD 405.81 Million |
The riserless light well intervention (RLWI) market is shaped by leading players such as Expro, ExxonMobil, Halliburton, Aramco, NOV, Emdad, Baker Hughes, Oceaneering, Hunting Energy, and Nortech. These companies compete through technological advancements, vessel upgrades, and digital integration to improve operational efficiency and safety in offshore interventions. Strategic collaborations and regional partnerships further enhance their global presence, particularly in deepwater and ultra-deepwater projects. North America leads the RLWI market with a 35% share, driven by extensive offshore activity in the Gulf of Mexico, strong infrastructure, and the presence of established service providers ensuring consistent demand growth.
Market Insights
- The riserless light well intervention market was valued at USD 270.52 million in 2024 and is projected to reach USD 405.81 million by 2032, growing at a CAGR of 5.2%.
- Market growth is driven by the need for cost-efficient offshore well maintenance, rising offshore exploration, and increasing demand for interventions in aging subsea wells.
- Key trends include adoption of digital technologies, automation, and vessel upgrades that enhance safety and efficiency in deepwater and ultra-deepwater projects.
- Intense competition among Expro, ExxonMobil, Halliburton, Aramco, NOV, Emdad, Baker Hughes, Oceaneering, Hunting Energy, and Nortech fosters continuous innovation, though high initial investment and technical complexity remain restraints.
- North America leads with 35% share due to strong offshore activity in the Gulf of Mexico, while the logging and bottom hole survey segment dominates the service category with over 25% share, supported by its role in optimizing subsea production and reducing operational downtime.
 Market Segmentation Analysis:
By Service
Within the riserless light well intervention market, the logging and bottom hole survey segment holds the largest share, accounting for over 25% of total demand. Its dominance stems from the critical role in evaluating reservoir conditions, identifying production zones, and ensuring accurate well diagnostics without costly drilling operations. Operators increasingly rely on advanced downhole logging tools for real-time data, enabling optimized decision-making and reduced non-productive time. Growing offshore exploration, aging wells, and the demand for cost-efficient monitoring continue to drive the adoption of these services worldwide.
- For instance, ExxonMobil has run FWI on 3-D seismic surveys using higher frequencies and more complex simulation physics than older industry methods.Their work with elastic FWI (eFWI) also reflects the use of advanced simulation physics.
By Intervention
The light intervention segment leads the market with over 40% share, supported by its ability to provide cost-effective well maintenance without heavy equipment. Light interventions use wireline, slickline, or coiled tubing techniques, making them highly suitable for routine tasks such as inspection, cleaning, and data gathering. Their reduced complexity lowers operational costs and minimizes environmental risks compared to medium or high interventions. The shift toward shallow and mature field optimization strongly supports the dominance of light interventions, particularly in offshore regions where efficiency and safety are priorities.
- For instance, Halliburton’s ClearTrac wireline tractor can travel between 5 and 125 feet per minute in highly deviated or horizontal wells while carrying payloads up to 1,000 lbs with a single-drive section.
By Application
The offshore segment dominates with a 65% market share, driven by rising deepwater and ultra-deepwater exploration projects. Offshore operations demand riserless light well intervention due to their ability to reduce costs compared to traditional drilling methods while maintaining safety and production efficiency. Increased investment in subsea fields, particularly in regions such as the North Sea, Gulf of Mexico, and West Africa, amplifies demand for offshore deployment. The growing number of aging subsea wells requiring maintenance and productivity enhancement further consolidates offshore as the leading application segment.
Key Growth Drivers
Cost-Effective Well Maintenance
The primary growth driver for the riserless light well intervention (RLWI) market is its ability to deliver cost-effective well maintenance. RLWI eliminates the need for large drilling rigs, reducing operational costs by nearly 40–50% compared to conventional methods. This cost advantage is particularly important for operators managing mature wells and marginal fields, where cost efficiency directly impacts profitability. Growing demand for low-cost production enhancement in offshore assets, combined with the focus on maximizing existing field recovery, strongly supports the adoption of RLWI technologies globally.
- For instance, Aramco developed an ultrasonic acoustic logging workflow that evaluated 19-inch outer diameter fiberglass (GRE) casings using wireline acoustic logs. The method mapped cement coverage in 360° azimuth at a spatial resolution close to 5°.
Rising Offshore Exploration and Production
Increasing offshore exploration and production (E&P) activities drive strong demand for RLWI systems. Deepwater and ultra-deepwater reserves in regions such as the Gulf of Mexico, North Sea, and West Africa require frequent intervention to maintain production rates. RLWI offers safe and efficient well access in subsea environments, ensuring reliability in challenging conditions. With operators expanding investments in subsea fields and prioritizing production optimization, RLWI continues to gain preference. The rising offshore drilling pipeline reinforces the market’s growth trajectory during the forecast period.
- For instance, NOV’s TerraPULSE™ Coiled Tubing Agitator achieved a total depth of 27,005 ft in Saudi Arabia while handling a lateral section exceeding 18,300 ft with a 60° azimuth turn, using a 3⅛-in diameter tool.
Growing Number of Aging Wells
The global increase in aging oil and gas wells serves as a significant driver for RLWI adoption. Many wells, particularly in the North Sea and mature offshore fields, require intervention to sustain production levels and extend well life. RLWI provides a practical solution by enabling remedial activities such as zonal isolation, sand control, and artificial lift installation without extensive downtime. The ability to enhance recovery rates from declining wells ensures continuous demand. This trend aligns with industry goals to maximize asset utilization and improve return on investment.
Key Trends & Opportunities
Integration of Digital Technologies
A notable trend in the RLWI market is the integration of digital technologies, including real-time monitoring, predictive analytics, and automation. These solutions enhance decision-making during well interventions by improving accuracy and reducing operational risks. Digital tools allow operators to predict equipment failures, optimize intervention strategies, and minimize downtime. Companies are investing in connected systems that provide end-to-end visibility of subsea operations. The adoption of digitalization presents opportunities for service providers to deliver higher value-added solutions, strengthening their competitive positioning in the evolving RLWI market.
- For instance, While the reference is to a broader 15,000 psi-rated multistage completion system, it is designed for use in extreme downhole conditions alongside technologies like SureCONNECT FE.
Expansion into Deepwater and Ultra-Deepwater Fields
The increasing focus on deepwater and ultra-deepwater fields presents significant opportunities for the RLWI market. These fields require advanced intervention technologies to ensure production reliability under high-pressure, high-temperature conditions. RLWI systems provide safe and efficient solutions without the need for heavy riser setups, making them well-suited for such environments. With exploration shifting toward deeper reserves to meet energy demand, service providers can leverage RLWI to expand their service portfolios. This expansion into frontier fields reinforces the long-term growth prospects of the market.
- For instance, Oceaneering’s IRIS and BORIS RLWI systems are designed for depths up to 10,000 ft (≈ 3,000 m) and working pressures up to 10,000 psi.
Key Challenges
High Initial Capital Investment
Despite its cost-saving benefits, RLWI requires high initial investment in specialized vessels, intervention systems, and advanced tools. Smaller operators often face financial constraints in adopting these solutions, limiting market penetration in cost-sensitive regions. The capital-intensive nature of RLWI infrastructure acts as a barrier, especially when oil prices fluctuate, impacting operators’ spending capacity. This challenge slows adoption in developing offshore regions, where cost recovery cycles are longer. Addressing these investment hurdles is crucial to unlock broader deployment and sustain market growth.
Operational Risks and Technical Complexity
The RLWI market faces challenges related to operational risks and technical complexity in subsea environments. Interventions in deepwater and ultra-deepwater wells involve high pressure, extreme temperatures, and complex geology, which increase the risk of equipment failure and operational delays. Ensuring safety and reliability under such demanding conditions requires advanced technologies and highly skilled personnel, raising operational costs. Additionally, technical limitations in handling high intervention complexity restrict the scope of RLWI in certain wells. Overcoming these risks is essential for wider industry adoption and confidence.
Regional Analysis
North America
North America dominates the riserless light well intervention (RLWI) market with a 35% share, supported by extensive offshore activity in the Gulf of Mexico. The region benefits from advanced offshore infrastructure, mature subsea wells, and a strong presence of leading service providers. Operators focus on extending the production life of aging wells while maintaining cost efficiency, driving consistent demand for RLWI services. Regulatory support for safe intervention practices and investments in deepwater exploration further reinforce the region’s leadership. The combination of technological expertise and high offshore activity ensures North America remains a primary market driver.
Europe
Europe accounts for 28% of the global RLWI market, with the North Sea serving as a major hub. The region’s large number of aging wells creates significant demand for intervention solutions aimed at maximizing recovery rates. Governments and operators prioritize cost-effective methods, making RLWI a preferred choice over traditional rig-based systems. Norway and the United Kingdom lead in adoption, supported by strong regulatory frameworks and established offshore infrastructure. Continuous investment in digital integration and sustainability-driven practices strengthens Europe’s market position, ensuring RLWI remains a critical tool for managing production from mature subsea assets.
Asia-Pacific
Asia-Pacific holds a 20% share in the RLWI market, driven by rising offshore exploration and production projects in countries such as Malaysia, China, and Australia. The region’s growing energy demand compels operators to maximize recovery from offshore fields while keeping costs under control. Shallow-water and deepwater activities across Southeast Asia present strong opportunities for RLWI adoption. Local governments support offshore expansion with favorable policies and investments in subsea technologies. While the market is still developing compared to Europe and North America, Asia-Pacific’s increasing offshore footprint makes it a key growth region during the forecast period.
Latin America
Latin America accounts for 7% of the global RLWI market, with Brazil leading adoption due to its extensive deepwater and pre-salt reserves. The country’s offshore sector requires continuous intervention to maintain production efficiency in high-pressure, high-temperature wells. Mexico also contributes through its offshore Gulf projects, supported by foreign investments and reforms encouraging private participation. The region’s adoption is driven by the cost-saving potential of RLWI compared to conventional drilling rigs. While economic and regulatory challenges persist, Latin America’s vast deepwater reserves create steady demand, ensuring RLWI remains vital for regional offshore development strategies.
Middle East & Africa
The Middle East & Africa region captures 10% of the RLWI market, supported by increasing offshore development in the Persian Gulf and West Africa. National oil companies and international operators focus on enhancing recovery from offshore wells, creating demand for intervention services. Deepwater projects in Nigeria and Angola, along with new offshore exploration in Saudi Arabia and the UAE, boost market adoption. However, challenges such as high capital requirements and geopolitical risks slow expansion. Despite these hurdles, growing investment in subsea fields positions the region as a promising market for long-term RLWI deployment.
Market Segmentations:
By Service:
- Logging & Bottom hole Survey
- Tubing/Power Failure & Repair
By Intervention:
- Light
- Medium
By Application:
- Onshore
- Offshore
By Geography
- North America
- U.S.
- Canada
- Mexico
- Europe
- UK
- France
- Germany
- Italy
- Spain
- Russia
- Rest of Europe
- Asia Pacific
- China
- Japan
- South Korea
- India
- Australia
- Southeast Asia
- Rest of Asia Pacific
- Latin America
- Brazil
- Argentina
- Rest of Latin America
- Middle East
- GCC Countries
- Israel
- Turkey
- Rest of Middle East
- Africa
- South Africa
- Egypt
- Rest of Africa
Competitive Landscape
The competitive landscape of the riserless light well intervention (RLWI) market players such as Expro, ExxonMobil, Halliburton, Aramco, NOV, Emdad, Baker Hughes, Oceaneering, Hunting Energy, and Nortech. The riserless light well intervention (RLWI) market is defined by strong emphasis on technological innovation, cost efficiency, and service differentiation. Companies focus on enhancing intervention capabilities through advanced digital tools, automation, and real-time monitoring to improve accuracy and reduce operational risks. Investments in specialized intervention vessels and subsea equipment play a crucial role in meeting the growing demand for deepwater and ultra-deepwater projects. Strategic collaborations, joint ventures, and partnerships are common as service providers expand global reach and strengthen offshore portfolios. The market remains highly competitive, with players striving to deliver safer, more efficient, and sustainable solutions that align with operators’ goals of maximizing well productivity and extending the lifecycle of offshore assets. This competitive intensity drives continuous improvement in service quality, technology adoption, and regional expansion.
Key Player Analysis
- Expro
- ExxonMobil
- Halliburton
- Aramco
- NOV
- Emdad
- Baker Hughes
- Oceaneering
- Hunting Energy
- Nortech
Recent Developments
- In March 2024, Wellvene Limited announced a partnership with Marwell AS to enhance its market presence and increase its earnings. This strategic move seeks to fulfill the region's well intervention needs and improve the efficiency of plug and abandonment tasks.
- In February 2024, Helix Energy Solutions won a contract from Esso Exploration and Production Nigeria for well intervention work at two offshore fields. The operations will begin in September 2024 at the Erha and Usan fields, which lie 97 kilometers from Nigeria's coast in waters 700-1,500 meters deep.
- In February 2024, the Norwegian-based Odfjell Technology has strengthened its Middle East market position by opening a new facility in Saudi Arabia's Eastern Province. The 10,000 sqm Qatif facility marks a fourfold increase in the company's operational capabilities.
- In June 2023, HALLIBURTON COMPANY and Nabors Industries Ltd. announced an agreement on well-construction automation solutions. The collaboration aimed to automate the drilling process and other well construction services with the help of technology.
Report Coverage
The research report offers an in-depth analysis based on Service, Intervention, Application and Geography. It details leading market players, providing an overview of their business, product offerings, investments, revenue streams, and key applications. Additionally, the report includes insights into the competitive environment, SWOT analysis, current market trends, as well as the primary drivers and constraints. Furthermore, it discusses various factors that have driven market expansion in recent years. The report also explores market dynamics, regulatory scenarios, and technological advancements that are shaping the industry. It assesses the impact of external factors and global economic changes on market growth. Lastly, it provides strategic recommendations for new entrants and established companies to navigate the complexities of the market.
Future Outlook
- The market will expand with rising demand for cost-efficient offshore well maintenance solutions.
- Digital integration and automation will enhance precision and reduce operational risks in interventions.
- Aging offshore wells will continue to drive strong demand for remedial and productivity enhancement services.
- Deepwater and ultra-deepwater projects will create new growth opportunities for advanced RLWI systems.
- Increased adoption of lightweight intervention methods will strengthen efficiency and reduce downtime.
- Regulatory focus on safety and sustainability will shape service innovations and technology upgrades.
- Strategic collaborations will support global expansion and strengthen service providers’ offshore portfolios.
- Investments in intervention vessels and subsea tools will drive competitiveness in emerging regions.
- Energy companies will prioritize RLWI to extend field life and improve asset returns.
- The market will remain highly competitive with continuous innovation in digital and subsea technologies.
Request a Free Sample
Fill in your details and we'll send you a free sample report.
- Sample data tables & charts
- Research methodology
Need a Custom Version of This Report?
Tailor the scope, geography, or segments to your exact requirements.
- Custom geography or segment scope
- Direct access to our analyst team
Frequently Asked Questions
What is the current market size for Riserless Light Well Intervention Market, and what is its projected size in 2032?
At what Compound Annual Growth Rate is the Riserless Light Well Intervention Market projected to grow between 2025 and 2032?
Which Riserless Light Well Intervention Market segment held the largest share in 2024?
What are the primary factors fueling the growth of the Riserless Light Well Intervention Market?
Who are the leading companies in the Riserless Light Well Intervention Market?
Which region commanded the largest share of the Riserless Light Well Intervention Market in 2024?
Table of Content
Chapter 1. Report Introduction
- 1.1 Report Description & Purpose
- 1.1.1 Report Title & Market Definition
- 1.1.2 Unique Selling Propositions (USP) & Key Differentiators
- 1.1.3 Value Proposition for Stakeholders
- 1.2 Research Objectives
- 1.2.1 Market Sizing Objectives (Volume & Revenue) (Volume Where Applicable)
- 1.2.2 Segmentation Objectives
- 1.2.3 Competitive Intelligence Objectives
- 1.2.4 Forecast & Scenario Objectives
- 1.3 Report Scope
- 1.3.1 Riserless Light Well Intervention Scope – Segments & Subsegments Covered
- 1.3.2 Geographic Scope – Regions & Countries Covered
- 1.3.3 Historical Period, Base Year & Forecast Period (2024; forecast to 2032)
- 1.3.4 Inclusions & Exclusions
- 1.4 Industry Classification & Applicable Codes
- 1.5 Currency, Measurement Units & Valuation Basis
- 1.6 Target Stakeholders
- 1.7 Limitations & Assumptions
Chapter 2. Executive Summary
- 2.1 Global Riserless Light Well Intervention Market Snapshot
- 2.1.1 Market Size – Historical (2024) & Forecast (2024-2032) (2024: USD 270.52 million → 2032: USD 405.81 million)
- 2.1.2 Volume & Revenue – Global Totals (Volume Where Applicable)
- 2.1.3 Key Market Highlights – Top Five Facts
- 2.2 Riserless Light Well Intervention Market Segmentation Snapshot
- 2.2.1 Market Split by Region – 2024 vs. 2032
- 2.3 Competitive Snapshot
- 2.3.1 Top 10 Players by Revenue Share – 2024
- 2.3.2 Top 10 Players by Volume Share – 2024 (Volume Where Applicable)
- 2.3.3 Recent Strategic Developments (18-Month Summary)
- 2.4 Key Investment Highlights & Strategic Conclusions
Chapter 3. Riserless Light Well Intervention Market Dynamics & Industry Analysis
- 3.1 Market Overview & Context
- 3.1.1 Riserless Light Well Intervention Market Position in the Broader Industry Value Chain
- 3.1.2 Demand Structure & Purchasing Dynamics
- 3.1.3 Market Maturity & Development Stage by Region
- 3.2 Riserless Light Well Intervention Market Drivers
- 3.3 Riserless Light Well Intervention Market Restraints & Challenges
- 3.4 Riserless Light Well Intervention Market Opportunities
- 3.5 Porter's Five Forces Analysis
- 3.5.1 Threat of New Entrants
- 3.5.2 Bargaining Power of Suppliers
- 3.5.3 Bargaining Power of Buyers
- 3.5.4 Threat of Substitutes
- 3.5.5 Competitive Rivalry – Intensity Assessment
- 3.6 Riserless Light Well Intervention Value Chain Analysis
- 3.6.1 Upstream – Key Inputs, Resources & Suppliers
- 3.6.1.1 Key Input/Resource 1
- 3.6.1.2 Key Input/Resource 2
- 3.6.1.3 Key Input/Resource 3
- 3.6.2 Midstream – Core Operations & Value Creation
- 3.6.2.1 Operating Model & Process Overview
- 3.6.2.2 Key Operating Locations & Capabilities by Company
- 3.6.3 Downstream – Market Channels & End Users
- 3.6.3.1 Direct Sales & Customer Engagement Channels
- 3.6.3.2 Indirect Sales, Intermediaries & Partner Channels
- 3.6.4 Value Chain Profitability Analysis
- 3.6.1 Upstream – Key Inputs, Resources & Suppliers
- 3.7 PESTEL Analysis
- 3.7.1 Political Factors
- 3.7.2 Economic Factors
- 3.7.3 Social Factors
- 3.7.4 Technological Factors
- 3.7.5 Environmental Factors
- 3.7.6 Legal Factors
- 3.8 Riserless Light Well Intervention Supply Chain Analysis
- 3.8.1 Critical Input & Resource Availability Risk Assessment
- 3.8.2 Supplier & Operational Concentration Risk (Geographic Exposure)
- 3.8.3 Supply & Service Disruption Impact Analysis
- 3.9 Regulatory & Policy Landscape
Note: The regulatory and policy landscape section covers regulations based on their applicability to the market, Riserless Light Well Intervention category, geography, and scope of the study. Only regulatory frameworks with a material impact on operations, compliance, trade, sustainability, or market access are analyzed in detail.
Chapter 4. Key Investment Pockets & Opportunity Analysis
- 4.1 Riserless Light Well Intervention Market Attractiveness Analysis
- 4.1.1 By Region – Investment Attractiveness Matrix (Market Size × CAGR)
- 4.2 Absolute Revenue Growth Opportunity
- 4.2.1 By Region – Absolute Revenue Growth Through 2032
- 4.3 Incremental Demand Opportunity
- 4.3.1 By Region – Incremental Demand Through 2032
- 4.3.2 Segment – Incremental Demand
- 4.4 Emerging Submarket Opportunity Deep Dive (Subject to Applicability)
- 4.5 Priority Market Opportunity Scorecards
- 4.5.1 United States
- 4.5.2 Europe
- 4.5.3 Asia
- 4.5.4 Middle East & Africa
Note: Priority market opportunity scorecards reflect the geographic scope and strategic relevance of the study. Listed markets are indicative and may be adapted to the industry.
Chapter 5. Riserless Light Well Intervention Cross-Border Trade & Market Access Analysis
- 5.1 International Trade & Cross-Border Activity Overview
- 5.1.1 Global Export Value by Country (2024)
- 5.1.2 Global Export Volume by Country (2024) (Volume Where Applicable)
- 5.1.3 Global Import Value by Country (2024)
- 5.1.4 Global Import Volume by Country (2024) (Volume Where Applicable)
- 5.1.5 Net Trade Balance by Country (2024)
- 5.2 Export Analysis – Segment
- 5.2.1 Category 1 (Applicable Classification Code)
- 5.2.2 Category 2 (Applicable Classification Code)
- 5.2.3 Category 3 (Applicable Classification Code)
- 5.2.4 Category 4 (Applicable Classification Code)
- 5.2.5 Category 5 (Applicable Classification Code)
- 5.3 Import Analysis – Segment
- 5.3.1 Category 1 (Applicable Classification Code)
- 5.3.2 Category 2 (Applicable Classification Code)
- 5.3.3 Category 3 (Applicable Classification Code)
- 5.3.4 Category 4 (Applicable Classification Code)
- 5.3.5 Category 5 (Applicable Classification Code)
- 5.4 Cross-Border Pricing & Transaction Benchmarks
- 5.4.1 Export Pricing – Segment & Country
- 5.4.2 Import Pricing – Segment & Source Country
- 5.4.3 Price Trends (2024)
- 5.5 Key Cross-Border Trade & Delivery Routes
- 5.5.1 Cross-Border Trade/Delivery Route 1
- 5.5.2 Cross-Border Trade/Delivery Route 2
- 5.5.3 Cross-Border Trade/Delivery Route 3
- 5.5.4 Cross-Border Trade/Delivery Route 4
- 5.5.5 Cross-Border Trade/Delivery Route 5
- 5.6 Trade Policy & Market Access Impact Assessment
- 5.6.1 Tariff & Non-Tariff Barriers
- 5.6.2 Regional Trade & Economic Integration Frameworks
- 5.6.3 Bilateral & Multilateral Trade Agreements
- 5.6.4 Cross-Border Operating, Licensing & Localization Requirements
Note: This chapter applies where cross-border trade or delivery is relevant to Riserless Light Well Intervention. Goods, services, and digital offerings are assessed using applicable classifications and transaction measures. Import-export volumes, trade balances, and route analyses are included only where meaningful to the market.
Chapter 6. Competitive Landscape & Company Benchmarking
- 6.1 Riserless Light Well Intervention Market Concentration & Structure
- 6.1.1 Herfindahl-Hirschman Index (HHI) – vs. 2024
- 6.1.2 Leading, Mid-Sized & Emerging Player Structure
- 6.1.3 Global, Regional & Local Player Dynamics
- 6.2 Riserless Light Well Intervention Market Share Analysis – 2024
- 6.2.1 Global Revenue Share by Company
- 6.2.2 Global Volume Share by Company (Volume Where Applicable)
- 6.2.3 Regional Revenue Share
- 6.2.4 Market Share Evolution ( vs. 2024)
- 6.2.5 Company Market Share by Key Segment
- 6.2.6 Company Market Share by Customer Group
- 6.3 Operating Scale, Capacity & Infrastructure Analysis
- 6.3.1 Global Operating Scale & Supply Capacity
- 6.3.2 Resource Utilization & Operating Efficiency
- 6.3.3 Output, Service Delivery & Activity Metrics
- 6.3.4 Operating Footprint & Infrastructure Map
- 6.3.5 Planned Operational & Capacity Expansion
- 6.4 Riserless Light Well Intervention Competitive Benchmarking Matrix
- 6.4.1 Revenue, Growth, Profitability & Operating Metric Comparison
- 6.4.2 Channel Revenue Mix
- 6.4.3 Geographic Revenue Exposure
- 6.4.4 R&D Intensity
- 6.4.5 Sustainability Maturity
- 6.5 Strategic Developments in Riserless Light Well Intervention (Last 24 Months)
- 6.5.1 Mergers, Acquisitions & Divestments
- 6.5.2 New Products, Services & Solutions in Riserless Light Well Intervention
- 6.5.3 Operational & Infrastructure Expansions
- 6.5.4 Strategic Alliances, Joint Ventures & Partnerships
- 6.5.5 Distribution Expansion & Market Entry
- 6.5.6 Sustainability & ESG Initiatives
- 6.6 Competitive Strategy Mapping
- 6.6.1 Leader, Challenger, Follower & Niche Classification
- 6.6.2 Pricing Strategy Comparison
- 6.6.3 Channel Strategy Matrix
Note: Strategic developments are included based on their materiality and the availability of reliable information.
Chapter 7. Global Riserless Light Well Intervention Market – By Sales & Delivery Channel
- 7.1 Segment Overview
- 7.1.1 Volume & Revenue Split by Channel (2024 & 2032) (Volume Where Applicable)
- 7.1.2 Channel Mix Evolution (2024-2032)
Chapter 8. Regional Market Analysis – Global Overview
- 8.1 Global Regional Overview
- 8.1.1 Regional Volume Share (Volume Where Applicable)
- 8.1.2 Regional Revenue Share
- 8.1.3 Regional Volume by Region (Volume Where Applicable)
- 8.1.4 Regional Revenue by Region
- 8.1.5 Regional Forecast Through 2032
- 8.2 Cross-Regional Segment Analysis
- 8.2.1 By Sales & Delivery Channel
- 8.2.2 By Competitive Positioning & Price Tier
Chapter 9. North America Riserless Light Well Intervention Market
- 9.1 United States
- 9.2 Canada
- 9.3 Mexico
Chapter 10. Europe Riserless Light Well Intervention Market
- 10.1 Germany
- 10.2 France
- 10.3 Italy
- 10.4 United Kingdom
- 10.5 Spain
- 10.6 Poland
- 10.7 Russia
- 10.8 Netherlands
- 10.9 Belgium
- 10.10 Sweden
- 10.11 Denmark
- 10.12 Norway
- 10.13 Rest of Europe
Chapter 11. Asia Pacific Riserless Light Well Intervention Market
- 11.1 China
- 11.2 India
- 11.3 Japan
- 11.4 South Korea
- 11.5 Thailand
- 11.6 Indonesia
- 11.7 Vietnam
- 11.8 Malaysia
- 11.9 Australia
- 11.10 Rest of Asia Pacific
Chapter 12. Latin America Riserless Light Well Intervention Market
- 12.1 Brazil
- 12.2 Argentina
- 12.3 Colombia
- 12.4 Chile
- 12.5 Rest of Latin America
Chapter 13. Middle East Riserless Light Well Intervention Market
- 13.1 Saudi Arabia
- 13.2 United Arab Emirates
- 13.3 Turkey
- 13.4 Israel
- 13.5 Iran
- 13.6 Rest of the Middle East
Chapter 14. Africa Riserless Light Well Intervention Market
- 14.1 South Africa
- 14.2 Egypt
- 14.3 Nigeria
- 14.4 Morocco
- 14.5 Rest of Africa
Chapter 15. Riserless Light Well Intervention Company Profiles
- 15.1 [Company 01]
- 15.1.1 Company Overview
- 15.1.2 Key Management Personnel
- 15.1.3 Products & Services Portfolio
- 15.1.4 Financial Performance
- 15.1.5 Key Market Focus & Geographic Presence
- 15.1.6 Recent Developments & Strategic Initiatives
Note: The company profile list is preliminary and may change based on research findings, market developments, data availability, and client requirements.
Chapter 16. Appendices
- Appendix A – List of Abbreviations & Acronyms
- Appendix B – Industry Classification Code Reference – Full Series
- Appendix C – Supply, Output & Operating Capacity Data Tables
- Appendix D – End-Use & Demand Base Tables
- Appendix E – Demand, Adoption & Usage Assumptions
- Appendix F – Pricing & Revenue Metric Reference Tables
- Appendix G – Company Operations & Infrastructure Database
- Appendix H – Cross-Border Trade & Activity Data Tables (Where Applicable)
- Appendix I – Regulatory Summary Tables
- Appendix J – Primary Research Participant List (Anonymized)
- Appendix K – Primary Research Questionnaire Framework
- Appendix L – Data Sources & Bibliography
- Appendix M – Market Size Divergence & Source Comparison
Chapter 17. Research Methodology
- 17.1 Research Framework & Philosophy
- 17.2 Secondary Research – Sources, Hierarchy & Data Extraction
- 17.3 Data Modeling – Bottom-Up & Top-Down Market Sizing
- 17.4 Primary Research – Stakeholder Framework, LOI & Sample Sizes
- 17.5 Forecast Methodology – Regression, Scenario & Sensitivity Analysis
- 17.6 Quality Control – Four-Layer Validation Framework
- 17.7 Limitations & Standard Assumptions
- 17.8 Disclaimer
