
Market Overview
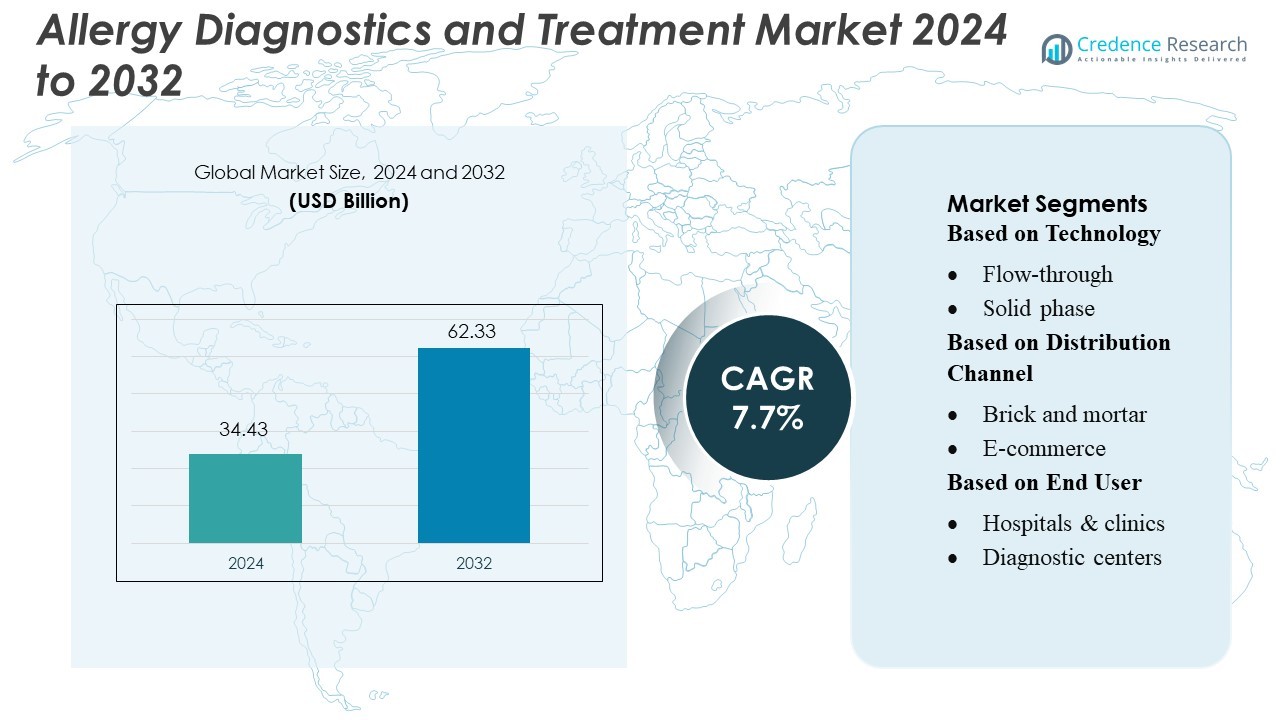
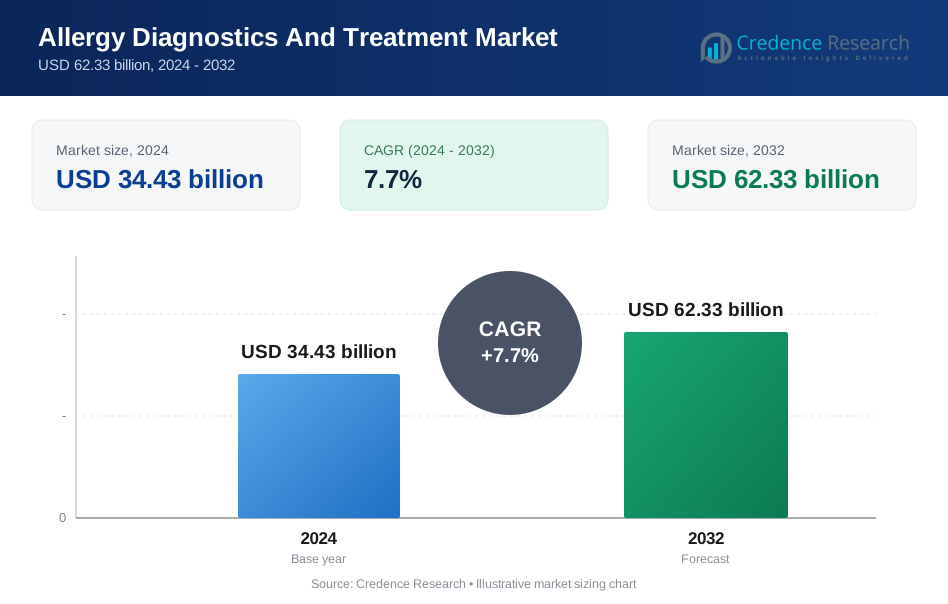
Allergy Diagnostics and Treatment Market size was valued USD 34.43 billion in 2024 and is anticipated to reach USD 62.33 billion by 2032, at a CAGR of 7.7% during the forecast period.
| REPORT ATTRIBUTE | DETAILS |
|---|---|
| Historical Period | 2020-2023 |
| Base Year | 2024 |
| Forecast Period | 2025-2032 |
| Allergy Diagnostics and Treatment Market Size 2024 | USD 34.43 Billion |
| Allergy Diagnostics and Treatment Market, CAGR | 7.7% |
| Allergy Diagnostics and Treatment Market Size 2032 | USD 62.33 Billion |
The Allergy Diagnostics and Treatment Market includes several leading companies that drive innovation through advanced immunoassays, molecular testing, and automated diagnostic platforms. These players strengthen clinical workflows by improving testing accuracy, expanding allergen panels, and supporting personalized treatment strategies across hospitals and laboratories. Strategic partnerships, product upgrades, and wider global distribution networks further enhance their competitive positions. North America remains the leading region, holding a 37% market share, supported by strong healthcare infrastructure, high awareness of allergy-related conditions, and rapid adoption of advanced diagnostic technologies. This regional strength continues to influence global market direction and innovation priorities.
Market Insights
- The market reached USD 34.43 billion in 2024 and will grow to USD 62.33 billion by 2032 at a 7.7% CAGR, driven by rising allergy prevalence and stronger diagnostic adoption.
- Growing demand for accurate immunoassays and molecular testing boosts market drivers, with hospitals increasing the use of automated analyzers and expanded allergen panels.
- Trends highlight rapid growth of digital allergy platforms, personalized immunotherapy, and at-home testing, supported by higher patient awareness and improved clinical workflows.
- Competitive activity strengthens as companies upgrade diagnostic systems, expand global distribution, and enhance product portfolios to address rising screening volumes.
- North America leads with a 37% share, while Asia Pacific shows fastest growth; diagnostic consumables hold the largest segment share as testing frequency rises across respiratory, food, and environmental allergies.
Market Segmentation Analysis:
By Technology
Flow-through methods lead this segment with a 32% market share. These systems offer quick processing and support higher sample volumes, which boosts adoption among high-traffic labs. Solid-phase platforms follow due to strong sensitivity for complex allergen panels. Lateral flow tests gain demand in point-of-care use, while agglutination assays remain relevant for basic screenings. Other platforms grow as firms introduce integrated analyzers that reduce manual steps. Flow-through technology stays dominant because its speed and high throughput help providers manage the rising number of allergy cases.
- For instance, Qiagen’s QIAstat-Dx system completes multiplex real-time PCR panels in about 1 hour with less than 1 minute hands-on time, boosting lab throughput. The company serves more than 500,000 customers worldwide, which underscores its broad reach and installation base.
By Distribution Channel
Brick-and-mortar channels hold a 58% share, driven by strong demand for in-person diagnostic services and direct access to trained staff. Hospitals and local clinics rely on these outlets to source validated kits and instruments that meet regulatory standards. E-commerce grows fast as buyers seek price transparency and easy access to consumables. Online platforms attract smaller labs and homecare users. Brick-and-mortar leads because many providers prioritize trusted supply chains and reliable cold-chain handling for sensitive allergy-testing materials.
- For instance, Quest Diagnostics processes a massive volume of tests annually through its extensive laboratory network. In 2024, the company operated more than 2,400 patient service centers across North America, underscoring its broad reach and operational scale in diagnostic healthcare.
By End User
Hospitals and clinics dominate with a 46% market share, due to their broad testing capacity and steady patient flow. These facilities conduct advanced IgE and component-resolved diagnostics, which require skilled teams and validated equipment. Diagnostic centers expand as they offer specialized allergy panels with faster turnaround. Homecare settings grow as consumers adopt self-testing kits for basic screening. Other end users contribute niche demand. Hospitals and clinics stay ahead because they manage complex allergy cases and support integrated treatment pathways.
Key Growth Drivers
Rising Allergy Prevalence Across All Age Groups
The market expands due to rising allergy cases linked to pollution, lifestyle changes, and urbanization. Healthcare providers adopt advanced diagnostic tools to detect respiratory, food, drug, and skin allergies faster. Patients now seek early evaluation to avoid severe complications, which boosts demand for screening kits and immunotherapy options. Hospitals and diagnostic centers invest in high-accuracy assays to support timely treatment. This rising disease burden strengthens market growth across developed and emerging regions.
- For instance, Bio-Rad expanded its QX Continuum™ and QX700™ series systems alongside existing lines, offers a comprehensive suite of digital PCR products, including over 400,000 assays, for life science research and diagnostic applications.
Advances in Diagnostic Technologies
New tools improve testing accuracy and reduce turnaround time. Automated immunoassay systems, molecular allergen panels, and component-resolved diagnostics help specialists identify precise triggers. These tools support personalized treatment plans and reduce repeated hospital visits. Technology adoption increases efficiency in labs and supports large-scale testing programs. These improvements encourage healthcare facilities to upgrade diagnostic workflows and increase investments.
- For instance, Agilent announced its new 1290 Infinity III Hybrid Multisampler at HPLC 2025, which supports sub-2 µm columns and operates at up to 1300 bar pressure to enable ultra-high performance liquid chromatography.
Growing Preference for Immunotherapy Treatments
Patients prefer long-term relief offered by subcutaneous and sublingual immunotherapy. These therapies reduce dependency on antihistamines and corticosteroids by addressing the root cause of allergic reactions. Healthcare providers recommend immunotherapy for chronic respiratory allergies, boosting demand for advanced formulations. Drug makers expand product lines to meet rising treatment needs. This shift toward durable solutions supports steady growth in the treatment segment.
Key Trends & Opportunities
Expansion of At-Home Allergy Testing Solutions
At-home test kits gain momentum as consumers seek convenience and quicker results. Digital platforms now guide users through sample collection and connect them with clinicians for result interpretation. These solutions support early detection and reduce pressure on physical diagnostic centers. Companies develop user-friendly kits to capture growing demand. This trend creates strong opportunities for e-commerce-driven distribution.
- For instance, Siemens Healthineers expanded its 3gAllergy™ assay menu by adding nine new component allergens, including six specific to peanut components and others derived from dust-mites and wheat, bringing the total allergen count to over 500 analytes on its IMMULITE 2000 XPi system.
Increased Adoption of AI-Driven Allergy Screening
AI tools help analyze patient history, symptom patterns, and environmental factors to improve diagnosis accuracy. Healthcare systems deploy machine learning models to personalize treatment plans and predict flare-ups. These tools support faster decision-making and reduce diagnostic errors. Technology vendors collaborate with clinics to embed AI in workflow systems. This growing adoption opens new revenue opportunities in digital diagnostics.
- For instance, QuidelOrtho reports having the company offers approximately 550 different assays in its global testing portfolio across various platforms like Sofia, Savanna, QuickVue, and VITROS systems. It serves approximately 75,000 customers in 143 countries worldwide.
Growing Demand for Pediatric Allergy Care
Children represent a significant share of allergy cases, driving demand for safe and accurate diagnostics. Pediatric clinics adopt minimally invasive tests and tailored immunotherapy options. Parents seek early testing to avoid long-term complications, increasing market uptake. Companies design child-specific panels to support precise evaluation. This segment offers strong growth potential for manufacturers and service providers.
Key Challenges
High Cost of Advanced Diagnostic and Treatment Options
Advanced allergy tests and immunotherapy involve significant expenses for many patients. Limited reimbursement in several countries raises financial barriers for routine screening. Smaller clinics struggle to adopt automated systems due to high setup costs. Long treatment timelines also increase overall healthcare spending. These cost pressures slow adoption in low-income areas and restrict patient access. Market players need cost-effective models to widen penetration and support broader usage.
Limited Awareness and Underdiagnosis in Emerging Regions
Many populations lack proper awareness of early allergy symptoms and long-term risks. Mild reactions often go untreated, leading to underdiagnosis across rural and semi-urban settings. Low availability of trained allergists restricts proper evaluation and follow-up care. Cultural beliefs may also delay clinical consultations. These gaps reduce testing demand and weaken treatment adoption rates. Educating families and strengthening specialist networks remain essential to support market growth.
Regional Analysis
North America
North America leads the Allergy Diagnostics and Treatment Market with a 37% share due to strong healthcare infrastructure and widespread adoption of advanced testing methods. High awareness levels support early diagnosis across respiratory, food, and skin allergies. Specialty clinics and hospitals deploy automated analyzers and multiplex systems to improve accuracy. Immunotherapy adoption continues to rise as patients seek long-term relief. Strong R&D investments from diagnostic companies and pharmaceutical manufacturers strengthen innovation. Favorable reimbursement policies and access to skilled allergists further reinforce North America’s dominant position within the global landscape.
Europe
Europe holds a 29% market share driven by structured allergy management programs and widespread screening practices. Countries such as Germany, the UK, and France invest in molecular allergy diagnostics and personalized immunotherapy. Healthcare systems emphasize standardized testing and evidence-based treatment protocols. Rising awareness of environmental and food allergies boosts demand for early and precise evaluations. Research institutes collaborate with industry players to develop advanced allergen panels. Regulatory support for high-quality diagnostic tools enhances market growth. The region’s strong clinical network and adoption of precision medicine sustain steady expansion across treatment and diagnostic segments.
Asia Pacific
Asia Pacific accounts for a 22% market share and represents the fastest-growing region due to rising urban pollution, increasing asthma cases, and expanding healthcare access. Countries like China, India, and Japan invest heavily in advanced diagnostic equipment and training programs. Growing middle-class populations seek accurate testing for food, dust, and pollen allergies. Hospitals integrate automated systems to handle expanding patient volumes. Immunotherapy adoption rises as awareness improves across metropolitan areas. Government initiatives focused on respiratory and pediatric health further support demand. The region’s large population base and improving diagnostic infrastructure fuel strong long-term market potential.
Latin America
Latin America holds a 7% market share, supported by rising awareness of respiratory and environmental allergies across urban centers. Brazil, Mexico, and Argentina lead adoption as healthcare systems expand diagnostic capabilities. Private clinics invest in modern testing platforms to address growing patient demand. Limited allergist availability in rural regions slows widespread uptake, yet investment in digital health and tele-allergy consultations improves access. Local campaigns highlight early diagnosis to prevent severe reactions. With urbanization increasing exposure to pollutants, the region shows gradual improvement in diagnostic and treatment adoption, contributing to steady market expansion.
Middle East & Africa
The Middle East & Africa region accounts for a 5% market share, driven by growing recognition of allergy-related conditions and expanding access to specialty care. Urban environments in Gulf countries report rising cases of asthma and rhinitis, prompting investment in diagnostic centers. Adoption of advanced testing remains limited in many African nations due to resource constraints, yet private hospitals support gradual improvement. Medical tourism in the UAE and Saudi Arabia boosts demand for modern diagnostic solutions. Efforts to strengthen clinical training and awareness programs continue to shape future growth opportunities across the region.
Market Segmentations:
By Technology
- Flow-through
- Solid phase
By Distribution Channel
- Brick and mortar
- E-commerce
By End User
- Hospitals & clinics
- Diagnostic centers
By Geography
- North America
- U.S.
- Canada
- Mexico
- Europe
- Germany
- France
- U.K.
- Italy
- Spain
- Rest of Europe
- Asia Pacific
- China
- Japan
- India
- South Korea
- South-east Asia
- Rest of Asia Pacific
- Latin America
- Brazil
- Argentina
- Rest of Latin America
- Middle East & Africa
- GCC Countries
- South Africa
- Rest of the Middle East and Africa
Competitive Landscape
The Allergy Diagnostics and Treatment Market features a competitive landscape shaped by major participants such as Qiagen, Quest Diagnostics Incorporated, Charles River Laboratories, Bio-Rad Laboratories, Inc., Agilent Technologies, Inc., Siemens Healthineers AG, QuidelOrtho Corporation, bioMérieux SA, Abbott, and Sysmex Corporation. The Allergy Diagnostics and Treatment Market reflects strong innovation, expanding clinical adoption, and ongoing advancements in testing accuracy. Companies focus on improving diagnostic efficiency by integrating automated analyzers, multiplex assays, and molecular testing platforms that support high-volume screening and faster result delivery. Healthcare providers increasingly adopt digital reporting tools and data-driven allergy profiling to enhance patient management. Manufacturers invest in next-generation immunoassays, improved reagent quality, and precision allergen panels to support personalized treatment planning. Strategic collaborations with hospitals and research networks accelerate product validation and strengthen market presence. Continuous emphasis on early diagnosis, rising demand for immunotherapy, and growing awareness of respiratory and food allergies further intensify competition. This environment encourages consistent development of reliable clinical solutions, stronger regulatory compliance, and expansion of global distribution capabilities.
Key Player Analysis
- Qiagen
- Quest Diagnostics Incorporated
- Charles River Laboratories
- Bio-Rad Laboratories, Inc.
- Agilent Technologies, Inc.
- Siemens Healthineers AG
- QuidelOrtho Corporation
- bioMérieux SA
- Abbott
- Sysmex Corporation
Recent Developments
- In August 2025, Sanofi launched Allegra-D, a non-drowsy allergy relief from nasal decongestion in India. Allegra-D tablets include a fixed-dose combination (FDC) of Fexofe nadine Hydrochloride IP (60 mg), a non-drowsy antihistamine, and Pseudoephedrine Hydrochloride IP (120 mg), a powerful nasal decongestant.
- In July 2025, PHASE Scientific announced that it had entered into an exclusive U.S. distribution agreement with Lumos Diagnostics for FebriDx, a rapid point-of-care test that diagnosed bacterial acute respiratory infections and differentiated them from non-bacterial causes in about 10 minutes using a single drop of blood.
- In May 2025, SEKISUI Diagnostics launched a rapid diagnostic tool, the OSOM RSV Test, for detecting RSV in healthcare settings. The test provided results from anterior nasal swabs in just 15 minutes. This launch is expected to boost the market by improving early detection, expanding point-of-care options, and enhancing the company’s infectious disease portfolio.
- In November 2024, QIAGEN announced that it had received FDA clearance for the QIAstat-Dx Meningitis/Encephalitis panel for syndromic diagnosis of meningitis in the U.S. Additionally, new mini panels were also expected to be submitted for U.S. approval in 2024.
Report Coverage
The research report offers an in-depth analysis based on Technology, Distribution Channel, End-User and Geography. It details leading market players, providing an overview of their business, product offerings, investments, revenue streams, and key applications. Additionally, the report includes insights into the competitive environment, SWOT analysis, current market trends, as well as the primary drivers and constraints. Furthermore, it discusses various factors that have driven market expansion in recent years. The report also explores market dynamics, regulatory scenarios, and technological advancements that are shaping the industry. It assesses the impact of external factors and global economic changes on market growth. Lastly, it provides strategic recommendations for new entrants and established companies to navigate the complexities of the market.
Future Outlook
- The market will adopt more molecular diagnostic tools that improve allergen specificity and reduce interpretation errors.
- Digital allergy platforms will expand as patients prefer remote monitoring and quick access to personalized reports.
- Immunotherapy usage will increase as clinicians seek long-term symptom control and better treatment adherence.
- Automated analyzers will gain wider adoption as labs prioritize faster workflows and higher testing accuracy.
- Pediatric allergy screening will grow due to rising food allergy awareness among parents and healthcare providers.
- AI-based tools will support allergen pattern analysis and improve predictive decision-making for clinicians.
- At-home testing kits will expand as consumers seek convenient and early evaluation options.
- Hospitals will integrate comprehensive allergen panels to support personalized treatment strategies.
- Collaboration between diagnostic companies and research institutions will accelerate development of advanced assays.
- Emerging regions will show stronger market uptake as healthcare access and specialist availability improve.
Request a Free Sample
Fill in your details and we'll send you a free sample report.
- Sample data tables & charts
- Research methodology
Need a Custom Version of This Report?
Tailor the scope, geography, or segments to your exact requirements.
- Custom geography or segment scope
- Direct access to our analyst team
Frequently Asked Questions
What is the current market size for the Allergy Diagnostics and Treatment Market, and what is its projected size in 2032?
At what Compound Annual Growth Rate is the Allergy Diagnostics and Treatment Market projected to grow between 2025 and 2032?
Which Allergy Diagnostics and Treatment Market segment held the largest share in 2024?
What are the primary factors fueling the growth of the Allergy Diagnostics and Treatment Market?
Who are the leading companies in the Allergy Diagnostics and Treatment Market?
Which region commanded the largest share of the Allergy Diagnostics and Treatment Market in 2024?
Table of Content
Chapter 1. Report Introduction
- 1.1 Report Description & Purpose
- 1.1.1 Report Title & Market Definition
- 1.1.2 Unique Selling Propositions (USP) & Key Differentiators
- 1.1.3 Value Proposition for Stakeholders
- 1.2 Research Objectives
- 1.2.1 Market Sizing Objectives (Volume & Revenue) (Volume Where Applicable)
- 1.2.2 Segmentation Objectives
- 1.2.3 Competitive Intelligence Objectives
- 1.2.4 Forecast & Scenario Objectives
- 1.3 Report Scope
- 1.3.1 Allergy Diagnostics And Treatment Scope – Segments & Subsegments Covered
- 1.3.2 Geographic Scope – Regions & Countries Covered
- 1.3.3 Historical Period, Base Year & Forecast Period (2024; forecast to 2032)
- 1.3.4 Inclusions & Exclusions
- 1.4 Industry Classification & Applicable Codes
- 1.5 Currency, Measurement Units & Valuation Basis
- 1.6 Target Stakeholders
- 1.7 Limitations & Assumptions
Chapter 2. Executive Summary
- 2.1 Global Allergy Diagnostics And Treatment Market Snapshot
- 2.1.1 Market Size – Historical (2024) & Forecast (2024-2032) (2024: USD 34.43 billion → 2032: USD 62.33 billion)
- 2.1.2 Volume & Revenue – Global Totals (Volume Where Applicable)
- 2.1.3 Key Market Highlights – Top Five Facts
- 2.2 Allergy Diagnostics And Treatment Market Segmentation Snapshot
- 2.2.1 Market Split by Region – 2024 vs. 2032
- 2.3 Competitive Snapshot
- 2.3.1 Top 10 Players by Revenue Share – 2024
- 2.3.2 Top 10 Players by Volume Share – 2024 (Volume Where Applicable)
- 2.3.3 Recent Strategic Developments (18-Month Summary)
- 2.4 Key Investment Highlights & Strategic Conclusions
Chapter 3. Allergy Diagnostics And Treatment Market Dynamics & Industry Analysis
- 3.1 Market Overview & Context
- 3.1.1 Allergy Diagnostics And Treatment Market Position in the Broader Industry Value Chain
- 3.1.2 Demand Structure & Purchasing Dynamics
- 3.1.3 Market Maturity & Development Stage by Region
- 3.2 Allergy Diagnostics And Treatment Market Drivers
- 3.3 Allergy Diagnostics And Treatment Market Restraints & Challenges
- 3.4 Allergy Diagnostics And Treatment Market Opportunities
- 3.5 Porter's Five Forces Analysis
- 3.5.1 Threat of New Entrants
- 3.5.2 Bargaining Power of Suppliers
- 3.5.3 Bargaining Power of Buyers
- 3.5.4 Threat of Substitutes
- 3.5.5 Competitive Rivalry – Intensity Assessment
- 3.6 Allergy Diagnostics And Treatment Value Chain Analysis
- 3.6.1 Upstream – Key Inputs, Resources & Suppliers
- 3.6.1.1 Key Input/Resource 1
- 3.6.1.2 Key Input/Resource 2
- 3.6.1.3 Key Input/Resource 3
- 3.6.2 Midstream – Core Operations & Value Creation
- 3.6.2.1 Operating Model & Process Overview
- 3.6.2.2 Key Operating Locations & Capabilities by Company
- 3.6.3 Downstream – Market Channels & End Users
- 3.6.3.1 Direct Sales & Customer Engagement Channels
- 3.6.3.2 Indirect Sales, Intermediaries & Partner Channels
- 3.6.4 Value Chain Profitability Analysis
- 3.6.1 Upstream – Key Inputs, Resources & Suppliers
- 3.7 PESTEL Analysis
- 3.7.1 Political Factors
- 3.7.2 Economic Factors
- 3.7.3 Social Factors
- 3.7.4 Technological Factors
- 3.7.5 Environmental Factors
- 3.7.6 Legal Factors
- 3.8 Allergy Diagnostics And Treatment Supply Chain Analysis
- 3.8.1 Critical Input & Resource Availability Risk Assessment
- 3.8.2 Supplier & Operational Concentration Risk (Geographic Exposure)
- 3.8.3 Supply & Service Disruption Impact Analysis
- 3.9 Regulatory & Policy Landscape
Note: The regulatory and policy landscape section covers regulations based on their applicability to the market, Allergy Diagnostics And Treatment category, geography, and scope of the study. Only regulatory frameworks with a material impact on operations, compliance, trade, sustainability, or market access are analyzed in detail.
Chapter 4. Key Investment Pockets & Opportunity Analysis
- 4.1 Allergy Diagnostics And Treatment Market Attractiveness Analysis
- 4.1.1 By Region – Investment Attractiveness Matrix (Market Size × CAGR)
- 4.2 Absolute Revenue Growth Opportunity
- 4.2.1 By Region – Absolute Revenue Growth Through 2032
- 4.3 Incremental Demand Opportunity
- 4.3.1 By Region – Incremental Demand Through 2032
- 4.3.2 Segment – Incremental Demand
- 4.4 Emerging Submarket Opportunity Deep Dive (Subject to Applicability)
- 4.5 Priority Market Opportunity Scorecards
- 4.5.1 United States
- 4.5.2 Europe
- 4.5.3 Asia
- 4.5.4 Middle East & Africa
Note: Priority market opportunity scorecards reflect the geographic scope and strategic relevance of the study. Listed markets are indicative and may be adapted to the industry.
Chapter 5. Allergy Diagnostics And Treatment Cross-Border Trade & Market Access Analysis
- 5.1 International Trade & Cross-Border Activity Overview
- 5.1.1 Global Export Value by Country (2024)
- 5.1.2 Global Export Volume by Country (2024) (Volume Where Applicable)
- 5.1.3 Global Import Value by Country (2024)
- 5.1.4 Global Import Volume by Country (2024) (Volume Where Applicable)
- 5.1.5 Net Trade Balance by Country (2024)
- 5.2 Export Analysis – Segment
- 5.2.1 Category 1 (Applicable Classification Code)
- 5.2.2 Category 2 (Applicable Classification Code)
- 5.2.3 Category 3 (Applicable Classification Code)
- 5.2.4 Category 4 (Applicable Classification Code)
- 5.2.5 Category 5 (Applicable Classification Code)
- 5.3 Import Analysis – Segment
- 5.3.1 Category 1 (Applicable Classification Code)
- 5.3.2 Category 2 (Applicable Classification Code)
- 5.3.3 Category 3 (Applicable Classification Code)
- 5.3.4 Category 4 (Applicable Classification Code)
- 5.3.5 Category 5 (Applicable Classification Code)
- 5.4 Cross-Border Pricing & Transaction Benchmarks
- 5.4.1 Export Pricing – Segment & Country
- 5.4.2 Import Pricing – Segment & Source Country
- 5.4.3 Price Trends (2024)
- 5.5 Key Cross-Border Trade & Delivery Routes
- 5.5.1 Cross-Border Trade/Delivery Route 1
- 5.5.2 Cross-Border Trade/Delivery Route 2
- 5.5.3 Cross-Border Trade/Delivery Route 3
- 5.5.4 Cross-Border Trade/Delivery Route 4
- 5.5.5 Cross-Border Trade/Delivery Route 5
- 5.6 Trade Policy & Market Access Impact Assessment
- 5.6.1 Tariff & Non-Tariff Barriers
- 5.6.2 Regional Trade & Economic Integration Frameworks
- 5.6.3 Bilateral & Multilateral Trade Agreements
- 5.6.4 Cross-Border Operating, Licensing & Localization Requirements
Note: This chapter applies where cross-border trade or delivery is relevant to Allergy Diagnostics And Treatment. Goods, services, and digital offerings are assessed using applicable classifications and transaction measures. Import-export volumes, trade balances, and route analyses are included only where meaningful to the market.
Chapter 6. Competitive Landscape & Company Benchmarking
- 6.1 Allergy Diagnostics And Treatment Market Concentration & Structure
- 6.1.1 Herfindahl-Hirschman Index (HHI) – vs. 2024
- 6.1.2 Leading, Mid-Sized & Emerging Player Structure
- 6.1.3 Global, Regional & Local Player Dynamics
- 6.2 Allergy Diagnostics And Treatment Market Share Analysis – 2024
- 6.2.1 Global Revenue Share by Company
- 6.2.2 Global Volume Share by Company (Volume Where Applicable)
- 6.2.3 Regional Revenue Share
- 6.2.4 Market Share Evolution ( vs. 2024)
- 6.2.5 Company Market Share by Key Segment
- 6.2.6 Company Market Share by Customer Group
- 6.3 Operating Scale, Capacity & Infrastructure Analysis
- 6.3.1 Global Operating Scale & Supply Capacity
- 6.3.2 Resource Utilization & Operating Efficiency
- 6.3.3 Output, Service Delivery & Activity Metrics
- 6.3.4 Operating Footprint & Infrastructure Map
- 6.3.5 Planned Operational & Capacity Expansion
- 6.4 Allergy Diagnostics And Treatment Competitive Benchmarking Matrix
- 6.4.1 Revenue, Growth, Profitability & Operating Metric Comparison
- 6.4.2 Channel Revenue Mix
- 6.4.3 Geographic Revenue Exposure
- 6.4.4 R&D Intensity
- 6.4.5 Sustainability Maturity
- 6.5 Strategic Developments in Allergy Diagnostics And Treatment (Last 24 Months)
- 6.5.1 Mergers, Acquisitions & Divestments
- 6.5.2 New Products, Services & Solutions in Allergy Diagnostics And Treatment
- 6.5.3 Operational & Infrastructure Expansions
- 6.5.4 Strategic Alliances, Joint Ventures & Partnerships
- 6.5.5 Distribution Expansion & Market Entry
- 6.5.6 Sustainability & ESG Initiatives
- 6.6 Competitive Strategy Mapping
- 6.6.1 Leader, Challenger, Follower & Niche Classification
- 6.6.2 Pricing Strategy Comparison
- 6.6.3 Channel Strategy Matrix
Note: Strategic developments are included based on their materiality and the availability of reliable information.
Chapter 7. Global Allergy Diagnostics And Treatment Market – By Sales & Delivery Channel
- 7.1 Segment Overview
- 7.1.1 Volume & Revenue Split by Channel (2024 & 2032) (Volume Where Applicable)
- 7.1.2 Channel Mix Evolution (2024-2032)
Chapter 8. Regional Market Analysis – Global Overview
- 8.1 Global Regional Overview
- 8.1.1 Regional Volume Share (Volume Where Applicable)
- 8.1.2 Regional Revenue Share
- 8.1.3 Regional Volume by Region (Volume Where Applicable)
- 8.1.4 Regional Revenue by Region
- 8.1.5 Regional Forecast Through 2032
- 8.2 Cross-Regional Segment Analysis
- 8.2.1 By Sales & Delivery Channel
- 8.2.2 By Competitive Positioning & Price Tier
Chapter 9. North America Allergy Diagnostics And Treatment Market
- 9.1 United States
- 9.2 Canada
- 9.3 Mexico
Chapter 10. Europe Allergy Diagnostics And Treatment Market
- 10.1 Germany
- 10.2 France
- 10.3 Italy
- 10.4 United Kingdom
- 10.5 Spain
- 10.6 Poland
- 10.7 Russia
- 10.8 Netherlands
- 10.9 Belgium
- 10.10 Sweden
- 10.11 Denmark
- 10.12 Norway
- 10.13 Rest of Europe
Chapter 11. Asia Pacific Allergy Diagnostics And Treatment Market
- 11.1 China
- 11.2 India
- 11.3 Japan
- 11.4 South Korea
- 11.5 Thailand
- 11.6 Indonesia
- 11.7 Vietnam
- 11.8 Malaysia
- 11.9 Australia
- 11.10 Rest of Asia Pacific
Chapter 12. Latin America Allergy Diagnostics And Treatment Market
- 12.1 Brazil
- 12.2 Argentina
- 12.3 Colombia
- 12.4 Chile
- 12.5 Rest of Latin America
Chapter 13. Middle East Allergy Diagnostics And Treatment Market
- 13.1 Saudi Arabia
- 13.2 United Arab Emirates
- 13.3 Turkey
- 13.4 Israel
- 13.5 Iran
- 13.6 Rest of the Middle East
Chapter 14. Africa Allergy Diagnostics And Treatment Market
- 14.1 South Africa
- 14.2 Egypt
- 14.3 Nigeria
- 14.4 Morocco
- 14.5 Rest of Africa
Chapter 15. Allergy Diagnostics And Treatment Company Profiles
- 15.1 [Company 01]
- 15.1.1 Company Overview
- 15.1.2 Key Management Personnel
- 15.1.3 Products & Services Portfolio
- 15.1.4 Financial Performance
- 15.1.5 Key Market Focus & Geographic Presence
- 15.1.6 Recent Developments & Strategic Initiatives
Note: The company profile list is preliminary and may change based on research findings, market developments, data availability, and client requirements.
Chapter 16. Appendices
- Appendix A – List of Abbreviations & Acronyms
- Appendix B – Industry Classification Code Reference – Full Series
- Appendix C – Supply, Output & Operating Capacity Data Tables
- Appendix D – End-Use & Demand Base Tables
- Appendix E – Demand, Adoption & Usage Assumptions
- Appendix F – Pricing & Revenue Metric Reference Tables
- Appendix G – Company Operations & Infrastructure Database
- Appendix H – Cross-Border Trade & Activity Data Tables (Where Applicable)
- Appendix I – Regulatory Summary Tables
- Appendix J – Primary Research Participant List (Anonymized)
- Appendix K – Primary Research Questionnaire Framework
- Appendix L – Data Sources & Bibliography
- Appendix M – Market Size Divergence & Source Comparison
Chapter 17. Research Methodology
- 17.1 Research Framework & Philosophy
- 17.2 Secondary Research – Sources, Hierarchy & Data Extraction
- 17.3 Data Modeling – Bottom-Up & Top-Down Market Sizing
- 17.4 Primary Research – Stakeholder Framework, LOI & Sample Sizes
- 17.5 Forecast Methodology – Regression, Scenario & Sensitivity Analysis
- 17.6 Quality Control – Four-Layer Validation Framework
- 17.7 Limitations & Standard Assumptions
- 17.8 Disclaimer
