
Audiology Devices Market Overview:
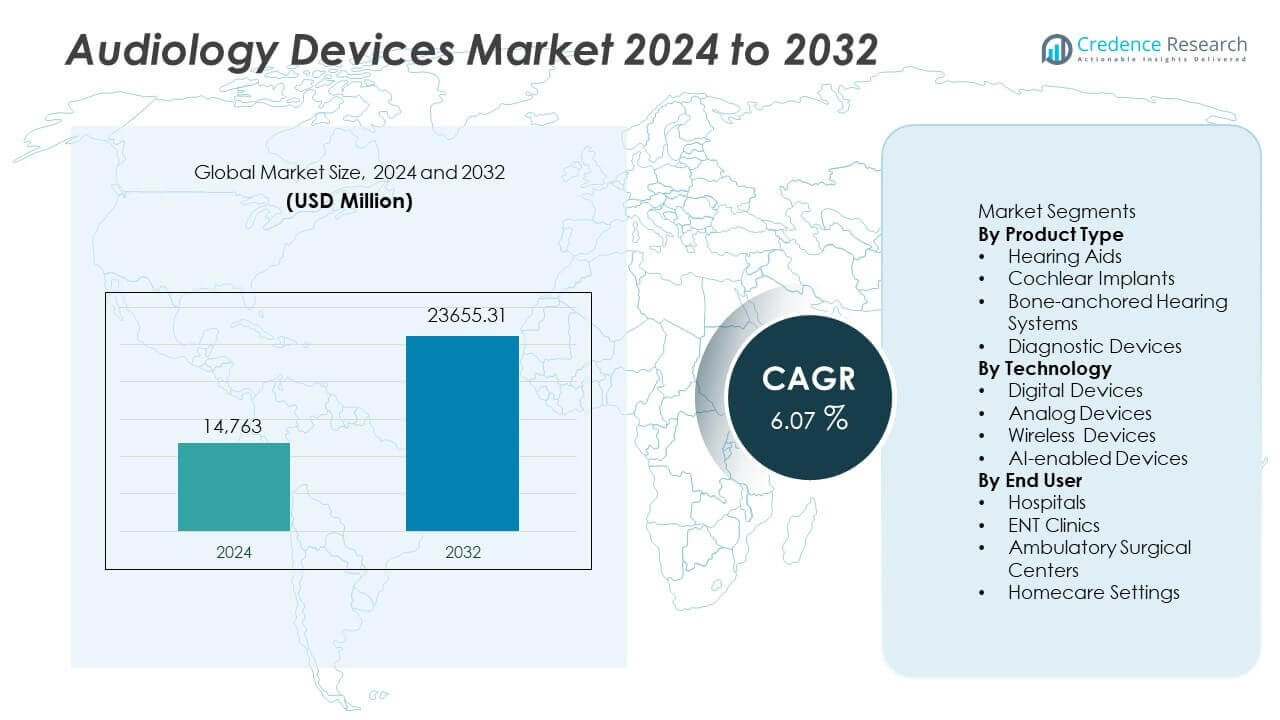
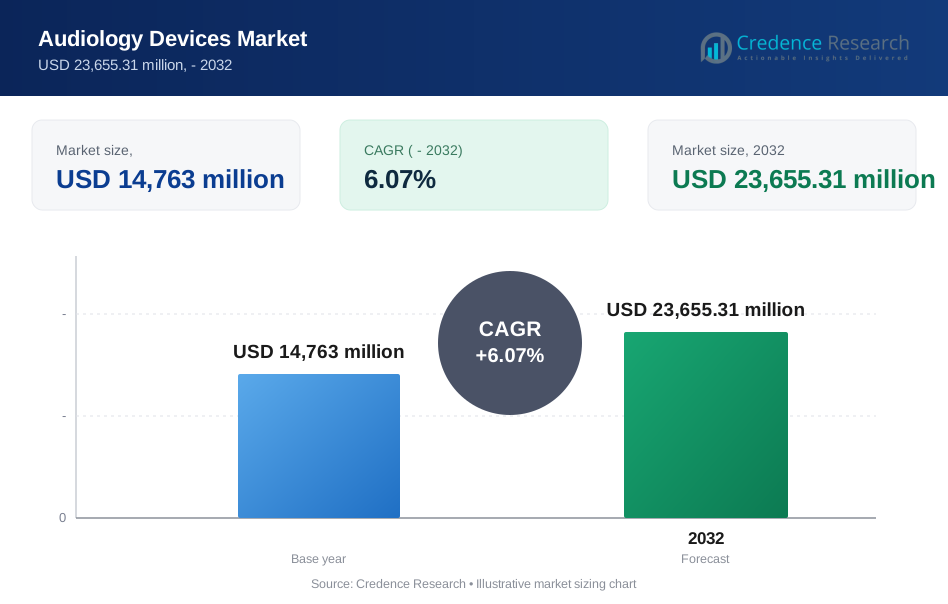
The Audiology Devices market size reached USD 14,763 million in 2024. It is expected to reach USD 23,655.31 million by 2032, at a CAGR of 6.07% during the forecast period.
| REPORT ATTRIBUTE | DETAILS |
|---|---|
| Historical Period | 2020-2023 |
| Base Year | 2024 |
| Forecast Period | 2025-2032 |
| Audiology Devices Market Size 2024 | USD 14,763 million |
| Audiology Devices Market, CAGR | 6.07% |
| Audiology Devices Market Size 2032 | USD 23,655.31 million |
Audiology Devices Market Insights
- Rising hearing loss rates and aging populations drive strong device adoption in hospitals and ENT clinics, with hearing aids holding 60% share by product type.
- AI-enabled and wireless hearing devices lead key market trends as users seek improved clarity, comfort, and connectivity, while companies expand portfolios with smart and digital features.
- Competitive intensity increases as manufacturers invest in remote care platforms, digital upgrades, and enhanced battery life, though high cost and limited reimbursement remain major restraints.
- North America leads with 38% share, followed by Europe at 32%, while Asia Pacific at 22% shows the fastest expansion due to growing awareness, rising incomes, and wider access to audiology care.
Audiology Devices Market Segmentation Analysis:
By Product Type
Hearing aids lead the product type segment with near 60% share, driven by high usage among aging adults and strong innovation in comfort and clarity. Cochlear implants and bone-anchored hearing systems support advanced hearing restoration for severe cases, while diagnostic devices enable early detection. Rising cases of hearing impairment and wider access to hearing care strengthen this demand. Improving reimbursement policies and continuous design upgrades in hearing aids reinforce dominant adoption and solid market leadership in this segment.
- For instance, Sonova’s Paradise platform processed up to 2,400 million data points each second to enhance speech understanding, which supported stronger user outcomes.
By Technology
Digital devices hold roughly 55% share within the technology segment, supported by superior sound quality, reliability, and easy customization. Wireless devices grow with strong demand for connectivity, while AI-enabled systems gain traction in adaptive sound control and noise filtering. Analog devices remain limited in use due to performance gaps. Strong preference for digital platforms and smart features drives this segment, with rising consumer interest in mobile-linked solutions supporting the continued dominance of digital devices.
- For instance, GN Store Nord’s ReSound One platform used multiple digital processing channels to boost clarity and reduce distortion.
By End User
Hospitals account for about 45% share of the end user segment due to broad access to patient care and integrated diagnostic testing. ENT clinics follow, benefiting from specialist-led treatment pathways, while ambulatory surgical centers grow through efficient outpatient services. Homecare settings expand with remote care and teleaudiology. Hospital leadership remains supported by established infrastructure, trained workforce, and patient confidence in comprehensive hearing care, reinforcing their position as the primary channel for audiology device adoption.
Key Growth Drivers
Rising Prevalence of Hearing Loss
Hearing loss cases continue to increase worldwide due to aging populations, lifestyle factors, and greater exposure to noise. This rise boosts screening and treatment adoption across all age groups and drives higher device usage. Healthcare providers expand audiology programs, while early diagnosis improves patient outcomes. Strong awareness campaigns and better access to treatment options encourage individuals to seek care sooner. Continuous improvement in device performance, comfort, and design supports user confidence and market growth.
- For instance, WHO reported over 430 million people living with disabling hearing loss in 2021, and this figure is expected to exceed 700 million by 2050 based on verified clinical projections.
Advances in Device Technology
Technology enhancements improve user experience and boost device acceptance. New digital, wireless, and AI-enabled systems offer better sound clarity, noise reduction, and connectivity with smartphones and wearables. These improvements support more accurate sound processing and longer daily use. Enhanced battery life, smaller device size, and faster fitting processes help reduce discomfort and improve daily convenience. Integrated software platforms also increase remote monitoring and digital care efficiency, strengthening long-term product value.
- For instance, Starkey’s Genesis AI chipset processed up to 80 million adjustments per hour, enabling real-time noise control across varied environments.
Growing Elderly Population
The global rise in older adults drives stronger demand for audiology services. Seniors face higher rates of hearing impairment tied to age and chronic health conditions. Governments and healthcare systems invest in age-related care programs to address long-term needs. This demographic shift raises screening volumes, diagnostic evaluations, and device fitting rates. Manufacturers respond by developing user-friendly solutions that support comfort, daily function, and reliable hearing restoration. The expanding senior base remains a core demand driver for the market.
Key Trends & Opportunities
Integration of AI and Smart Features
AI-based sound processing reshapes user experience by enabling automatic adjustments and clearer audio. Smart connectivity links devices to mobile apps for real-time tuning, remote support, and usage tracking. These features improve accuracy in noisy environments and deliver stronger personalization benefits. Digital platforms also simplify care delivery for providers and enhance long-term device value. Growing demand for intelligent systems supports new product launches and strengthens competitive differentiation.
- For instance, WS Audiology’s Signia Assistant processed over 20 million user interactions to refine fitting accuracy and personalize settings at scale.
Expansion of Teleaudiology Services
Remote care platforms make device consultation and fitting more accessible, especially in underserved regions. Teleaudiology reduces travel time, lowers follow-up gaps, and supports faster adjustments. Users access virtual guidance and troubleshooting, leading to higher satisfaction and greater device loyalty. Healthcare networks adopt digital workflows to improve efficiency and reach broader patient groups. This trend creates strong opportunity for hybrid care models and elevates market penetration in locations with limited audiology specialists.
- For instance, Cochlear Limited’s Remote Check tool screened user condition changes in under 5 minutes, supporting safer home-based follow-ups.
Key Challenges
High Device Cost and Limited Reimbursement
Many users face cost barriers due to limited insurance coverage and high out-of-pocket payments. This issue restricts adoption, especially in low-income regions and among older adults with fixed budgets. Limited reimbursement for advanced products further slows upgrade cycles and prevents wider access. Healthcare policies continue to evolve, but commercial support remains uneven across markets. Manufacturers work to lower costs and expand financial options, yet affordability challenges persist.
Device Stigma and Compliance Issues
Some users hesitate to adopt hearing aids due to stigma, comfort concerns, or cosmetic preferences. Early abandonment remains a concern when devices feel intrusive or produce unsatisfactory results. Low follow-up rates and limited user training can also affect daily usage. Education programs and design improvements help address these challenges, but compliance issues continue to impact long-term outcomes. Growing awareness and better device personalization aim to reduce these adoption barriers over time.
Regional Analysis
North America
North America leads the audiology devices market with 38% share. Strong access to advanced care supports early diagnosis and device adoption. Healthcare systems expand hearing screening programs across hospitals and ENT clinics. Rising awareness drives higher use of digital and wireless solutions. Regulatory support and insurance coverage improve affordability and increase upgrade cycles. Large elderly groups and strong device replacement rates reinforce market strength. Major companies invest in product launches, training, and teleaudiology expansion. Research and educational programs encourage stronger patient engagement. These factors sustain regional dominance and long-term revenue stability.
Europe
Europe holds 32% share in the audiology devices market. Widespread diagnostic access and high clinical standards support strong adoption. Aging demographics, hearing health education, and preventive screening programs further drive volume. Demand for AI-enabled systems rises as patients seek better clarity and comfort. Reimbursement policies support treatment coverage and promote steady device replacement. Manufacturers increase investment in wireless connectivity and app integration. ENT specialists and hospitals lead fitting volumes across key markets. Growing focus on early intervention improves patient outcomes and strengthens regional growth. Europe remains a core hub for device innovation and clinical advancement.
Asia Pacific
Asia Pacific accounts for 22% share and represents the fastest growing region. Rising hearing loss prevalence and urban noise exposure drive device demand. Expanding healthcare spending broadens access to audiology clinics and hospitals. Awareness campaigns support screening and early detection in younger and older groups. Digital and wireless devices see strong uptake as purchasing power increases. Global and regional companies expand service networks and local production. Technology adoption, remote care solutions, and mobile-linked platforms improve service reach. Growing elderly populations and improving insurance access support long-term growth. Asia Pacific continues to strengthen volume and value contribution.
Latin America, Middle East and Africa
Latin America, Middle East and Africa together hold 8% share in the audiology devices market. Demand grows as screening programs expand across clinics and hospitals. Limited reimbursement and cost barriers restrict device access in many areas. Rising digital health use supports remote follow-up and reduces care gaps. Global companies invest in training, distribution, and awareness programs to extend reach. Gradual economic improvement increases spending on hearing care services. Public and private partnerships strengthen infrastructure and boost adoption. Aging populations and rising noise exposure support steady need. The region shows ongoing growth potential with improving care pathways.
Audiology Devices Market Segmentations:
By Product Type
- Hearing Aids
- Cochlear Implants
- Bone-anchored Hearing Systems
- Diagnostic Devices
By Technology
- Digital Devices
- Analog Devices
- Wireless Devices
- AI-enabled Devices
By End User
- Hospitals
- ENT Clinics
- Ambulatory Surgical Centers
- Homecare Settings
By Geography
- North America
- U.S.
- Canada
- Mexico
- Europe
- Germany
- France
- U.K.
- Italy
- Spain
- Rest of Europe
- Asia Pacific
- China
- Japan
- India
- South Korea
- South-east Asia
- Rest of Asia Pacific
- Latin America
- Brazil
- Argentina
- Rest of Latin America
- Middle East & Africa
- GCC Countries
- South Africa
- Rest of the Middle East and Africa
Competitive Landscape
Competitive landscape analysis shows leading companies including Sonova Holding AG, Demant A/S, GN Store Nord A/S, Cochlear Limited, WS Audiology, Starkey Hearing Technologies, MED-EL, Amplifon S.p.A., Natus Medical Incorporated, and Zounds Hearing Inc. continue to shape the audiology devices market through product innovation, strategic expansion, and digital integration. Key players invest in wireless, AI-enabled, and app-connected technologies to improve sound quality, device comfort, and service delivery. Partnerships with clinics, hospitals, and teleaudiology platforms help expand patient reach and enhance support networks. Companies also focus on reducing device size and improving battery performance to strengthen user adoption. Mergers, acquisitions, and portfolio diversification remain central strategies for gaining competitive advantage. Rising investment in remote care solutions and training programs supports stronger engagement and device loyalty. Leading firms also expand manufacturing and distribution footprints to meet growing demand across global and regional markets.
Key Player Analysis
- Sonova Holding AG
- Demant A/S
- GN Store Nord A/S
- Cochlear Limited
- WS Audiology
- Starkey Hearing Technologies
- MED-EL
- Amplifon S.p.A.
- Natus Medical Incorporated
- Zounds Hearing Inc.
Recent Developments
- In October 2025, Sonova’s brand Phonak officially introduced the Infinio Ultra hearing technology range, which includes the Infinio Ultra Sphere.
- In October 2025, Sonova did expand its AI leadership by introducing several new products and innovations at the EUHA 2025 (International Congress of Hearing Aid Acousticians) expo in Nuremberg, Germany.
- In July 2025, Cochlear received FDA approval for the Nucleus® Nexa™ smart cochlear implant system.
Report Coverage
The research report offers an in-depth analysis based on Product Type, Technology, End User and Geography. It details leading market players, providing an overview of their business, product offerings, investments, revenue streams, and key applications. Additionally, the report includes insights into the competitive environment, SWOT analysis, current market trends, as well as the primary drivers and constraints. Furthermore, it discusses various factors that have driven market expansion in recent years. The report also explores market dynamics, regulatory scenarios, and technological advancements that are shaping the industry. It assesses the impact of external factors and global economic changes on market growth. Lastly, it provides strategic recommendations for new entrants and established companies to navigate the complexities of the market.
Future Outlook
- Demand for digital and wireless devices will rise as users seek more convenience and control.
- AI-based sound processing will improve personalization and daily user experience.
- Remote fitting and teleaudiology will expand care access and follow-up efficiency.
- Smaller and more discreet designs will reduce stigma and improve adoption rates.
- Stronger integration with smartphones and wearables will enhance connectivity features.
- Growth in pediatric screenings will increase early diagnosis and long-term treatment needs.
- Device replacement cycles will shorten as technology evolves and battery life improves.
- Hybrid care models will strengthen collaboration between hospitals, clinics, and home settings.
- Emerging markets will see stronger investment as awareness and income levels rise.
- Sustainability and recyclability will gain focus as companies address environmental concerns.
Request a Free Sample
Fill in your details and we'll send you a free sample report.
- Sample data tables & charts
- Research methodology
Need a Custom Version of This Report?
Tailor the scope, geography, or segments to your exact requirements.
- Custom geography or segment scope
- Direct access to our analyst team
Frequently Asked Questions
What is the current market size for the Audiology Devices market, and what is its projected size in 2032?
At what Compound Annual Growth Rate is the Audiology Devices market projected to grow between 2024 and 2032?
Which Audiology Devices market segment held the largest share in 2024?
What are the primary factors fueling the growth of the Audiology Devices market?
Who are the leading companies in the Audiology Devices market?
Which region commanded the largest share of the Audiology Devices market in 2024?
Table of Content
Chapter 1. Report Introduction
- 1.1 Report Description & Purpose
- 1.1.1 Report Title & Market Definition
- 1.1.2 Unique Selling Propositions (USP) & Key Differentiators
- 1.1.3 Value Proposition for Stakeholders
- 1.2 Research Objectives
- 1.2.1 Market Sizing Objectives (Volume & Revenue)
- 1.2.2 Segmentation Objectives
- 1.2.3 Competitive Intelligence Objectives
- 1.2.4 Forecast & Scenario Objectives
- 1.3 Report Scope
- 1.3.1 Audiology Devices Scope – Types & Subtypes Covered
- 1.3.2 Geographic Scope – Regions & Countries Covered
- 1.3.3 Historical Period, Base Year & Forecast Period (the historical period; forecast to 2032)
- 1.3.4 Inclusions & Exclusions
- 1.4 HS Code & Classification Framework
- 1.5 Currency, Units & Pricing Basis
- 1.6 Target Stakeholders
- 1.7 Limitations & Assumptions
Chapter 2. Executive Summary
- 2.1 Global Audiology Devices Market Snapshot
- 2.1.1 Market Size – Historical (the historical period) & Forecast (2032) (base year: USD 14,763 million → 2032: USD 23,655.31 million)
- 2.1.2 Volume & Revenue – Global Totals
- 2.1.3 Key Market Highlights – Top Five Facts
- 2.2 Audiology Devices Market Segmentation Snapshot
- 2.2.1 Market Split by Region – vs. 2032
- 2.3 Competitive Snapshot
- 2.3.1 Top 10 Players by Revenue Share –
- 2.3.2 Top 10 Players by Volume Share –
- 2.3.3 Recent Strategic Developments (18-Month Summary)
- 2.4 Key Investment Highlights & Strategic Conclusions
Chapter 3. Audiology Devices Market Dynamics & Industry Analysis
- 3.1 Market Overview & Context
- 3.1.1 Audiology Devices Market Position in the Broader Automotive Value Chain
- 3.1.2 OEM vs. Replacement Market Dynamics
- 3.1.3 Market Maturity & Development Stage by Region
- 3.2 Audiology Devices Market Drivers
- 3.3 Audiology Devices Market Restraints & Challenges
- 3.4 Audiology Devices Market Opportunities
- 3.5 Porter's Five Forces Analysis
- 3.5.1 Threat of New Entrants
- 3.5.2 Bargaining Power of Suppliers
- 3.5.3 Bargaining Power of Buyers
- 3.5.4 Threat of Substitutes
- 3.5.5 Competitive Rivalry – Intensity Assessment
- 3.6 Audiology Devices Value Chain Analysis
- 3.6.1 Upstream – Raw Material/Input Suppliers
- 3.6.1.1 Raw Material/Input 1
- 3.6.1.2 Raw Material/Input 2
- 3.6.1.3 Raw Material/Input 3
- 3.6.2 Midstream – Production/Manufacturing/Service Delivery
- 3.6.2.1 Production/Process Overview
- 3.6.2.2 Key Facility Locations & Capacity by Manufacturer
- 3.6.3 Downstream – Distribution & End Consumer
- 3.6.3.1 Primary Channel – B2B/OEM
- 3.6.3.2 Secondary Channels – Dealer, Retail, Online, Direct
- 3.6.4 Value Chain Profitability Analysis
- 3.6.1 Upstream – Raw Material/Input Suppliers
- 3.7 PESTEL Analysis
- 3.7.1 Political Factors
- 3.7.2 Economic Factors
- 3.7.3 Social Factors
- 3.7.4 Technological Factors
- 3.7.5 Environmental Factors
- 3.7.6 Legal Factors
- 3.8 Audiology Devices Supply Chain Analysis
- 3.8.1 Raw Material/Input Supply Risk Assessment
- 3.8.2 Manufacturing Concentration Risk (Geographic Exposure)
- 3.8.3 Trade Disruption Impact Analysis
- 3.9 Regulatory & Policy Landscape
Note: The regulatory and policy landscape section covers regulations based on their applicability to the market, Audiology Devices category, geography, and scope of the study. Only regulatory frameworks with a material impact on operations, compliance, trade, sustainability, or market access are analyzed in detail.
Chapter 4. Key Investment Pockets & Opportunity Analysis
- 4.1 Audiology Devices Market Attractiveness Analysis
- 4.1.1 By Region – Investment Attractiveness Matrix (Volume × CAGR)
- 4.2 Absolute Revenue Growth Opportunity
- 4.2.1 By Region – Absolute USD Growth Through 2032
- 4.3 Incremental Volume Opportunity
- 4.3.1 By Region – Incremental Volume Through 2032
- 4.3.2 Segment – Incremental Volume
- 4.4 Emerging Submarket Opportunity Deep Dive (Subject to Applicability)
- 4.5 Emerging Market Opportunity Scorecards
- 4.5.1 United States
- 4.5.2 Europe
- 4.5.3 Asia
- 4.5.4 Middle East & Africa
Note: Emerging Market Opportunity Scorecards will be included based on relevance and strategic importance. Regions listed are indicative and may vary depending on data availability and market dynamics.
Chapter 5. Audiology Devices Import-Export Analysis & Trade Flows
- 5.1 Global Trade Overview
- 5.1.1 Global Export Value by Country (the historical period)
- 5.1.2 Global Export Volume by Country (the historical period)
- 5.1.3 Global Import Value by Country (the historical period)
- 5.1.4 Global Import Volume by Country (the historical period)
- 5.1.5 Net Trade Balance by Country (the historical period)
- 5.2 Export Analysis – Segment
- 5.2.1 Type 1 (HS Code)
- 5.2.2 Type 2 (HS Code)
- 5.2.3 Type 3 (HS Code)
- 5.2.4 Type 4 (HS Code)
- 5.2.5 Type 5 (HS Code)
- 5.3 Import Analysis – Segment
- 5.3.1 Type 1 (HS Code)
- 5.3.2 Type 2 (HS Code)
- 5.3.3 Type 3 (HS Code)
- 5.3.4 Type 4 (HS Code)
- 5.3.5 Type 5 (HS Code)
- 5.4 Average Unit Trade Prices
- 5.4.1 Average Export Price – Segment & Country
- 5.4.2 Average Import Price – Segment & Source Country
- 5.4.3 Price Trends (the historical period)
- 5.5 Key Trade Route Analysis
- 5.5.1 Trade Route 1
- 5.5.2 Trade Route 2
- 5.5.3 Trade Route 3
- 5.5.4 Trade Route 4
- 5.5.5 Trade Route 5
- 5.6 Trade Policy Impact Assessment
- 5.6.1 US Anti-Dumping & Section 301 Tariffs
- 5.6.2 EU Customs Union Impact
- 5.6.3 Major Free Trade Agreements
- 5.6.4 USMCA Rules of Origin
Note: Trade policy analysis will be included only where relevant to the Audiology Devices market.
Chapter 6. Competitive Landscape & Company Benchmarking
- 6.1 Audiology Devices Market Concentration & Structure
- 6.1.1 Herfindahl-Hirschman Index (HHI) – vs.
- 6.1.2 Tier 1, Tier 2 & Tier 3 Market Structure
- 6.1.3 Global, Regional & Local Player Dynamics
- 6.2 Audiology Devices Market Share Analysis –
- 6.2.1 Global Revenue Share by Company
- 6.2.2 Global Volume Share by Company
- 6.2.3 Regional Revenue Share
- 6.2.4 Market Share Evolution ( vs. )
- 6.2.5 OEM Segment Share by Company
- 6.2.6 Replacement Segment Share by Company
- 6.3 Production/Delivery Capacity & Facility Analysis
- 6.3.1 Global Installed Capacity
- 6.3.2 Capacity Utilization Rates
- 6.3.3 Production/Output Volume
- 6.3.4 Facility Locations & Capacity Map
- 6.3.5 Planned Capacity Additions
- 6.4 Audiology Devices Competitive Benchmarking Matrix
- 6.4.1 Revenue, Volume, CAGR & Profitability Comparison
- 6.4.2 Channel Revenue Mix
- 6.4.3 Geographic Revenue Exposure
- 6.4.4 R&D Intensity
- 6.4.5 Sustainability Maturity
- 6.5 Strategic Developments in Audiology Devices (Last 24 Months)
- 6.5.1 Mergers, Acquisitions & Divestments
- 6.5.2 New Audiology Devices Launches
- 6.5.3 Facility Expansions
- 6.5.4 Strategic Alliances, Joint Ventures & Partnerships
- 6.5.5 Distribution Expansion & Market Entry
- 6.5.6 Sustainability & ESG Initiatives
- 6.6 Competitive Strategy Mapping
- 6.6.1 Leader, Challenger, Follower & Niche Classification
- 6.6.2 Pricing Strategy Comparison
- 6.6.3 Channel Strategy Matrix
Note: Strategic developments are included based on their materiality and the availability of reliable information.
Chapter 7. Global Audiology Devices Market – By Distribution Channel
- 7.1 Segment Overview
- 7.1.1 Volume & Revenue Split by Channel ( & 2032)
- 7.1.2 Channel Mix Evolution (2032)
Chapter 8. Regional Market Analysis – Global Overview
- 8.1 Global Regional Overview
- 8.1.1 Regional Volume Share
- 8.1.2 Regional Revenue Share
- 8.1.3 Regional Volume by Region
- 8.1.4 Regional Revenue by Region
- 8.1.5 Regional Forecast Through 2032
- 8.2 Cross-Regional Segment Analysis
- 8.2.1 By Distribution Channel
- 8.2.2 By Brand/Price Tier
Chapter 9. North America Audiology Devices Market
- 9.1 United States
- 9.2 Canada
- 9.3 Mexico
Chapter 10. Europe Audiology Devices Market
- 10.1 Germany
- 10.2 France
- 10.3 Italy
- 10.4 United Kingdom
- 10.5 Spain
- 10.6 Poland
- 10.7 Russia
- 10.8 Netherlands
- 10.9 Belgium
- 10.10 Sweden
- 10.11 Denmark
- 10.12 Norway
- 10.13 Rest of Europe
Chapter 11. Asia Pacific Audiology Devices Market
- 11.1 China
- 11.2 India
- 11.3 Japan
- 11.4 South Korea
- 11.5 Thailand
- 11.6 Indonesia
- 11.7 Vietnam
- 11.8 Malaysia
- 11.9 Australia
- 11.10 Rest of Asia Pacific
Chapter 12. Latin America Audiology Devices Market
- 12.1 Brazil
- 12.2 Argentina
- 12.3 Colombia
- 12.4 Chile
- 12.5 Rest of Latin America
Chapter 13. Middle East Audiology Devices Market
- 13.1 Saudi Arabia
- 13.2 United Arab Emirates
- 13.3 Turkey
- 13.4 Israel
- 13.5 Iran
- 13.6 Rest of the Middle East
Chapter 14. Africa Audiology Devices Market
- 14.1 South Africa
- 14.2 Egypt
- 14.3 Nigeria
- 14.4 Morocco
- 14.5 Rest of Africa
Chapter 15. Audiology Devices Company Profiles
- 15.1 [Company 01]
- 15.1.1 Company Overview
- 15.1.2 Key Management Personnel
- 15.1.3 Products & Services Portfolio
- 15.1.4 Financial Performance
- 15.1.5 Key Market Focus & Geographic Presence
- 15.1.6 Recent Developments & Strategic Initiatives
Note: The company profile list is preliminary and may change based on research findings, market developments, data availability, and client requirements.
Chapter 16. Appendices
- Appendix A – List of Abbreviations & Acronyms
- Appendix B – Industry Classification Code Reference – Full Series
- Appendix C – Production & Capacity Data Tables
- Appendix D – End-Use & Demand Base Tables
- Appendix E – Consumption & Replacement Rate Assumptions
- Appendix F – ASP Reference Tables
- Appendix G – Manufacturing & Facility Database
- Appendix H – Import-Export Data Tables
- Appendix I – Regulatory Summary Tables
- Appendix J – Primary Research Participant List (Anonymized)
- Appendix K – Primary Research Questionnaire Framework
- Appendix L – Data Sources & Bibliography
- Appendix M – Market Size Divergence & Source Comparison
Chapter 17. Research Methodology
- 17.1 Research Framework & Philosophy
- 17.2 Secondary Research – Sources, Hierarchy & Data Extraction
- 17.3 Data Modeling – Bottom-Up & Top-Down Market Sizing
- 17.4 Primary Research – Stakeholder Framework, LOI & Sample Sizes
- 17.5 Forecast Methodology – Regression, Scenario & Sensitivity Analysis
- 17.6 Quality Control – Four-Layer Validation Framework
- 17.7 Limitations & Standard Assumptions
- 17.8 Disclaimer
