Market Overview
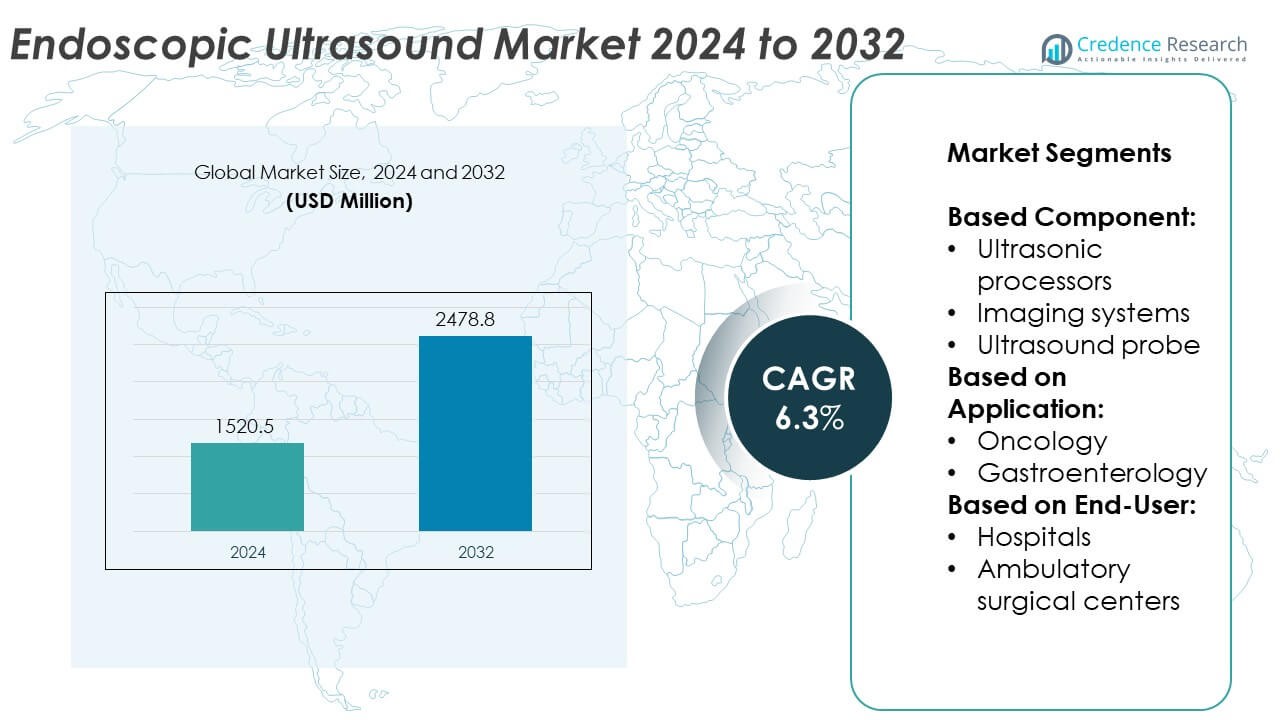
The Endoscopic Ultrasound Market size was valued at USD 1520.5 million in 2024 and is anticipated to reach USD 2478.8 million by 2032, at a CAGR of 6.3% during the forecast period.
| REPORT ATTRIBUTE |
DETAILS |
| Historical Period |
2020-2024 |
| Base Year |
2024 |
| Forecast Period |
2025-2032 |
| Endoscopic Ultrasound Market Size 2024 |
USD 1520.5 Million |
| Endoscopic Ultrasound Market, CAGR |
6.3% |
| Endoscopic Ultrasound Market Size 2032 |
USD 2478.8 Million |
The Endoscopic Ultrasound market grows with rising demand for minimally invasive diagnostics, stringent healthcare safety regulations, and advancements in medical imaging technology. Hospitals and specialty clinics prioritize reliable, compact switches to ensure patient safety and uninterrupted system performance. The market trends toward space-efficient designs, IoT-enabled monitoring, and high-durability components that reduce maintenance needs. Manufacturers increasingly offer customized solutions tailored to oncology and gastroenterology applications, supporting seamless integration with advanced ultrasound systems.
The Endoscopic Ultrasound market shows strong adoption across North America, Europe, Asia Pacific, Latin America, and the Middle East & Africa, driven by healthcare infrastructure expansion and rising demand for advanced diagnostic solutions. North America and Europe lead in technology integration and regulatory compliance, while Asia Pacific experiences rapid growth through healthcare modernization. Latin America and the Middle East & Africa steadily expand adoption with investments in specialized care facilities. Key players include Boston Scientific Corporation, FUJIFILM Holdings Corporation.
Access crucial information at unmatched prices!
Request your sample report today & start making informed decisions powered by Credence Research Inc.!
Download Sample
Market Insights
- The Endoscopic Ultrasound market was valued at USD 1520.5 million in 2024 and is projected to reach USD 2478.8 million by 2032, growing at a CAGR of 6.3% during the forecast period.
- The market benefits from rising demand for minimally invasive diagnostic procedures, increased focus on patient safety, and the integration of advanced safety components in medical imaging systems.
- Key trends include the development of compact, space-efficient switch designs, adoption of IoT-enabled monitoring for predictive maintenance, and customization of components for oncology and gastroenterology applications.
- Competitive activity is driven by global medical device leaders such as Boston Scientific Corporation, FUJIFILM Holdings Corporation, and Medtronic plc, which focus on innovation, regulatory compliance, and strategic partnerships with healthcare providers.
- High production costs due to premium materials, stringent regulatory requirements, and certification complexities act as restraints, especially for smaller manufacturers entering global markets.
- Regionally, North America leads in adoption due to advanced healthcare infrastructure and strict safety standards, Europe follows with strong regulatory frameworks and growing procedure volumes, and Asia Pacific experiences rapid growth fueled by healthcare modernization in China, Japan, and India.
- Latin America and the Middle East & Africa show steady expansion through targeted healthcare investments, growing oncology and gastroenterology services, and partnerships between international suppliers and local distributors to meet rising demand for high-quality disconnect switches.
Market Drivers
Growing Integration of Advanced Safety Mechanisms in Medical Imaging Equipment
The Endoscopic Ultrasound market benefits from the increasing integration of advanced safety mechanisms in diagnostic and therapeutic devices. Hospitals and specialty clinics prioritize reliable disconnect switches to prevent electrical hazards during endoscopic ultrasound procedures. It supports patient safety and ensures uninterrupted performance in high-precision environments. Manufacturers focus on compact designs that fit within the limited space of ultrasound systems without compromising load-handling capacity. The inclusion of quick-response shut-off features minimizes downtime during emergencies. This trend aligns with stringent healthcare safety regulations that mandate dependable electrical isolation components.
- For instance, Medtronic’s Endurant II stent graft system achieves 99.5 percent freedom from aneurysm-related mortality after 8 years, demonstrating long-term durability.
Rising Demand for Minimally Invasive Diagnostic Procedures
The growing adoption of minimally invasive diagnostics drives the demand for robust in endoscopic ultrasound systems. These procedures require uninterrupted device operation, where electrical safety and reliability are essential. It enables clinicians to perform complex imaging and biopsy tasks without risk of system failure. High-performance switches designed to handle prolonged usage cycles meet the operational needs of busy healthcare facilities. The market experiences steady uptake in both developed and emerging healthcare systems due to rising patient awareness. Manufacturers invest in material innovations to deliver longer product lifespans under frequent use.
- For instance, a study reviewed 2,935 EUS procedures, comprising 1,880 diagnostic cases and 1,052 EUS‑FNA/FNB interventions, which illustrates the scale and reliance on uninterrupted system performance.
Increasing Regulatory Compliance Requirements in Healthcare Facilities
Regulatory frameworks in healthcare demand strict adherence to electrical safety standards in imaging devices. The Endoscopic Ultrasound market grows as hospitals upgrade systems to meet compliance requirements. It creates opportunities for suppliers offering products certified under global safety benchmarks such as IEC and UL standards. Compliance-driven procurement ensures that devices integrate with existing infrastructure while meeting performance criteria. The trend extends to portable ultrasound systems where lightweight and certified disconnect switches are vital. Manufacturers strengthen testing protocols to ensure consistent quality across large-scale production.
Technological Advancements in Medical Device Electrical Components
Advancements in electrical engineering enable the development of with higher efficiency and durability. The market benefits from innovations in contact materials, arc suppression technology, and thermal resistance. It allows medical imaging systems to operate with reduced maintenance and enhanced operational safety. Enhanced switch designs improve integration with IoT-enabled monitoring systems in advanced ultrasound platforms. This supports predictive maintenance and real-time fault detection. Growing collaborations between medical device manufacturers and electrical component suppliers accelerate innovation pipelines.
Market Trends
Adoption of Compact and Space-Efficient Designs
The Endoscopic Ultrasound market witnesses a clear shift toward compact, space-efficient designs suited for modern medical equipment. Manufacturers engineer switches that fit seamlessly into portable and cart-based ultrasound systems. It allows healthcare providers to optimize equipment layout in constrained operating rooms. Smaller form factors without compromising electrical load capacity improve device usability. Hospitals favor solutions that simplify integration during system retrofits. This trend aligns with the rising demand for ergonomic medical device configurations.
- For instance, Boston Scientific’s Acquire™ S Fine Needle Biopsy device with the Taper Point Stylet achieves a 36.6% reduction in puncture force compared to traditional 22 ga Franseen needles.
Integration of Smart Monitoring and Diagnostic Features
Manufacturers incorporate smart monitoring capabilities into disconnect switches to enhance operational safety. The Endoscopic Ultrasound market benefits from switches equipped with sensors that detect electrical anomalies and trigger alerts. It supports preventive maintenance strategies and reduces the risk of unexpected failures. Real-time data collection enables facility managers to track performance metrics and identify wear patterns. Integration with hospital asset management systems further improves equipment lifecycle planning. This trend reflects the broader movement toward digital transformation in healthcare infrastructure.
- For instance, Boston Scientific’s latest generation defibrillators record lead impedance values that can reach up to 130 ohms for single-coil configurations, enabling detection of anomalies beyond the typical 125 ohm threshold.
Growing Preference for High-Durability and Low-Maintenance Components
Healthcare providers increasingly prefer that deliver long service life with minimal maintenance needs. The market responds with products featuring enhanced contact materials, corrosion resistance, and improved thermal stability. It ensures consistent performance in high-usage environments such as tertiary care centers. High-durability designs reduce replacement frequency, lowering operational costs for hospitals. The shift toward reliable, low-maintenance solutions aligns with procurement priorities in both public and private healthcare systems. Manufacturers emphasize rigorous quality testing to reinforce product dependability.
Customization for Specific Clinical Applications
There is a rising trend toward customized tailored for specific endoscopic ultrasound applications. Manufacturers design variants that address unique voltage, current, and form factor requirements for different system models. The Endoscopic Ultrasound market benefits from this shift toward application-specific engineering. It enables seamless integration without extensive modifications to the host equipment. Tailored solutions meet the specialized needs of complex diagnostic procedures. Growing collaboration between medical device OEMs and component suppliers accelerates the development of these custom-fit products.
Market Challenges Analysis
Stringent Regulatory Compliance and Certification Barriers
The Endoscopic Ultrasound market faces challenges from complex regulatory frameworks and certification processes. Medical electrical components must meet stringent global standards, including IEC, UL, and ISO requirements. It demands extensive testing, documentation, and quality control measures, which extend product development timelines. Smaller manufacturers struggle to allocate resources for compliance without affecting production schedules. Varying regional regulations complicate international market entry, requiring tailored certification strategies for each geography. Continuous updates to safety standards add pressure on suppliers to maintain compliance across multiple product lines.
High Cost of Advanced Materials and Manufacturing Precision
Producing high-performance for medical imaging devices requires specialized materials and precision engineering. The market encounters cost pressures from the use of premium contact metals, arc-resistant coatings, and heat-tolerant components. It increases manufacturing expenses and impacts pricing flexibility for suppliers. Achieving the necessary miniaturization without compromising durability involves advanced fabrication techniques that demand skilled labor and specialized equipment. Limited availability of certain high-grade materials can lead to supply chain bottlenecks, affecting timely deliveries. Balancing cost efficiency with uncompromised performance remains a persistent challenge for market participants.
Market Opportunities
Expansion of Advanced Medical Imaging Infrastructure
The Endoscopic Ultrasound market has significant growth potential with the global expansion of advanced medical imaging facilities. Hospitals and specialty clinics in emerging economies are investing in high-end diagnostic systems, creating demand for reliable and compliant electrical safety components. It enables suppliers to introduce products that cater to newly built healthcare infrastructure while meeting international safety benchmarks. Government-led healthcare modernization projects further open procurement opportunities for certified disconnect switches. The increasing penetration of portable and mobile ultrasound systems also boosts demand for compact, high-performance designs. Partnerships with medical device OEMs can strengthen supply chain integration and secure long-term contracts.
Rising Demand for IoT-Enabled and Predictive Maintenance Solutions
The growing focus on predictive maintenance in healthcare technology presents a strong opportunity for manufacturers. Incorporating IoT-enabled monitoring features allows real-time diagnostics, enhancing operational reliability in medical imaging devices. The Endoscopic Ultrasound Disconnect Switch market benefits from the development of intelligent switches that transmit performance data to centralized management systems. It supports proactive replacement scheduling, reducing equipment downtime in high-demand clinical environments. Customizable designs with embedded sensors appeal to hospitals seeking to align with smart healthcare initiatives. This shift toward connected, data-driven components can position manufacturers as key partners in digital healthcare transformation.
Market Segmentation Analysis:
By Component:
The Endoscopic Ultrasound market is segmented into ultrasonic processors, imaging systems, and ultrasound probes. Ultrasonic processors account for a significant share due to their role in delivering precise energy output for diagnostic and interventional procedures. It ensures electrical safety during power fluctuations and supports uninterrupted operation. Imaging systems integrate disconnect switches to protect sensitive electronics from overloads, enhancing system longevity in high-usage environments. Ultrasound probes require compact and lightweight disconnect solutions that fit within handheld configurations while maintaining performance. Growth in advanced probe designs with higher imaging resolution continues to create demand for specialized switch components.
- For instance, Boston Scientific’s Hot AXIOS™ electrocautery‑enhanced delivery system provides a working channel width of 3.6 Fr (1.2 mm), demonstrating precision in compact configurations.
By Application:
Oncology represents a key application segment, with rising adoption of endoscopic ultrasound in cancer detection and staging procedures. The Endoscopic Ultrasound market benefits from the need to safeguard devices that perform critical biopsy and tumor localization tasks. It supports consistent performance during lengthy diagnostic sessions where system stability is essential. Gastroenterology also holds strong market potential, driven by increased procedures for pancreatic, biliary, and gastrointestinal disorders. High-precision imaging in these cases demands reliable electrical isolation to prevent disruptions. Manufacturers tailor switch designs for the specific operational demands of both oncology and gastroenterology applications.
- For instance, Medtronic’s INVOS™ regional oximetry sensor measures 7.5 cm long by 3.5 cm wide and weighs 31 g, showing how closely integrated, lightweight components improve system resilience.
By End-User:
Hospitals dominate the end-user segment due to the scale of diagnostic operations and high patient throughput. Large healthcare facilities prioritize that meet rigorous safety and compliance standards while supporting a wide range of endoscopic ultrasound systems. It enables integration across both fixed and mobile platforms in diverse clinical departments. Ambulatory surgical centers represent a growing segment, with their focus on cost-effective, high-efficiency diagnostic services. Compact, energy-efficient disconnect switches appeal to these centers, which often operate in space-constrained environments. The rising number of outpatient procedures continues to create opportunities for tailored switch solutions in this segment.
Segments:
Based on Component:
- Ultrasonic processors
- Imaging systems
- Ultrasound probe
Based on Application:
- Oncology
- Gastroenterology
Based on End-User:
- Hospitals
- Ambulatory surgical centers
Based on the Geography:
- North America
- Europe
- Germany
- France
- U.K.
- Italy
- Spain
- Rest of Europe
- Asia Pacific
- China
- Japan
- India
- South Korea
- South-east Asia
- Rest of Asia Pacific
- Latin America
- Brazil
- Argentina
- Rest of Latin America
- Middle East & Africa
- GCC Countries
- South Africa
- Rest of the Middle East and Africa
Regional Analysis
North America
North America holds the largest share of the Endoscopic Ultrasound market, accounting for 38% of the global revenue in 2024. The region benefits from advanced healthcare infrastructure, high adoption rates of minimally invasive diagnostics, and strict safety regulations for medical equipment. Hospitals and specialty clinics invest heavily in certified disconnect switches to ensure operational safety and compliance with FDA and CSA standards. It is also a hub for leading medical device manufacturers and suppliers, enabling strong domestic production capabilities. Technological innovation in imaging and energy delivery systems further drives demand for compact, high-performance disconnect switches. Government funding for early cancer detection programs and gastrointestinal disease management continues to sustain market growth in the region.
Europe
Europe represents 29% of the Endoscopic Ultrasound market, supported by well-established healthcare systems and strong regulatory frameworks such as CE marking requirements. The region’s emphasis on patient safety and adherence to stringent electrical equipment standards drives consistent procurement of certified components. It benefits from the presence of major medical technology companies in Germany, the UK, and France, which integrate advanced disconnect switches into high-end endoscopic ultrasound systems. Demand is rising for compact designs that fit within mobile diagnostic units used in both urban and rural healthcare facilities. The European market also gains momentum from increased oncology screening initiatives and gastroenterology procedure volumes. Investments in upgrading hospital infrastructure, particularly in Eastern Europe, further contribute to market expansion.
Asia Pacific
Asia Pacific accounts for 22% of the global Endoscopic Ultrasound market, driven by rapid healthcare modernization and growing demand for advanced diagnostic equipment. Countries such as China, Japan, South Korea, and India are expanding their hospital networks and specialty care centers. It experiences strong demand for cost-effective yet high-quality disconnect switches, especially in portable ultrasound systems for high-volume clinical settings. Local manufacturing capabilities in countries like China and Japan support faster supply and competitive pricing. Increasing prevalence of gastrointestinal disorders and cancer cases drives the need for reliable endoscopic ultrasound solutions. Government healthcare reforms and public–private partnerships continue to stimulate market penetration in both urban and semi-urban regions.
Latin America
Latin America holds 7% of the Endoscopic Ultrasound market, with Brazil and Mexico as the leading contributors. The market is growing steadily as healthcare facilities upgrade their diagnostic capabilities to meet rising demand for oncology and gastroenterology procedures. It benefits from targeted government investments in cancer screening and early detection programs. Imported medical devices dominate the market, creating opportunities for international suppliers offering compliant, durable disconnect switches. Hospitals seek components that meet global safety certifications to enhance system reliability. Increasing collaboration between local distributors and global OEMs is expected to strengthen market reach across the region.
Middle East & Africa
The Middle East & Africa region accounts for 4% of the global Endoscopic Ultrasound market, with the Gulf Cooperation Council (GCC) countries leading adoption. Growing investments in specialized healthcare facilities and medical tourism contribute to rising demand for advanced imaging equipment. It faces challenges in local manufacturing, relying heavily on imports from established medical device hubs. Hospitals prioritize certified disconnect switches to ensure compliance with international safety standards. Emerging oncology care programs and gastroenterology services in urban centers create new procurement opportunities. Expansion of private healthcare providers in the UAE, Saudi Arabia, and South Africa is expected to gradually boost market share in the coming years.
Shape Your Report to Specific Countries or Regions & Enjoy 30% Off!
Key Player Analysis
- SMITH & NEPHEW
- PENTAX Medical
- HUACO HEALTHCARE TECHNOLOGIES CO. LTD
- STERIS plc
- FUJIFILM Holdings Corporation
- Philips
- Medi-Globe Corporation
- Medtronic plc
- Boston Scientific Corporation
- SonoScape Medical Corp.
- Braun
- NIHON DEMPA KOGYO CO., LTD.
- Cook Medical
- ConMed
Competitive Analysis
Boston Scientific Corporation, FUJIFILM Holdings Corporation, Medtronic plc, PENTAX Medical, and Philips are among the leading players in the Endoscopic market. These companies leverage strong research and development capabilities to design compact, high-performance disconnect switches that integrate seamlessly into advanced endoscopic ultrasound systems. They prioritize compliance with international safety standards, ensuring product reliability and suitability for diverse clinical environments. Strategic collaborations with hospitals, specialty clinics, and original equipment manufacturers strengthen market penetration and enhance product customization. Continuous innovation focuses on improving durability, reducing maintenance needs, and enabling integration with IoT-based monitoring systems for predictive maintenance. Global distribution networks and targeted regional expansion strategies allow these players to meet the specific requirements of both developed and emerging healthcare markets. Investments in material advancements, arc suppression technology, and miniaturization techniques enable the delivery of solutions that support high-precision oncology and gastroenterology procedures. By combining product innovation with strong after-sales support and training programs, these companies maintain competitive positioning and foster long-term relationships with healthcare providers. Their ability to align technological capabilities with evolving clinical demands positions them to capture sustained growth opportunities in the market.
Recent Developments
- In 2025, PENTAX Medical launched the EUS/EBUS-J10 line-up, which received significant recognition from the endoscopy community.
- In February 2024, Fujifilm announced the launch of the ALOKA ARIETTA 850 diagnostic ultrasound system in India. This system also incorporates HD-THI for deeper penetration, ensuring accurate diagnoses, along with combi-elastography, pure symphonic architecture, and CHI-TIC and inflow time mapping for clearer visibility by reducing noise and enhancing the completeness and continuity of tissue boundaries.
- In 2024, Olympus corporation launched a new 4k camera head1, CH-S700-08-LB, for endoscopic urology and gynecology procedures in Europe.
Market Concentration & Characteristics
The Endoscopic Ultrasound market is moderately concentrated, with a mix of global medical device leaders and specialized component manufacturers driving competition. It is characterized by high entry barriers due to stringent regulatory requirements, advanced engineering needs, and the necessity for compliance with international safety certifications. Leading companies maintain a competitive edge through continuous innovation, integration of compact and durable designs, and strategic partnerships with healthcare providers and equipment OEMs. The market demands precision manufacturing, premium materials, and reliable performance under intensive clinical use, creating a preference for established brands with proven quality records. Regional differentiation is significant, with advanced economies emphasizing technological sophistication and emerging markets prioritizing cost-effective solutions without compromising safety standards. Growth opportunities arise from the rising demand for minimally invasive diagnostics and IoT-enabled monitoring features that support predictive maintenance. The competitive landscape encourages a focus on long-term client relationships, after-sales service, and customization to meet specific oncology and gastroenterology application requirements.
Report Coverage
The research report offers an in-depth analysis based on Component, Application, End-User and Geography. It details leading market players, providing an overview of their business, product offerings, investments, revenue streams, and key applications. Additionally, the report includes insights into the competitive environment, SWOT analysis, current market trends, as well as the primary drivers and constraints. Furthermore, it discusses various factors that have driven market expansion in recent years. The report also explores market dynamics, regulatory scenarios, and technological advancements that are shaping the industry. It assesses the impact of external factors and global economic changes on market growth. Lastly, it provides strategic recommendations for new entrants and established companies to navigate the complexities of the market.
Future Outlook
- The market will expand with increasing adoption of minimally invasive diagnostic procedures worldwide.
- Demand will rise for compact and lightweight disconnect switches suited for portable ultrasound systems.
- Integration of IoT-enabled monitoring will become standard for predictive maintenance and operational safety.
- Manufacturers will focus on developing high-durability components with extended service life.
- Customization for oncology and gastroenterology applications will drive product innovation.
- Regulatory compliance will continue to shape product design and market entry strategies.
- Emerging economies will present strong growth potential through healthcare infrastructure upgrades.
- Strategic partnerships between OEMs and component suppliers will enhance product integration.
- Advancements in contact materials and arc suppression technology will improve reliability.
- Global competition will intensify, pushing companies to strengthen after-sales service and training support.


