
Market Overview
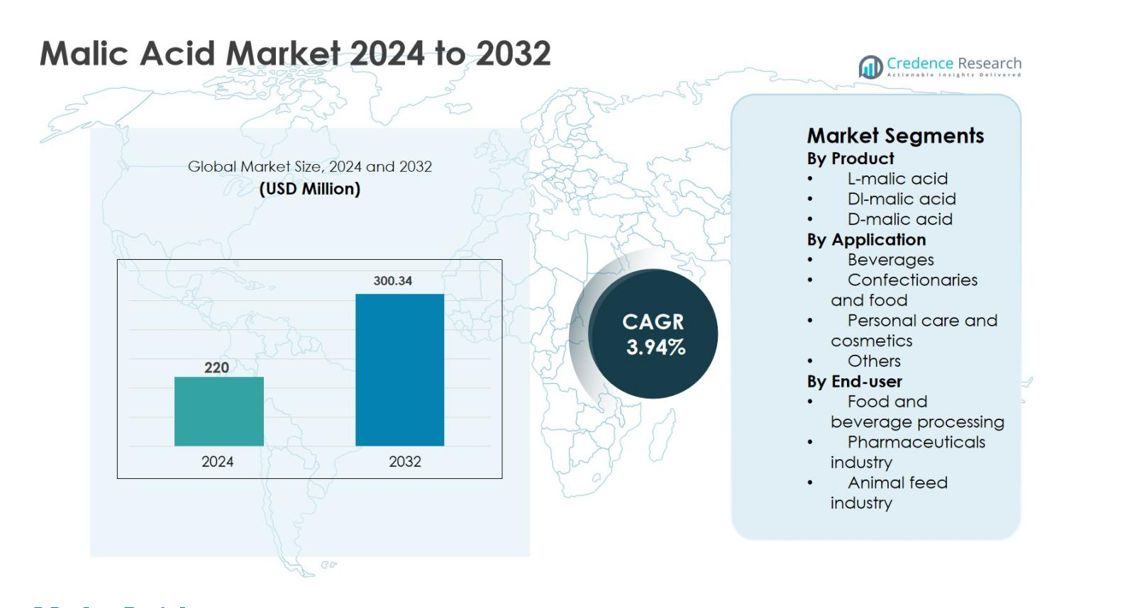
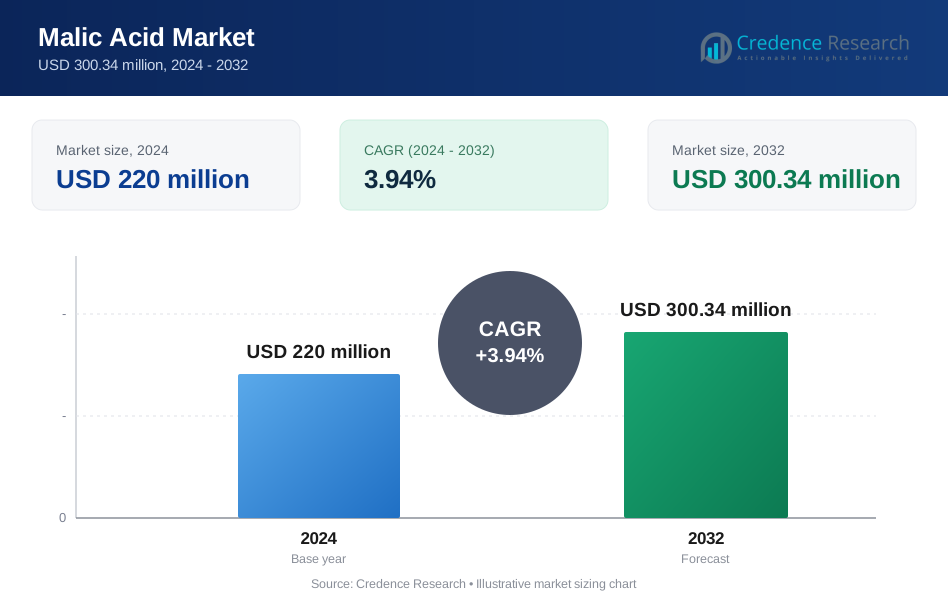
Malic Acid market size was valued at USD 220 million in 2024 and is anticipated to reach USD 300.34 million by 2032, growing at a CAGR of 3.94% during the forecast period.
| REPORT ATTRIBUTE | DETAILS |
|---|---|
| Historical Period | 2020-2023 |
| Base Year | 2024 |
| Forecast Period | 2025-2032 |
| Malic Acid Market Size 2024 | USD 220 million |
| Malic Acid Market, CAGR | 3.94% |
| Malic Acid Market Size 2032 | USD 300.34 million |
Malic Acid market is driven by the strong presence of established global and regional manufacturers focused on food, pharmaceutical, and personal care applications. Key players such as Corbion N.V., Bartek Ingredients Inc., Lonza Group Ltd., Fuso Chemical Co. Ltd., Changmao Biochemical Engineering Co. Ltd., Anhui Sealong Biotechnology Co. Ltd., NACALAI TESQUE INC, Isegen South Africa Pty Ltd., Guangzhou ZIO Chemical Co. Ltd., and Muby Chem Ltd. compete through product quality, fermentation-based production, and expanded distribution networks. Asia-Pacific emerged as the leading region with an exact 34.9% market share in 2024, supported by large-scale manufacturing capacity and high consumption of processed foods and beverages. North America followed with 27.8% share, driven by clean-label demand, while Europe accounted for 24.6%, supported by regulatory preference for natural acidulants.
Market Insights
- Malic Acid market size was valued at USD 220 million in 2024 and is projected to reach USD 300.34 million by 2032, growing at a CAGR of 3.94% during the forecast period.
- Market growth is primarily driven by rising demand from the food and beverage industry, especially beverages and confectionery, where malic acid is widely used for flavor enhancement, pH control, and taste stability, supported by increasing clean-label and natural ingredient adoption.
- A key market trend is the growing preference for L-malic acid, which dominated the product segment with 62.4% share in 2024, due to its natural sourcing and compatibility with health-focused and premium formulations across food, nutraceutical, and personal care applications.
- The market remains moderately consolidated, with leading players focusing on fermentation-based production, capacity expansion, and long-term supply agreements to manage competition from substitute acidulants such as citric and lactic acid.
- Asia-Pacific led the Malic Acid market with 34.9% share in 2024, followed by North America at 27.8% and Europe at 24.6%, driven by strong food processing, pharmaceutical manufacturing, and rising consumption of processed and functional products.
Market Segmentation Analysis:
By Product
The Malic Acid market by product is led by L-malic acid, which accounted for 62.4% market share in 2024, driven by its natural occurrence in fruits and strong compatibility with clean-label formulations. L-malic acid is widely preferred in food, beverage, and nutraceutical applications due to its smoother taste profile, higher solubility, and broad regulatory acceptance. DL-malic acid follows with notable adoption in cost-sensitive food and industrial uses, while D-malic acid holds a smaller share because of limited commercial applications. Rising demand for naturally sourced acidulants continues to reinforce the dominance of L-malic acid.
- For instance, Coca‑Cola lists malic acid as an acidulant in select flavored beverages to enhance tartness while maintaining a balanced taste profile.
By Application
The beverages segment dominated the Malic Acid market with a 38.6% share in 2024, supported by extensive use in carbonated drinks, sports beverages, flavored waters, and fruit-based formulations. Malic acid improves flavor stability, enhances tartness, and balances sweetness, making it ideal for modern beverage formulations. Confectionery and food applications follow, driven by demand for taste enhancement and shelf-life improvement. Personal care and cosmetics show steady growth due to malic acid’s exfoliating and pH-regulating properties, while other applications maintain stable demand across specialty industrial uses.
- For instance, Mars Wrigley and other major candy manufacturers use malic acid in sour gums and candies to provide a long‑lasting, intense tart flavor.
By End-User
The food and beverage processing industry held the largest share of 46.9% in 2024, driven by high consumption of malic acid as an acidulant, flavor enhancer, and buffering agent in processed foods and drinks. Its functional advantages, including taste enhancement and formulation stability, support widespread adoption among manufacturers. The pharmaceuticals industry represents a growing end-user segment, utilizing malic acid in effervescent tablets and oral drug formulations. The animal feed industry also contributes steadily, using malic acid to improve feed palatability and digestive efficiency.
Key Growth Drivers
Rising Demand from Food and Beverage Industry
The Malic Acid market is significantly driven by rising demand from the global food and beverage industry, where malic acid is extensively used as an acidulant, flavor enhancer, and pH regulator. Increasing consumption of carbonated drinks, sports beverages, flavored waters, confectionery, and processed foods continues to support volume growth. Manufacturers prefer malic acid due to its superior flavor retention, smoother sourness profile, and ability to enhance fruit flavors compared to alternative acidulants. Growing consumer inclination toward ready-to-drink beverages and packaged foods, especially in emerging economies, further strengthens demand. Additionally, the shift toward clean-label and naturally derived ingredients has accelerated the adoption of L-malic acid in premium food and beverage formulations, reinforcing long-term market expansion across both developed and developing regions.
- For instance, Nestlé uses malic acid in selected powdered beverage mixes and juice drinks to deliver consistent tartness and maintain taste over shelf life.
Expansion of Clean-Label and Natural Ingredient Formulations
The increasing focus on clean-label products and natural ingredients acts as a major growth driver for the Malic Acid market. Food, beverage, and nutraceutical manufacturers are reformulating products to eliminate synthetic additives and meet consumer expectations for transparency and natural sourcing. Naturally derived L-malic acid, commonly extracted through fermentation processes, aligns well with these requirements and supports clean-label claims. This trend is particularly strong in functional foods, dietary supplements, and health-oriented beverages. Regulatory support for natural acidulants and rising awareness of ingredient safety further contribute to adoption. As brands emphasize product differentiation through natural positioning, malic acid demand continues to grow across multiple application areas, supporting steady market expansion.
- For instance, Danone has highlighted its move toward shorter, more recognizable ingredient lists in yogurt and beverage portfolios, incorporating organic acids that fit clean-label expectations.
Growing Utilization in Pharmaceutical and Nutraceutical Applications
The pharmaceutical and nutraceutical sectors represent another key growth driver for the Malic Acid market. Malic acid is widely used in effervescent tablets, syrups, and oral drug formulations due to its buffering capacity, pleasant taste, and compatibility with active pharmaceutical ingredients. Growth in preventive healthcare, increasing consumption of dietary supplements, and rising geriatric populations contribute to higher demand. In nutraceuticals, malic acid supports energy metabolism formulations and mineral absorption products. Expanding pharmaceutical manufacturing capacities in Asia-Pacific and Latin America further accelerate consumption. Continuous innovation in drug delivery formats and flavored dosage forms strengthens malic acid adoption, ensuring consistent demand growth from healthcare-related industries.
Key Trends & Opportunities
Increasing Adoption in Personal Care and Cosmetics
A notable trend in the Malic Acid market is its growing adoption in personal care and cosmetic formulations. Malic acid is increasingly used in skincare products as an alpha-hydroxy acid for exfoliation, skin renewal, and pH adjustment. Rising consumer demand for mild, fruit-derived acids in beauty products supports this trend. Clean beauty and dermatologically tested formulations further encourage manufacturers to replace harsh synthetic acids with naturally derived alternatives. Expanding skincare markets in Asia-Pacific and increasing premium cosmetic consumption in North America and Europe create attractive growth opportunities. Product innovation in anti-aging, acne treatment, and skin-brightening solutions continues to expand malic acid’s application scope.
- For instance, Paula’s Choice uses fruit-derived AHAs, including malic acid, in certain exfoliating treatments to support gentle resurfacing and smoother skin texture.
Technological Advancements in Bio-Based Production
Technological advancements in fermentation and bio-based production processes present strong growth opportunities for the Malic Acid market. Manufacturers are increasingly investing in sustainable production methods to reduce reliance on petrochemical-based synthesis and improve cost efficiency. Advances in microbial fermentation improve yield, purity, and scalability of L-malic acid production, supporting competitive pricing and environmental compliance. These innovations align with global sustainability goals and corporate ESG strategies. Improved production efficiency also enables suppliers to meet rising demand from food, pharmaceutical, and cosmetic industries. As sustainability becomes a critical purchasing criterion, bio-based malic acid production offers long-term competitive advantages.
- For instance, Anhui Huaheng Biological launched a fermentation-based L-malic acid project with around 50,000 tons per year capacity as an eco-friendly alternative to chemical routes, targeting food, pharmaceutical, cosmetic, and feed applications
Key Challenges
Price Volatility of Raw Materials
Price volatility of raw materials poses a key challenge for the Malic Acid market. Fluctuations in feedstock prices, energy costs, and fermentation inputs directly impact production economics and profit margins. Manufacturers operating in cost-sensitive markets face challenges in maintaining stable pricing while ensuring product quality. Sudden increases in raw material costs can disrupt supply chains and affect long-term contracts with end users. Smaller producers are particularly vulnerable to these fluctuations, which may limit capacity expansion and investment. Managing input cost volatility while remaining competitive continues to be a critical challenge for market participants.
Competition from Substitute Acidulants
The Malic Acid market faces strong competition from substitute acidulants such as citric acid, tartaric acid, and lactic acid, which are widely available and often lower in cost. Citric acid, in particular, dominates many food and beverage applications due to its extensive availability and established supply chain. This competitive pressure limits pricing flexibility for malic acid manufacturers and can restrict adoption in cost-driven formulations. End users often switch between acidulants based on price, functionality, and availability. Overcoming substitution risk requires continuous product differentiation, application-specific advantages, and education on malic acid’s superior flavor and functional performance.
Regional Analysis
North America North America accounted for 27.8% of the Malic Acid market share in 2024, supported by strong demand from the food and beverage, pharmaceuticals, and personal care industries. The region benefits from high consumption of functional beverages, processed foods, and dietary supplements, where malic acid is widely used for flavor enhancement and formulation stability. Clean-label trends and preference for naturally derived ingredients further boost L-malic acid adoption. The presence of established food manufacturers, advanced pharmaceutical production, and stringent quality standards continues to drive consistent demand across the United States and Canada, ensuring steady regional market growth.
Europe
Europe held 24.6% market share in 2024, driven by strong regulatory support for natural additives and widespread adoption of clean-label formulations. The region shows high demand for malic acid in beverages, confectionery, bakery products, and cosmetic formulations. Countries such as Germany, France, and the United Kingdom lead consumption due to mature food processing and pharmaceutical industries. Growing focus on sustainable sourcing and bio-based production further supports market expansion. Additionally, increasing use of malic acid in personal care and dermatological products strengthens demand, positioning Europe as a stable and innovation-driven regional market.
Asia-Pacific
Asia-Pacific dominated the Malic Acid market with a 34.9% share in 2024, supported by rapid expansion of food and beverage processing, pharmaceuticals, and nutraceutical manufacturing. Rising population, urbanization, and increasing consumption of packaged foods and flavored beverages significantly drive demand. China and India lead regional growth due to large-scale production capacity and cost-efficient manufacturing. Growing awareness of natural ingredients and expanding middle-class consumption further support market expansion. Additionally, increasing investments in fermentation-based production technologies strengthen regional supply capabilities, making Asia-Pacific the fastest-growing and most influential regional market.
Latin America
Latin America accounted for 7.1% market share in 2024, supported by growing food and beverage production and rising consumption of processed foods and soft drinks. Countries such as Brazil and Mexico drive regional demand due to expanding beverage manufacturing and increasing adoption of acidulants in food processing. Improving pharmaceutical manufacturing capabilities and growing nutraceutical awareness also contribute to steady growth. Although the market remains smaller compared to developed regions, rising urbanization, improving disposable income, and gradual adoption of clean-label ingredients create favorable conditions for sustained malic acid demand across the region.
Middle East & Africa
The Middle East & Africa region held 5.6% market share in 2024, driven by growing food processing activities and increasing consumption of packaged and flavored food products. Expanding beverage production in Gulf countries and rising pharmaceutical manufacturing in select African economies support regional demand. The market benefits from gradual modernization of food supply chains and increasing import of specialty food ingredients. While adoption remains moderate, rising health awareness and improving regulatory frameworks for food additives are expected to support gradual growth, positioning the region as an emerging opportunity within the global Malic Acid market.
Market Segmentations:
By Product
- L-malic acid
- Dl-malic acid
- D-malic acid
By Application
- Beverages
- Confectionaries and food
- Personal care and cosmetics
- Others
By End-user
- Food and beverage processing
- Pharmaceuticals industry
- Animal feed industry
By Geography
- North America
- U.S.
- Canada
- Mexico
- Europe
- Germany
- France
- U.K.
- Italy
- Spain
- Rest of Europe
- Asia Pacific
- China
- Japan
- India
- South Korea
- South-east Asia
- Rest of Asia Pacific
- Latin America
- Brazil
- Argentina
- Rest of Latin America
- Middle East & Africa
- GCC Countries
- South Africa
- Rest of the Middle East and Africa
Competitive Landscape
The Malic Acid market features a moderately consolidated landscape, characterized by the presence of both global manufacturers and regional producers competing on product quality, purity, pricing, and supply reliability. Key players such as Corbion N.V., Bartek Ingredients Inc., Lonza Group Ltd., Fuso Chemical Co. Ltd., Changmao Biochemical Engineering Co. Ltd., Anhui Sealong Biotechnology Co. Ltd., NACALAI TESQUE INC, Isegen South Africa Pty Ltd., Guangzhou ZIO Chemical Co. Ltd., and Muby Chem Ltd. focus on expanding production capacity and strengthening distribution networks to serve food, pharmaceutical, and personal care applications. Companies increasingly emphasize L-malic acid to address growing clean-label and natural ingredient demand. Strategic investments in fermentation technology, process optimization, and sustainability initiatives help players enhance cost efficiency and meet regulatory standards. Long-term supply agreements with food and beverage manufacturers and geographic expansion across emerging markets remain key competitive strategies.
Key Player Analysis
- Corbion N.V.
- Muby Chem Ltd.
- NACALAI TESQUE INC
- Lonza Group Ltd.
- Fuso Chemical Co. Ltd.
- Anhui Sealong Biotechnology Co. Ltd.
- Isegen South Africa Pty Ltd.
- Changmao Biochemical Engineering Co. Ltd.
- Guangzhou ZIO Chemical Co. Ltd
- Bartek Ingredients Inc.
Recent Developments
- In December 2025, TCL Specialties LLC (subsidiary of Thirumalai Chemicals Ltd.) commenced pre-commissioning and start-up activities at its new West Virginia, USA manufacturing facility, which includes a Food Ingredients plant producing malic acid alongside maleic anhydride, boosting domestic supply for North America and other regions.
- In June 2024, Anhui Huaheng Biology Company Ltd. (AHB) developed and launched Bioscentis MA, a bio-based L-Malic Acid under its Bioscentis brand an eco-friendly malic acid with higher acidity suited for beverages, confectionery, and baking applications.
- In 2024, NNB Nutrition introduced a Moisture-Resistant DL-Malic Acid product using its patented FlowTech™ technology to improve stability and processing performance in food and beverage applications.
Report Coverage
The research report offers an in-depth analysis based on Product, Application, End-User and Geography. It details leading market players, providing an overview of their business, product offerings, investments, revenue streams, and key applications. Additionally, the report includes insights into the competitive environment, SWOT analysis, current market trends, as well as the primary drivers and constraints. Furthermore, it discusses various factors that have driven market expansion in recent years. The report also explores market dynamics, regulatory scenarios, and technological advancements that are shaping the industry. It assesses the impact of external factors and global economic changes on market growth. Lastly, it provides strategic recommendations for new entrants and established companies to navigate the complexities of the market.
Future Outlook
- The Malic Acid market will continue to expand steadily, supported by consistent demand from food, beverage, pharmaceutical, and personal care industries.
- Adoption of L-malic acid will increase further as manufacturers prioritize clean-label, natural, and fruit-derived ingredients.
- Beverage applications will remain the primary consumption segment, driven by growth in functional drinks, flavored waters, and sports beverages.
- Pharmaceutical and nutraceutical usage will rise due to increasing production of effervescent tablets and flavored oral formulations.
- Bio-based and fermentation-driven production technologies will gain wider adoption to improve sustainability and supply efficiency.
- Asia-Pacific will maintain its leading position due to strong manufacturing capacity and rising processed food consumption.
- Personal care and cosmetic applications will grow steadily, supported by demand for mild exfoliating and pH-balancing ingredients.
- Competitive intensity will increase as manufacturers focus on product differentiation and application-specific solutions.
- Price sensitivity and substitution by alternative acidulants will encourage innovation in performance and cost optimization.
- Regulatory support for natural food additives will strengthen long-term demand across global markets.
Request a Free Sample
Fill in your details and we'll send you a free sample report.
- Sample data tables & charts
- Research methodology
Need a Custom Version of This Report?
Tailor the scope, geography, or segments to your exact requirements.
- Custom geography or segment scope
- Direct access to our analyst team
Frequently Asked Questions
What is the current market size for Malic Acid market, and what is its projected size in 2032?
At what Compound Annual Growth Rate is the Malic Acid market projected to grow between 2024 and 2032?
Which Form segment governs the demand for Malic Acid in the world?
Who are the major players in the global Malic Acid Market?
Who are the leading companies in the Malic Acid market?
Table of Content
Chapter 1. Report Introduction
- 1.1 Report Description & Purpose
- 1.1.1 Report Title & Market Definition
- 1.1.2 Unique Selling Propositions (USP) & Key Differentiators
- 1.1.3 Value Proposition for Stakeholders
- 1.2 Research Objectives
- 1.2.1 Market Sizing Objectives (Volume & Revenue)
- 1.2.2 Segmentation Objectives
- 1.2.3 Competitive Intelligence Objectives
- 1.2.4 Forecast & Scenario Objectives
- 1.3 Report Scope
- 1.3.1 Malic Acid Scope – Types & Subtypes Covered
- 1.3.2 Geographic Scope – Regions & Countries Covered
- 1.3.3 Historical Period, Base Year & Forecast Period (2024; forecast to 2032)
- 1.3.4 Inclusions & Exclusions
- 1.4 HS Code & Classification Framework
- 1.5 Currency, Units & Pricing Basis
- 1.6 Target Stakeholders
- 1.7 Limitations & Assumptions
Chapter 2. Executive Summary
- 2.1 Global Malic Acid Market Snapshot
- 2.1.1 Market Size – Historical (2024) & Forecast (2024-2032) (2024: USD 220 million → 2032: USD 300.34 million)
- 2.1.2 Volume & Revenue – Global Totals
- 2.1.3 Key Market Highlights – Top Five Facts
- 2.2 Malic Acid Market Segmentation Snapshot
- 2.2.1 Market Split by Region – 2024 vs. 2032
- 2.3 Competitive Snapshot
- 2.3.1 Top 10 Players by Revenue Share – 2024
- 2.3.2 Top 10 Players by Volume Share – 2024
- 2.3.3 Recent Strategic Developments (18-Month Summary)
- 2.4 Key Investment Highlights & Strategic Conclusions
Chapter 3. Malic Acid Market Dynamics & Industry Analysis
- 3.1 Market Overview & Context
- 3.1.1 Malic Acid Market Position in the Broader Automotive Value Chain
- 3.1.2 OEM vs. Replacement Market Dynamics
- 3.1.3 Market Maturity & Development Stage by Region
- 3.2 Malic Acid Market Drivers
- 3.3 Malic Acid Market Restraints & Challenges
- 3.4 Malic Acid Market Opportunities
- 3.5 Porter's Five Forces Analysis
- 3.5.1 Threat of New Entrants
- 3.5.2 Bargaining Power of Suppliers
- 3.5.3 Bargaining Power of Buyers
- 3.5.4 Threat of Substitutes
- 3.5.5 Competitive Rivalry – Intensity Assessment
- 3.6 Malic Acid Value Chain Analysis
- 3.6.1 Upstream – Raw Material/Input Suppliers
- 3.6.1.1 Raw Material/Input 1
- 3.6.1.2 Raw Material/Input 2
- 3.6.1.3 Raw Material/Input 3
- 3.6.2 Midstream – Production/Manufacturing/Service Delivery
- 3.6.2.1 Production/Process Overview
- 3.6.2.2 Key Facility Locations & Capacity by Manufacturer
- 3.6.3 Downstream – Distribution & End Consumer
- 3.6.3.1 Primary Channel – B2B/OEM
- 3.6.3.2 Secondary Channels – Dealer, Retail, Online, Direct
- 3.6.4 Value Chain Profitability Analysis
- 3.6.1 Upstream – Raw Material/Input Suppliers
- 3.7 PESTEL Analysis
- 3.7.1 Political Factors
- 3.7.2 Economic Factors
- 3.7.3 Social Factors
- 3.7.4 Technological Factors
- 3.7.5 Environmental Factors
- 3.7.6 Legal Factors
- 3.8 Malic Acid Supply Chain Analysis
- 3.8.1 Raw Material/Input Supply Risk Assessment
- 3.8.2 Manufacturing Concentration Risk (Geographic Exposure)
- 3.8.3 Trade Disruption Impact Analysis
- 3.9 Regulatory & Policy Landscape
Note: The regulatory and policy landscape section covers regulations based on their applicability to the market, Malic Acid category, geography, and scope of the study. Only regulatory frameworks with a material impact on operations, compliance, trade, sustainability, or market access are analyzed in detail.
Chapter 4. Key Investment Pockets & Opportunity Analysis
- 4.1 Malic Acid Market Attractiveness Analysis
- 4.1.1 By Region – Investment Attractiveness Matrix (Volume × CAGR)
- 4.2 Absolute Revenue Growth Opportunity
- 4.2.1 By Region – Absolute USD Growth Through 2032
- 4.3 Incremental Volume Opportunity
- 4.3.1 By Region – Incremental Volume Through 2032
- 4.3.2 Segment – Incremental Volume
- 4.4 Emerging Submarket Opportunity Deep Dive (Subject to Applicability)
- 4.5 Emerging Market Opportunity Scorecards
- 4.5.1 United States
- 4.5.2 Europe
- 4.5.3 Asia
- 4.5.4 Middle East & Africa
Note: Emerging Market Opportunity Scorecards will be included based on relevance and strategic importance. Regions listed are indicative and may vary depending on data availability and market dynamics.
Chapter 5. Malic Acid Import-Export Analysis & Trade Flows
- 5.1 Global Trade Overview
- 5.1.1 Global Export Value by Country (2024)
- 5.1.2 Global Export Volume by Country (2024)
- 5.1.3 Global Import Value by Country (2024)
- 5.1.4 Global Import Volume by Country (2024)
- 5.1.5 Net Trade Balance by Country (2024)
- 5.2 Export Analysis – Segment
- 5.2.1 Type 1 (HS Code)
- 5.2.2 Type 2 (HS Code)
- 5.2.3 Type 3 (HS Code)
- 5.2.4 Type 4 (HS Code)
- 5.2.5 Type 5 (HS Code)
- 5.3 Import Analysis – Segment
- 5.3.1 Type 1 (HS Code)
- 5.3.2 Type 2 (HS Code)
- 5.3.3 Type 3 (HS Code)
- 5.3.4 Type 4 (HS Code)
- 5.3.5 Type 5 (HS Code)
- 5.4 Average Unit Trade Prices
- 5.4.1 Average Export Price – Segment & Country
- 5.4.2 Average Import Price – Segment & Source Country
- 5.4.3 Price Trends (2024)
- 5.5 Key Trade Route Analysis
- 5.5.1 Trade Route 1
- 5.5.2 Trade Route 2
- 5.5.3 Trade Route 3
- 5.5.4 Trade Route 4
- 5.5.5 Trade Route 5
- 5.6 Trade Policy Impact Assessment
- 5.6.1 US Anti-Dumping & Section 301 Tariffs
- 5.6.2 EU Customs Union Impact
- 5.6.3 Major Free Trade Agreements
- 5.6.4 USMCA Rules of Origin
Note: Trade policy analysis will be included only where relevant to the Malic Acid market.
Chapter 6. Competitive Landscape & Company Benchmarking
- 6.1 Malic Acid Market Concentration & Structure
- 6.1.1 Herfindahl-Hirschman Index (HHI) – vs. 2024
- 6.1.2 Tier 1, Tier 2 & Tier 3 Market Structure
- 6.1.3 Global, Regional & Local Player Dynamics
- 6.2 Malic Acid Market Share Analysis – 2024
- 6.2.1 Global Revenue Share by Company
- 6.2.2 Global Volume Share by Company
- 6.2.3 Regional Revenue Share
- 6.2.4 Market Share Evolution ( vs. 2024)
- 6.2.5 OEM Segment Share by Company
- 6.2.6 Replacement Segment Share by Company
- 6.3 Production/Delivery Capacity & Facility Analysis
- 6.3.1 Global Installed Capacity
- 6.3.2 Capacity Utilization Rates
- 6.3.3 Production/Output Volume
- 6.3.4 Facility Locations & Capacity Map
- 6.3.5 Planned Capacity Additions
- 6.4 Malic Acid Competitive Benchmarking Matrix
- 6.4.1 Revenue, Volume, CAGR & Profitability Comparison
- 6.4.2 Channel Revenue Mix
- 6.4.3 Geographic Revenue Exposure
- 6.4.4 R&D Intensity
- 6.4.5 Sustainability Maturity
- 6.5 Strategic Developments in Malic Acid (Last 24 Months)
- 6.5.1 Mergers, Acquisitions & Divestments
- 6.5.2 New Malic Acid Launches
- 6.5.3 Facility Expansions
- 6.5.4 Strategic Alliances, Joint Ventures & Partnerships
- 6.5.5 Distribution Expansion & Market Entry
- 6.5.6 Sustainability & ESG Initiatives
- 6.6 Competitive Strategy Mapping
- 6.6.1 Leader, Challenger, Follower & Niche Classification
- 6.6.2 Pricing Strategy Comparison
- 6.6.3 Channel Strategy Matrix
Note: Strategic developments are included based on their materiality and the availability of reliable information.
Chapter 7. Global Malic Acid Market – By Distribution Channel
- 7.1 Segment Overview
- 7.1.1 Volume & Revenue Split by Channel (2024 & 2032)
- 7.1.2 Channel Mix Evolution (2024-2032)
Chapter 8. Regional Market Analysis – Global Overview
- 8.1 Global Regional Overview
- 8.1.1 Regional Volume Share
- 8.1.2 Regional Revenue Share
- 8.1.3 Regional Volume by Region
- 8.1.4 Regional Revenue by Region
- 8.1.5 Regional Forecast Through 2032
- 8.2 Cross-Regional Segment Analysis
- 8.2.1 By Distribution Channel
- 8.2.2 By Brand/Price Tier
Chapter 9. North America Malic Acid Market
- 9.1 United States
- 9.2 Canada
- 9.3 Mexico
Chapter 10. Europe Malic Acid Market
- 10.1 Germany
- 10.2 France
- 10.3 Italy
- 10.4 United Kingdom
- 10.5 Spain
- 10.6 Poland
- 10.7 Russia
- 10.8 Netherlands
- 10.9 Belgium
- 10.10 Sweden
- 10.11 Denmark
- 10.12 Norway
- 10.13 Rest of Europe
Chapter 11. Asia Pacific Malic Acid Market
- 11.1 China
- 11.2 India
- 11.3 Japan
- 11.4 South Korea
- 11.5 Thailand
- 11.6 Indonesia
- 11.7 Vietnam
- 11.8 Malaysia
- 11.9 Australia
- 11.10 Rest of Asia Pacific
Chapter 12. Latin America Malic Acid Market
- 12.1 Brazil
- 12.2 Argentina
- 12.3 Colombia
- 12.4 Chile
- 12.5 Rest of Latin America
Chapter 13. Middle East Malic Acid Market
- 13.1 Saudi Arabia
- 13.2 United Arab Emirates
- 13.3 Turkey
- 13.4 Israel
- 13.5 Iran
- 13.6 Rest of the Middle East
Chapter 14. Africa Malic Acid Market
- 14.1 South Africa
- 14.2 Egypt
- 14.3 Nigeria
- 14.4 Morocco
- 14.5 Rest of Africa
Chapter 15. Malic Acid Company Profiles
- 15.1 [Company 01]
- 15.1.1 Company Overview
- 15.1.2 Key Management Personnel
- 15.1.3 Products & Services Portfolio
- 15.1.4 Financial Performance
- 15.1.5 Key Market Focus & Geographic Presence
- 15.1.6 Recent Developments & Strategic Initiatives
Note: The company profile list is preliminary and may change based on research findings, market developments, data availability, and client requirements.
Chapter 16. Appendices
- Appendix A – List of Abbreviations & Acronyms
- Appendix B – Industry Classification Code Reference – Full Series
- Appendix C – Production & Capacity Data Tables
- Appendix D – End-Use & Demand Base Tables
- Appendix E – Consumption & Replacement Rate Assumptions
- Appendix F – ASP Reference Tables
- Appendix G – Manufacturing & Facility Database
- Appendix H – Import-Export Data Tables
- Appendix I – Regulatory Summary Tables
- Appendix J – Primary Research Participant List (Anonymized)
- Appendix K – Primary Research Questionnaire Framework
- Appendix L – Data Sources & Bibliography
- Appendix M – Market Size Divergence & Source Comparison
Chapter 17. Research Methodology
- 17.1 Research Framework & Philosophy
- 17.2 Secondary Research – Sources, Hierarchy & Data Extraction
- 17.3 Data Modeling – Bottom-Up & Top-Down Market Sizing
- 17.4 Primary Research – Stakeholder Framework, LOI & Sample Sizes
- 17.5 Forecast Methodology – Regression, Scenario & Sensitivity Analysis
- 17.6 Quality Control – Four-Layer Validation Framework
- 17.7 Limitations & Standard Assumptions
- 17.8 Disclaimer
