
Market Overview:
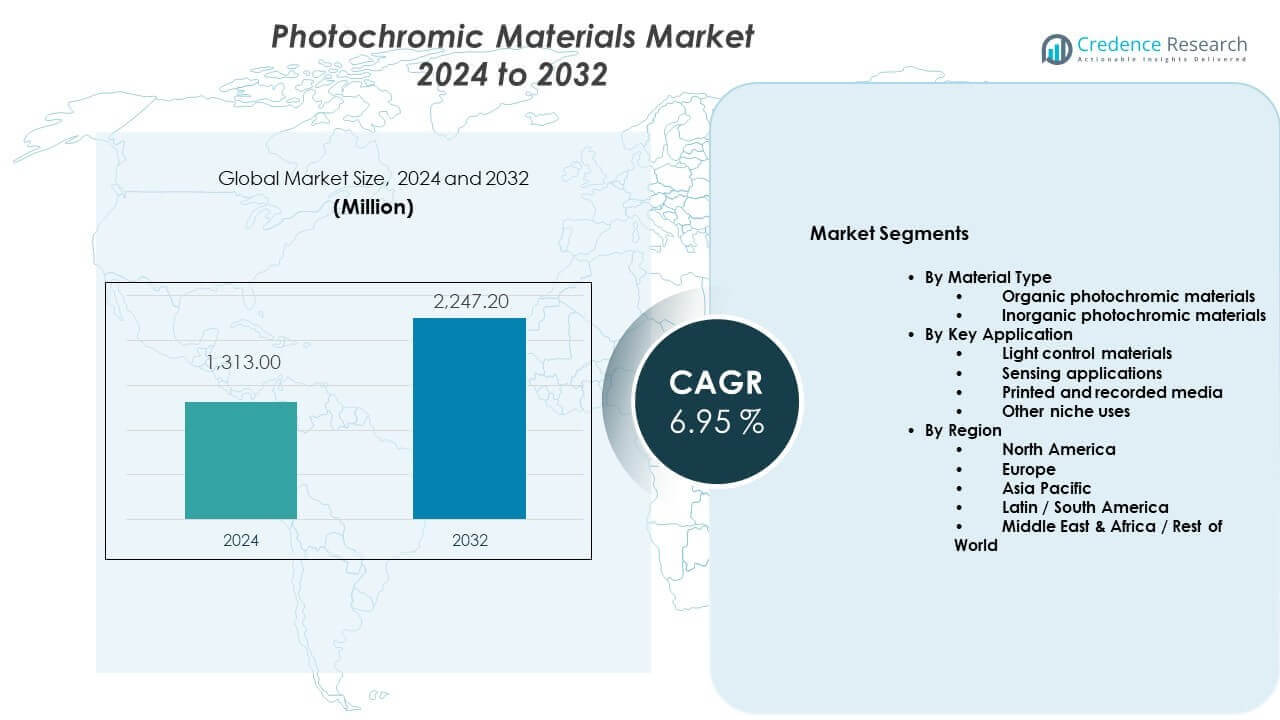
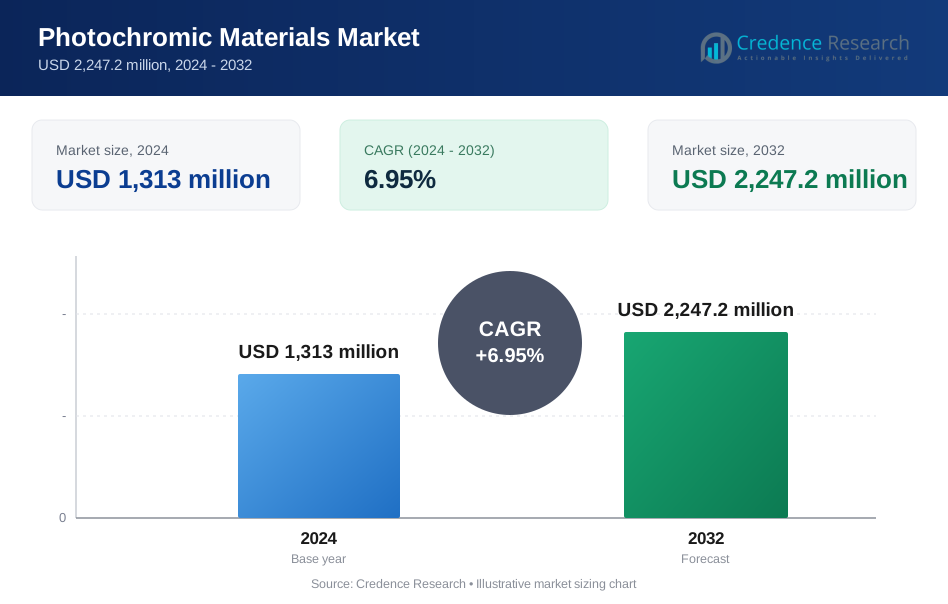
The Photochromic materials market is projected to grow from USD 1,313 million in 2024 to USD 2,247.2 million by 2032, with a compound annual growth rate of 6.95% from 2024 to 2032.
| REPORT ATTRIBUTE | DETAILS |
|---|---|
| Historical Period | 2020-2023 |
| Base Year | 2024 |
| Forecast Period | 2025-2032 |
| Photochromic Materials Market Size 2024 | USD 1,313 million |
| Photochromic Materials Market, CAGR | 6.95 % |
| Photochromic Materials Market Size 2032 | USD 2,247.2 million |
Market growth is driven by rising demand for adaptive light-responsive solutions. Eyewear brands adopt photochromic lenses for comfort and eye protection. Automotive producers integrate photochromic coatings in mirrors and sunroofs. Smart building trends raise use in energy-efficient windows. Advances in nanomaterials improve switching speed and lifespan. Industrial users prefer materials with stable performance under repeated UV exposure. Consumer awareness of UV protection further supports steady demand growth across applications.
North America and Europe lead the market due to strong eyewear brands and advanced construction standards. The United States, Germany, and France show high adoption in premium optical products. Asia Pacific is emerging rapidly, led by China, Japan, and South Korea. Expanding automotive output and urban construction support regional growth. Manufacturing scale and cost advantages attract global suppliers. Emerging markets benefit from rising disposable income and improving optical retail networks.
Market Insights:
- The market overview shows growth from USD 1,313 million in 2024 to USD 2,247.2 million by 2032, registering a 95% CAGR, driven by expanding optical and smart material applications.
- North America (32%), Asia Pacific (30%), and Europe (28%) lead regional demand due to strong eyewear adoption, advanced construction standards, and automotive integration.
- Asia Pacific stands as the fastest-growing region with a 30% share, supported by large-scale manufacturing, rising urban construction, and expanding automotive production in China, Japan, and South Korea.
- By application, light control materials account for nearly 62% share, supported by strong use in lenses, smart windows, and architectural glazing.
- By material type, organic photochromic materials hold about 58% share, favored for fast response, optical clarity, and design flexibility in consumer products.
Market Drivers:
Rising Demand For Adaptive Optical Solutions In Consumer Products
The Photochromic materials market benefits from strong demand for adaptive optical performance. Consumers prefer lenses that adjust automatically to changing light. Eyewear brands promote comfort, clarity, and UV protection features. Outdoor lifestyles increase frequent exposure to variable lighting. Medical optics adopt adaptive materials for vision support. Manufacturers improve darkening and fading speed. Retail acceptance improves through premium positioning. This driver supports broad consumer adoption.
- For instance, EssilorLuxottica’s Transitions® GEN S™ lenses, launched in 2024, achieve full fade-back indoors in under two minutes and block 100% UVA and UVB while filtering up to 86% of blue-violet light outdoors.
Expansion Of Smart Building And Energy Efficient Infrastructure Applications
The Photochromic materials market gains support from smart building adoption. Architects specify adaptive glazing for visual comfort control. Photochromic coatings reduce glare without mechanical systems. Energy efficiency targets favor passive light modulation. Commercial buildings seek materials that lower cooling stress. Urban projects adopt smart façade technologies. Suppliers align products with green building standards. This driver supports long-term construction demand.
- For instance, AGC Glass Europe has reported photochromic interlayer solutions used in architectural glazing that maintain optical performance after over 20,000 UV exposure cycles in durability testing.
Growing Automotive Integration Of Light Responsive Components
The Photochromic materials market sees growth from automotive integration. Vehicle makers use adaptive mirrors to reduce headlight glare. Sunroofs and displays benefit from light-sensitive coatings. Premium vehicles adopt comfort-focused technologies. Automotive safety standards support better driver visibility. Suppliers deliver durable materials for vibration conditions. OEM partnerships speed material qualification cycles. Automotive demand adds regional stability.
Advancements In Material Science And Functional Coating Technologies
The Photochromic materials market advances through material science progress. Researchers improve fatigue resistance under repeated UV exposure. Nanostructured compounds enhance clarity and response uniformity. Coating techniques improve adhesion on glass and polymers. Producers reduce response lag across temperature ranges. Improved stability expands industrial usability. Scalable synthesis supports commercial production. Innovation strengthens performance confidence.
Market Trends:
Shift Toward Customizable And Application Specific Photochromic Formulations
The Photochromic materials market trends toward tailored formulations. Manufacturers design materials for defined light ranges. End users request customized transition profiles. Lens makers prefer tunable color density. Industrial buyers demand predictable optical behavior. Customization improves product differentiation. R&D teams align chemistry with end-use needs. This trend supports value-added positioning.
- For instance, Mitsui Chemicals has developed organic photochromic dyes with response time variation below 5% across repeated switching cycles, supporting consistent lens performance.
Increased Use In Wearable Technology And Smart Consumer Devices
The Photochromic materials market expands into wearable technology. Smart glasses adopt adaptive tint features. Consumer electronics seek passive light modulation. Designers value thin and lightweight coatings. Battery-free adaptation improves device efficiency. Wearable comfort guides material selection. Brands explore visual enhancement features. This trend opens new application paths.
- For instance, LCR Hallcrest supplies photochromic films for wearable indicators that show distinct color change within seconds under UV exposure, maintaining repeatability across thousands of activation cycles.
Growing Preference For Sustainable And Low Impact Chemical Compositions
The Photochromic materials market aligns with sustainability goals. Manufacturers reduce hazardous solvent use. Customers prefer compliant material systems. Regulatory pressure shapes formulation choices. Bio-based components gain research focus. Sustainable chemistry improves brand trust. Supply chains emphasize responsible sourcing. This trend influences long-term development.
Integration Of Photochromic Effects With Multi-Functional Coatings
The Photochromic materials market adopts multifunctional coating systems. Coatings combine scratch resistance with optical adaptation. Anti-reflective features pair with photochromic response. Surface durability remains critical. Multi-layer designs improve product lifespan. Manufacturers target simplified application steps. End users prefer consolidated benefits. This trend improves system efficiency.
Market Challenges Analysis:
Performance Stability Limitations Under Extreme Environmental Conditions
The Photochromic materials market faces stability challenges. Temperature extremes affect color transition behavior. Repeated UV exposure reduces responsiveness over time. Humidity impacts coating adhesion performance. Outdoor applications demand consistent optical output. Quality control becomes critical during scale-up. Users expect uniform behavior across climates. These issues raise validation costs.
Cost And Manufacturing Complexity Across High Precision Applications
The Photochromic materials market encounters cost pressure. High-purity raw materials raise production expenses. Complex synthesis requires controlled environments. Yield variation affects supply consistency. Precision coating methods increase capital needs. Smaller manufacturers face entry barriers. Price sensitivity limits mass adoption. Cost control remains challenging.
Market Opportunities:
Expansion Across Emerging Economies With Growing Optical Consumption
The Photochromic materials market finds opportunity in emerging economies. Urban growth increases vision correction demand. Rising income supports premium eyewear adoption. Local manufacturing reduces supply risks. Retail expansion improves product access. Awareness raises UV protection usage. Regional brands seek differentiated features. These factors drive volume growth.
Adoption In Advanced Industrial And Defense Optical Systems
The Photochromic materials market offers potential in advanced optics. Defense systems require adaptive light control. Industrial sensors benefit from glare management. Aerospace values passive optical adaptation. High-reliability sectors demand robust performance. Long lifecycle needs favor advanced formulations. Partnerships enable technology transfer. This opportunity supports premium applications.
Market Segmentation Analysis:
By Material Type
Organic photochromic materials dominate commercial use due to fast color response and high optical clarity. These materials suit ophthalmic lenses and consumer optical products. Manufacturers favor organic variants for design flexibility and tunable performance. Inorganic photochromic materials support applications that require thermal stability and long service life. Glass-based systems use inorganic compounds for architectural and automotive glazing. The Photochromic materials market balances both types based on durability and response needs. It reflects varied performance priorities across end-use sectors.
By Key Application
Light control materials represent the primary application segment. Smart windows, lenses, and glazing systems rely on adaptive light modulation. This segment supports comfort, glare reduction, and visual protection. Sensing applications use photochromic behavior for optical sensors and security features. These systems require precise and repeatable color change. Printed and recorded media adopt photochromic inks for data marking and anti-counterfeit uses. Other niche uses include textiles, electronics, coatings, and films. These applications favor thin layers, stable response, and integration ease.
- For instance, QCR Solutions Corp. supplies photochromic pigments for security printing that maintain legible color contrast after more than 1,000 UV exposure cycles.
Segmentation:
By Material Type- Organic photochromic materials
- Inorganic photochromic materials
- Light control materials
- Sensing applications
- Printed and recorded media
- Other niche uses
- North America
- U.S.
- Canada
- Mexico
- Europe
- Germany
- France
- U.K.
- Italy
- Spain
- Rest of Europe
- Asia Pacific
- China
- Japan
- India
- South Korea
- South-east Asia
- Rest of Asia Pacific
- Latin America
- Brazil
- Argentina
- Rest of Latin America
- Middle East & Africa
- GCC Countries
- South Africa
- Rest of the Middle East and Africa
Regional Analysis:
North America
North America holds an estimated 32% market share in the Photochromic materials market. The region benefits from strong adoption of photochromic lenses and smart glazing solutions. The United States leads due to established eyewear brands and advanced construction standards. Automotive applications also support steady material demand. Research activity supports material performance improvement. Regulatory focus on UV protection strengthens product uptake. It maintains stable demand across consumer and industrial uses.
Europe
Europe accounts for nearly 28% market share and shows strong demand across optics and architecture. Germany, France, and Italy lead due to premium eyewear consumption. Sustainable building practices support adaptive glazing adoption. Automotive safety standards encourage photochromic mirror use. Manufacturers focus on quality and durability. The region values material compliance and optical precision. It sustains consistent demand across mature end-use sectors.
Asia Pacific, Latin America, and Middle East & Africa
Asia Pacific represents around 30% market share and shows the fastest expansion. China, Japan, and South Korea drive volume through manufacturing scale. Rising urban construction supports glazing demand. Automotive production also supports material usage. Latin America holds about 6% market share, led by growing optical retail networks. Middle East & Africa account for nearly 4% market share, supported by construction and infrastructure projects. It reflects gradual adoption across emerging economies.
Key Player Analysis:
- PPG Industries
- Tokuyama Corporation
- Mitsui Chemicals
- Milliken Chemical
- Essilor / Transitions Optical (EssilorLuxottica)
- Tianjin Forsheen Sunshine Technology
- Bloclo Technologies
- Yamada Chemical
- LCR Hallcrest
- QCR Solutions Corp.
Competitive Analysis:
The Photochromic materials market shows moderate concentration with a mix of chemical, optical, and specialty material firms. Leading players focus on proprietary formulations and performance reliability. Companies compete on response speed, durability, and optical clarity. Strategic alignment with eyewear and glazing manufacturers strengthens market position. Product differentiation supports premium pricing strategies. Regional production presence improves supply consistency. It reflects competition driven by technology depth and application reach.
Recent Developments:
- On November 12, 2025, Mitsui Chemicals announced a major facility expansion through SDC Technologies, which is relocating its headquarters to Rancho Santa Margarita, California. The new facility spans 124,000 square feet (approximately 11,500 square meters) and will significantly strengthen research and development functions as well as manufacturing capabilities. The relocation, scheduled for completion in October 2026, includes the establishment of a new application lab and product demonstration space to enhance technical support and customer collaboration. The facility will be equipped with solar panels to leverage renewable energy, covering the majority of electricity requirements.
- In September 2025, Tokuyama Corporation completed a significant strategic acquisition that marks an important expansion of its healthcare portfolio. The company finalized the acquisition of JSR Corporation's in vitro diagnostic and pharmaceutical materials businesses through a newly established subsidiary named Tokuyama Life Science Corporation. This strategic move, announced on April 22, 2025, and completed on October 1, 2025, demonstrates Tokuyama's commitment to strengthening its presence in the diagnostics and healthcare domain. While this acquisition primarily focuses on diagnostic systems, it represents the company's broader strategy to diversify its business beyond specialty chemicals into high-value healthcare solutions.
- Mitsui Chemicals has emerged as a major force in photochromic materials through multiple strategic initiatives spanning 2024 and 2025. In January 2024, the company successfully launched a new MR™ photochromic lens material production plant in the United States, representing a significant capacity expansion to meet growing global demand for high-refractive-index ophthalmic lenses.
- During 2024, Mitsui Chemicals took a transformative step by acquiring photochromic dye technology from James Robinson Speciality Ingredients in the United Kingdom. This acquisition substantially strengthened the company's capabilities to develop high-performance photochromic lens materials and coating systems, enabling the creation of differentiated products by combining the acquired photochromic dyes with Mitsui's base lens materials, coatings, and existing technological strengths.
Report Coverage:
The research report offers an in-depth analysis based on material type and key application segments. It details leading market players, providing an overview of their business, product offerings, investments, revenue streams, and key applications. Additionally, the report includes insights into the competitive environment, SWOT analysis, current market trends, as well as the primary drivers and constraints. Furthermore, it discusses various factors that have driven market expansion in recent years. The report also explores market dynamics, regulatory scenarios, and technological advancements that are shaping the industry. It assesses the impact of external factors and global economic changes on market growth. Lastly, it provides strategic recommendations for new entrants and established companies to navigate the complexities of the market.
Future Outlook:
- Demand will rise across premium eyewear applications.
- Smart building adoption will support glazing usage.
- Automotive integration will expand beyond mirrors.
- Material customization will gain importance.
- Sustainability focus will influence formulation choices.
- Emerging economies will add volume demand.
- Wearable devices will open new use cases.
- Coating durability will remain a key differentiator.
- Partnerships will shape innovation pipelines.
- Optical performance standards will tighten.
Request a Free Sample
Fill in your details and we'll send you a free sample report.
- Sample data tables & charts
- Research methodology
Need a Custom Version of This Report?
Tailor the scope, geography, or segments to your exact requirements.
- Custom geography or segment scope
- Direct access to our analyst team
Frequently Asked Questions
What is the current market size for Photochromic materials market, and what is its projected size in 2032?
At what Compound Annual Growth Rate is the Photochromic materials market projected to grow between 2025 and 2032?
Which Photochromic materials market segment held the largest share in 2024?
What are the primary factors fueling the growth of the Photochromic materials market?
Who are the leading companies in the Photochromic materials market?
Which region commanded the largest share of the Photochromic materials market in 2024?
Table of Content
Chapter 1. Report Introduction
- 1.1 Report Description & Purpose
- 1.1.1 Report Title & Market Definition
- 1.1.2 Unique Selling Propositions (USP) & Key Differentiators
- 1.1.3 Value Proposition for Stakeholders
- 1.2 Research Objectives
- 1.2.1 Market Sizing Objectives (Volume & Revenue) (Volume Where Applicable)
- 1.2.2 Segmentation Objectives
- 1.2.3 Competitive Intelligence Objectives
- 1.2.4 Forecast & Scenario Objectives
- 1.3 Report Scope
- 1.3.1 Photochromic Materials Scope – Segments & Subsegments Covered
- 1.3.2 Geographic Scope – Regions & Countries Covered
- 1.3.3 Historical Period, Base Year & Forecast Period (2024; forecast to 2032)
- 1.3.4 Inclusions & Exclusions
- 1.4 Industry Classification & Applicable Codes
- 1.5 Currency, Measurement Units & Valuation Basis
- 1.6 Target Stakeholders
- 1.7 Limitations & Assumptions
Chapter 2. Executive Summary
- 2.1 Global Photochromic Materials Market Snapshot
- 2.1.1 Market Size – Historical (2024) & Forecast (2024-2032) (2024: USD 1,313 million → 2032: USD 2,247.2 million)
- 2.1.2 Volume & Revenue – Global Totals (Volume Where Applicable)
- 2.1.3 Key Market Highlights – Top Five Facts
- 2.2 Photochromic Materials Market Segmentation Snapshot
- 2.2.1 Market Split by Region – 2024 vs. 2032
- 2.3 Competitive Snapshot
- 2.3.1 Top 10 Players by Revenue Share – 2024
- 2.3.2 Top 10 Players by Volume Share – 2024 (Volume Where Applicable)
- 2.3.3 Recent Strategic Developments (18-Month Summary)
- 2.4 Key Investment Highlights & Strategic Conclusions
Chapter 3. Photochromic Materials Market Dynamics & Industry Analysis
- 3.1 Market Overview & Context
- 3.1.1 Photochromic Materials Market Position in the Broader Industry Value Chain
- 3.1.2 Demand Structure & Purchasing Dynamics
- 3.1.3 Market Maturity & Development Stage by Region
- 3.2 Photochromic Materials Market Drivers
- 3.3 Photochromic Materials Market Restraints & Challenges
- 3.4 Photochromic Materials Market Opportunities
- 3.5 Porter's Five Forces Analysis
- 3.5.1 Threat of New Entrants
- 3.5.2 Bargaining Power of Suppliers
- 3.5.3 Bargaining Power of Buyers
- 3.5.4 Threat of Substitutes
- 3.5.5 Competitive Rivalry – Intensity Assessment
- 3.6 Photochromic Materials Value Chain Analysis
- 3.6.1 Upstream – Key Inputs, Resources & Suppliers
- 3.6.1.1 Key Input/Resource 1
- 3.6.1.2 Key Input/Resource 2
- 3.6.1.3 Key Input/Resource 3
- 3.6.2 Midstream – Core Operations & Value Creation
- 3.6.2.1 Operating Model & Process Overview
- 3.6.2.2 Key Operating Locations & Capabilities by Company
- 3.6.3 Downstream – Market Channels & End Users
- 3.6.3.1 Direct Sales & Customer Engagement Channels
- 3.6.3.2 Indirect Sales, Intermediaries & Partner Channels
- 3.6.4 Value Chain Profitability Analysis
- 3.6.1 Upstream – Key Inputs, Resources & Suppliers
- 3.7 PESTEL Analysis
- 3.7.1 Political Factors
- 3.7.2 Economic Factors
- 3.7.3 Social Factors
- 3.7.4 Technological Factors
- 3.7.5 Environmental Factors
- 3.7.6 Legal Factors
- 3.8 Photochromic Materials Supply Chain Analysis
- 3.8.1 Critical Input & Resource Availability Risk Assessment
- 3.8.2 Supplier & Operational Concentration Risk (Geographic Exposure)
- 3.8.3 Supply & Service Disruption Impact Analysis
- 3.9 Regulatory & Policy Landscape
Note: The regulatory and policy landscape section covers regulations based on their applicability to the market, Photochromic Materials category, geography, and scope of the study. Only regulatory frameworks with a material impact on operations, compliance, trade, sustainability, or market access are analyzed in detail.
Chapter 4. Key Investment Pockets & Opportunity Analysis
- 4.1 Photochromic Materials Market Attractiveness Analysis
- 4.1.1 By Region – Investment Attractiveness Matrix (Market Size × CAGR)
- 4.2 Absolute Revenue Growth Opportunity
- 4.2.1 By Region – Absolute Revenue Growth Through 2032
- 4.3 Incremental Demand Opportunity
- 4.3.1 By Region – Incremental Demand Through 2032
- 4.3.2 Segment – Incremental Demand
- 4.4 Emerging Submarket Opportunity Deep Dive (Subject to Applicability)
- 4.5 Priority Market Opportunity Scorecards
- 4.5.1 United States
- 4.5.2 Europe
- 4.5.3 Asia
- 4.5.4 Middle East & Africa
Note: Priority market opportunity scorecards reflect the geographic scope and strategic relevance of the study. Listed markets are indicative and may be adapted to the industry.
Chapter 5. Photochromic Materials Cross-Border Trade & Market Access Analysis
- 5.1 International Trade & Cross-Border Activity Overview
- 5.1.1 Global Export Value by Country (2024)
- 5.1.2 Global Export Volume by Country (2024) (Volume Where Applicable)
- 5.1.3 Global Import Value by Country (2024)
- 5.1.4 Global Import Volume by Country (2024) (Volume Where Applicable)
- 5.1.5 Net Trade Balance by Country (2024)
- 5.2 Export Analysis – Segment
- 5.2.1 Category 1 (Applicable Classification Code)
- 5.2.2 Category 2 (Applicable Classification Code)
- 5.2.3 Category 3 (Applicable Classification Code)
- 5.2.4 Category 4 (Applicable Classification Code)
- 5.2.5 Category 5 (Applicable Classification Code)
- 5.3 Import Analysis – Segment
- 5.3.1 Category 1 (Applicable Classification Code)
- 5.3.2 Category 2 (Applicable Classification Code)
- 5.3.3 Category 3 (Applicable Classification Code)
- 5.3.4 Category 4 (Applicable Classification Code)
- 5.3.5 Category 5 (Applicable Classification Code)
- 5.4 Cross-Border Pricing & Transaction Benchmarks
- 5.4.1 Export Pricing – Segment & Country
- 5.4.2 Import Pricing – Segment & Source Country
- 5.4.3 Price Trends (2024)
- 5.5 Key Cross-Border Trade & Delivery Routes
- 5.5.1 Cross-Border Trade/Delivery Route 1
- 5.5.2 Cross-Border Trade/Delivery Route 2
- 5.5.3 Cross-Border Trade/Delivery Route 3
- 5.5.4 Cross-Border Trade/Delivery Route 4
- 5.5.5 Cross-Border Trade/Delivery Route 5
- 5.6 Trade Policy & Market Access Impact Assessment
- 5.6.1 Tariff & Non-Tariff Barriers
- 5.6.2 Regional Trade & Economic Integration Frameworks
- 5.6.3 Bilateral & Multilateral Trade Agreements
- 5.6.4 Cross-Border Operating, Licensing & Localization Requirements
Note: This chapter applies where cross-border trade or delivery is relevant to Photochromic Materials. Goods, services, and digital offerings are assessed using applicable classifications and transaction measures. Import-export volumes, trade balances, and route analyses are included only where meaningful to the market.
Chapter 6. Competitive Landscape & Company Benchmarking
- 6.1 Photochromic Materials Market Concentration & Structure
- 6.1.1 Herfindahl-Hirschman Index (HHI) – vs. 2024
- 6.1.2 Leading, Mid-Sized & Emerging Player Structure
- 6.1.3 Global, Regional & Local Player Dynamics
- 6.2 Photochromic Materials Market Share Analysis – 2024
- 6.2.1 Global Revenue Share by Company
- 6.2.2 Global Volume Share by Company (Volume Where Applicable)
- 6.2.3 Regional Revenue Share
- 6.2.4 Market Share Evolution ( vs. 2024)
- 6.2.5 Company Market Share by Key Segment
- 6.2.6 Company Market Share by Customer Group
- 6.3 Operating Scale, Capacity & Infrastructure Analysis
- 6.3.1 Global Operating Scale & Supply Capacity
- 6.3.2 Resource Utilization & Operating Efficiency
- 6.3.3 Output, Service Delivery & Activity Metrics
- 6.3.4 Operating Footprint & Infrastructure Map
- 6.3.5 Planned Operational & Capacity Expansion
- 6.4 Photochromic Materials Competitive Benchmarking Matrix
- 6.4.1 Revenue, Growth, Profitability & Operating Metric Comparison
- 6.4.2 Channel Revenue Mix
- 6.4.3 Geographic Revenue Exposure
- 6.4.4 R&D Intensity
- 6.4.5 Sustainability Maturity
- 6.5 Strategic Developments in Photochromic Materials (Last 24 Months)
- 6.5.1 Mergers, Acquisitions & Divestments
- 6.5.2 New Products, Services & Solutions in Photochromic Materials
- 6.5.3 Operational & Infrastructure Expansions
- 6.5.4 Strategic Alliances, Joint Ventures & Partnerships
- 6.5.5 Distribution Expansion & Market Entry
- 6.5.6 Sustainability & ESG Initiatives
- 6.6 Competitive Strategy Mapping
- 6.6.1 Leader, Challenger, Follower & Niche Classification
- 6.6.2 Pricing Strategy Comparison
- 6.6.3 Channel Strategy Matrix
Note: Strategic developments are included based on their materiality and the availability of reliable information.
Chapter 7. Global Photochromic Materials Market – By Sales & Delivery Channel
- 7.1 Segment Overview
- 7.1.1 Volume & Revenue Split by Channel (2024 & 2032) (Volume Where Applicable)
- 7.1.2 Channel Mix Evolution (2024-2032)
Chapter 8. Regional Market Analysis – Global Overview
- 8.1 Global Regional Overview
- 8.1.1 Regional Volume Share (Volume Where Applicable)
- 8.1.2 Regional Revenue Share
- 8.1.3 Regional Volume by Region (Volume Where Applicable)
- 8.1.4 Regional Revenue by Region
- 8.1.5 Regional Forecast Through 2032
- 8.2 Cross-Regional Segment Analysis
- 8.2.1 By Sales & Delivery Channel
- 8.2.2 By Competitive Positioning & Price Tier
Chapter 9. North America Photochromic Materials Market
- 9.1 United States
- 9.2 Canada
- 9.3 Mexico
Chapter 10. Europe Photochromic Materials Market
- 10.1 Germany
- 10.2 France
- 10.3 Italy
- 10.4 United Kingdom
- 10.5 Spain
- 10.6 Poland
- 10.7 Russia
- 10.8 Netherlands
- 10.9 Belgium
- 10.10 Sweden
- 10.11 Denmark
- 10.12 Norway
- 10.13 Rest of Europe
Chapter 11. Asia Pacific Photochromic Materials Market
- 11.1 China
- 11.2 India
- 11.3 Japan
- 11.4 South Korea
- 11.5 Thailand
- 11.6 Indonesia
- 11.7 Vietnam
- 11.8 Malaysia
- 11.9 Australia
- 11.10 Rest of Asia Pacific
Chapter 12. Latin America Photochromic Materials Market
- 12.1 Brazil
- 12.2 Argentina
- 12.3 Colombia
- 12.4 Chile
- 12.5 Rest of Latin America
Chapter 13. Middle East Photochromic Materials Market
- 13.1 Saudi Arabia
- 13.2 United Arab Emirates
- 13.3 Turkey
- 13.4 Israel
- 13.5 Iran
- 13.6 Rest of the Middle East
Chapter 14. Africa Photochromic Materials Market
- 14.1 South Africa
- 14.2 Egypt
- 14.3 Nigeria
- 14.4 Morocco
- 14.5 Rest of Africa
Chapter 15. Photochromic Materials Company Profiles
- 15.1 [Company 01]
- 15.1.1 Company Overview
- 15.1.2 Key Management Personnel
- 15.1.3 Products & Services Portfolio
- 15.1.4 Financial Performance
- 15.1.5 Key Market Focus & Geographic Presence
- 15.1.6 Recent Developments & Strategic Initiatives
Note: The company profile list is preliminary and may change based on research findings, market developments, data availability, and client requirements.
Chapter 16. Appendices
- Appendix A – List of Abbreviations & Acronyms
- Appendix B – Industry Classification Code Reference – Full Series
- Appendix C – Supply, Output & Operating Capacity Data Tables
- Appendix D – End-Use & Demand Base Tables
- Appendix E – Demand, Adoption & Usage Assumptions
- Appendix F – Pricing & Revenue Metric Reference Tables
- Appendix G – Company Operations & Infrastructure Database
- Appendix H – Cross-Border Trade & Activity Data Tables (Where Applicable)
- Appendix I – Regulatory Summary Tables
- Appendix J – Primary Research Participant List (Anonymized)
- Appendix K – Primary Research Questionnaire Framework
- Appendix L – Data Sources & Bibliography
- Appendix M – Market Size Divergence & Source Comparison
Chapter 17. Research Methodology
- 17.1 Research Framework & Philosophy
- 17.2 Secondary Research – Sources, Hierarchy & Data Extraction
- 17.3 Data Modeling – Bottom-Up & Top-Down Market Sizing
- 17.4 Primary Research – Stakeholder Framework, LOI & Sample Sizes
- 17.5 Forecast Methodology – Regression, Scenario & Sensitivity Analysis
- 17.6 Quality Control – Four-Layer Validation Framework
- 17.7 Limitations & Standard Assumptions
- 17.8 Disclaimer
