
Market Overview
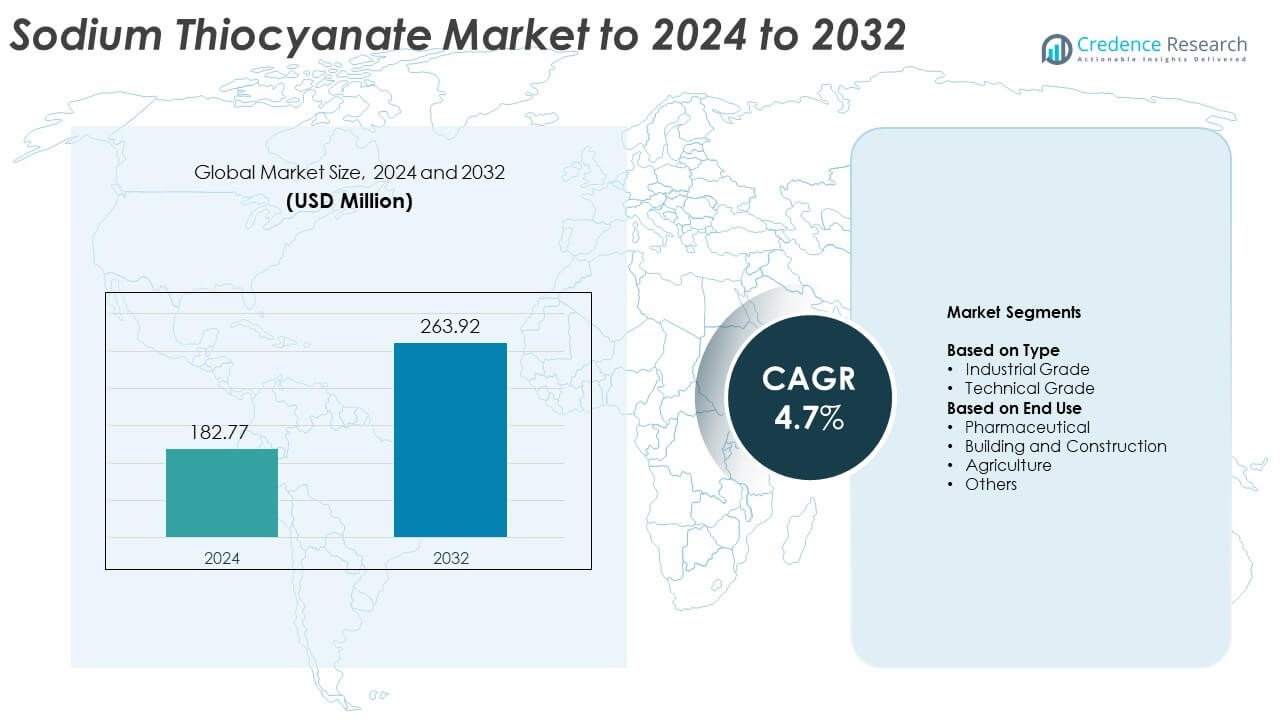
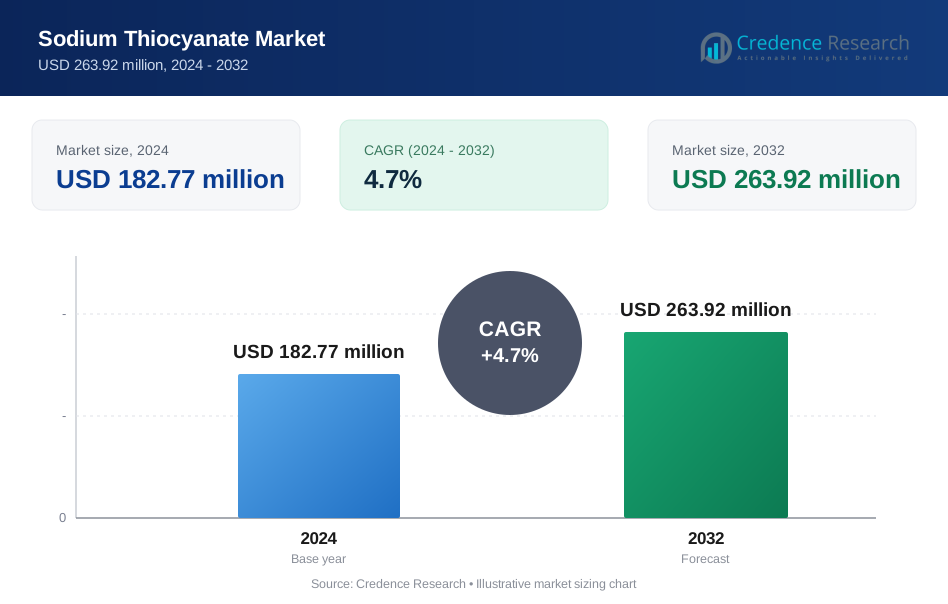
Sodium Thiocyanate Market size was valued at USD 182.77 million in 2024 and is anticipated to reach USD 263.92 million by 2032, at a CAGR of 4.7% during the forecast period.
| REPORT ATTRIBUTE | DETAILS |
|---|---|
| Historical Period | 2020-2023 |
| Base Year | 2024 |
| Forecast Period | 2025-2032 |
| Sodium Thiocyanate Market Size 2024 | USD 182.77 Million |
| Sodium Thiocyanate Market , CAGR | 4.7% |
| Sodium Thiocyanate Market Size 2032 | USD 263.92 Million |
The Sodium Thiocyanate Market is shaped by several established manufacturers that focus on high-purity production, stable supply, and strong integration with pharmaceutical, textile, and construction industries. These companies compete through expanded capacities, improved refining systems, and long-term contracts with major end-use sectors. Asia Pacific leads the global market with about 34% share in 2024, supported by large-scale chemical manufacturing and strong textile and polymer production. North America follows with nearly 32% share due to advanced pharmaceutical operations and consistent demand for reagent-grade material. Europe holds around 28% share, driven by regulated chemical processing and steady industrial use.
Market Insights
- Sodium Thiocyanate Market reached USD 182.77 million in 2024 and is projected to hit USD 263.92 million by 2032 at a CAGR of 4.7%.
- Growth is driven by rising demand from pharmaceuticals, which hold 39% share due to strong use in reagents and formulations.
- Trends include increasing adoption of high-purity grades and modernization of chemical processing across major producing countries.
- Competition intensifies as global and regional suppliers expand capacity and upgrade purification technology to meet stricter quality requirements.
- Asia Pacific leads with 34% share, followed by North America at 32% and Europe at 28%, while industrial grade dominates the type segment with 71% share.
Market Segmentation Analysis:
By Type
Industrial grade leads this segment with about 71% share in 2024 due to its wide use across chemical processing, textile dyeing, and metal treatment activities. Demand remains steady because industrial users rely on high-purity sodium thiocyanate for polymer production, plating solutions, and specialty chemicals. Technical grade grows at a moderate pace as smaller manufacturers adopt it for low-intensity applications. Growth across both grades is supported by rising synthetic fiber production and expansion of industrial operations in developing economies.
- For instance, Sinopec's Baling Chemical Fiber Plant has a significant caprolactam production capacity, which is the raw material for nylon-6 production. The plant has developed process technologies for 200,000 tons per year of caprolactam and a total caprolactam production scale for Sinopec was 900,000 tons annually as of the end of 2019
By End Use
The pharmaceutical sector dominates this segment with nearly 39% share in 2024, driven by rising demand for sodium thiocyanate in drug formulation, diagnostic reagents, and therapeutic research. Building and construction follows as the compound is used in accelerating admixtures for concrete. Agriculture records steady use in pest control and soil treatment, while other industries adopt it for laboratory reagents and specialty applications. Growth accelerates due to expanding pharmaceutical manufacturing capacity and ongoing material innovation across end-use sectors.
- For instance, Thermo Fisher Scientific operates through a global network that includes more than 60 main pharma services sites across over 25 countries.
Key Growth Drivers
Rising Demand from Pharmaceutical Manufacturing
Pharmaceutical companies drive strong consumption of sodium thiocyanate because the compound supports active ingredient synthesis, diagnostic reagent production, and formulation research. Expansion of drug manufacturing facilities in Asia and Europe strengthens industrial uptake. The shift toward advanced analytical testing also boosts demand for high-purity grades. Growing investment in biotechnology and broader adoption of reagent-based diagnostic workflows further lift consumption, making pharmaceuticals the most influential growth driver in the market.
- For instance, Novartis operates in more than 30 production sites worldwide and manufactured over 20 billion treatments in 2024.
Expansion of Textile and Polymer Production
The textile and polymer industries rely on sodium thiocyanate for fiber processing, dye stabilization, and specialty polymer synthesis. Rapid growth in synthetic fiber production across emerging economies increases the need for consistent chemical supply. Manufacturers expand capacity to serve rising apparel exports and industrial textile applications. Improved processing efficiencies and adoption of modern spinning technologies also support steady consumption. This sector’s scale and stable usage patterns make it a major driver of market growth.
- For instance, Indorama Ventures produced 14.04 million tons of polyester, PET, and related synthetic fibers in its latest reporting year (2024).
Growing Use in Construction Chemicals
Demand rises in construction due to the compound’s role in accelerating admixtures and performance-enhancing formulations. Infrastructure development in developing regions lifts consumption as builders seek faster setting times and improved concrete durability. Chemical suppliers integrate sodium thiocyanate into advanced construction blends to enhance productivity on large projects. Rising investments in transportation, housing, and commercial infrastructure keep this segment growing, positioning construction as a key driver of long-term market expansion.
Key Trends and Opportunities
Shift Toward Higher-Purity and Specialty Grades
Manufacturers focus on producing higher-purity sodium thiocyanate to meet stricter quality needs in pharmaceuticals, polymers, and laboratory applications. This trend opens opportunities for suppliers capable of offering premium grades. Companies strengthen purification processes and expand their analytical capabilities to secure contracts in regulated industries. Growing demand for cleaner chemical inputs and trace-level control creates room for specialized products with enhanced performance and reduced impurities.
- For instance, the Honeywell Research Chemicals brand, which includes sub-brands like Fluka, Riedel-de Haën, and Burdick & Jackson, offers over 10,000 different high-purity research chemicals and reagents through its extensive global catalog and distributor networks
Adoption of Sustainable and Energy-Efficient Production Methods
Producers explore cleaner manufacturing pathways to reduce emissions and cut waste generation. Adoption of energy-efficient reactors, improved heat-recovery systems, and optimized reagent use creates opportunities for cost advantages and regulatory compliance. Sustainability goals in end-use industries encourage uptake of responsibly produced chemicals. This trend supports long-term investments in modernized facilities and opens new avenues for suppliers with strong environmental performance.
- For instance, Clariant achieved a 29% reduction in its total scope 1 & 2 greenhouse gas emissions from a 2019 baseline by the end of 2023 through various initiatives including using green electricity and replacing coal with natural gas and sustainable biomass at various sites.
Key Challenges
Volatility in Raw Material Availability
Fluctuations in raw material supply disrupt production consistency and pricing stability. Producers depend on reliable access to ammonia, sulfur compounds, and related inputs, making the market sensitive to industrial outages and trade restrictions. Interruptions in global supply chains raise procurement costs and reduce profit margins. These challenges force manufacturers to diversify sourcing strategies and maintain larger inventory buffers, increasing operational complexity.
Stringent Environmental and Safety Regulations
Regulatory pressure increases as authorities tighten standards on chemical handling, emissions, and waste disposal. Compliance requires costly upgrades to treatment systems, monitoring tools, and safety protocols. Smaller manufacturers face difficulties in meeting evolving regulatory expectations, limiting their competitiveness. As environmental enforcement strengthens worldwide, operational costs rise and plant expansions require longer approval timelines, posing a persistent challenge for the market.
Regional Analysis
North America North America holds about 32% share of the Sodium Thiocyanate Market in 2024, supported by strong pharmaceutical production and advanced chemical manufacturing. Growth remains steady as the region expands diagnostic reagent use and invests in high-purity chemical processing. The United States leads due to large-scale drug development, while Canada contributes through rising polymer and research-grade chemical demand. Regulatory focus on quality drives suppliers to improve refining processes and ensure consistent purity. Expanding life sciences research and stable industrial applications keep North America a dominant and resilient regional market.
Europe
Europe accounts for nearly 28% share of the Sodium Thiocyanate Market in 2024, driven by robust textile processing, pharmaceutical formulation, and specialty chemical production. Germany, France, and the United Kingdom lead consumption due to strong industrial activity and regulated chemical standards. Demand stays stable as manufacturers adopt high-grade sodium thiocyanate for fibers, polymers, and concrete additives. Sustainability goals push producers to upgrade plants and reduce waste. Continued infrastructure renovation and expansion of advanced material research strengthen Europe’s position as a key regional market.
Asia Pacific
Asia Pacific holds the largest share at about 34% in 2024, driven by expanding textile manufacturing, high-volume polymer production, and growing pharmaceutical capacity. China and India lead due to large-scale industrial operations and rising investments in chemical intermediates. Rapid construction growth also boosts demand for admixture components. Lower manufacturing costs and expanding export activity make the region a global supply hub. Improvements in chemical purification and adoption of automation increase production efficiency, reinforcing Asia Pacific’s dominance in the global Sodium Thiocyanate Market.
Latin America
Latin America captures around 4% share of the Sodium Thiocyanate Market in 2024, supported by moderate demand from agriculture, construction, and chemical processing. Brazil and Mexico drive consumption as industrialization expands and regional manufacturers adopt sodium thiocyanate for concrete additives, crop applications, and laboratory reagents. Growth remains gradual due to limited high-purity production facilities. However, rising investment in pharmaceutical packaging and agrochemical formulations offers new opportunities. Strengthening regional trade networks helps improve product availability and reduce procurement delays, supporting steady market development.
Middle East and Africa
Middle East and Africa represent nearly 2% share of the Sodium Thiocyanate Market in 2024, with demand driven by construction projects, mining chemicals, and emerging pharmaceutical activities. Gulf countries support consumption through infrastructure expansion, while South Africa contributes through industrial chemical applications. Growth remains modest because of limited regional manufacturing capacity and heavy reliance on imports. However, rising investment in concrete admixtures and growing interest in localized chemical production create future opportunities. Improved logistics and industrial diversification efforts gradually strengthen the region’s market footprint.
Market Segmentations:
By Type
- Industrial Grade
- Technical Grade
By End Use
- Pharmaceutical
- Building and Construction
- Agriculture
- Others
By Geography
- North America
- U.S.
- Canada
- Mexico
- Europe
- Germany
- France
- U.K.
- Italy
- Spain
- Rest of Europe
- Asia Pacific
- China
- Japan
- India
- South Korea
- South-east Asia
- Rest of Asia Pacific
- Latin America
- Brazil
- Argentina
- Rest of Latin America
- Middle East & Africa
- GCC Countries
- South Africa
- Rest of the Middle East and Africa
Competitive Landscape
The competitive landscape of the Sodium Thiocyanate Market includes Honeywell, Ronas Chemical, Hebei Chengxin, Dongsheng Chemical, Jiaozuo Henghua Chemical, Triveni Chemicals, Shandong Tiancheng Chemical, Anhui Shuguang Chemical, and Henan Province Tianshui Chemical in the first line. The market features a mix of global producers and regional suppliers that focus on capacity expansion, cost optimization, and product purity enhancement. Most companies invest in improved chemical processing technologies to meet rising demand from pharmaceuticals, textiles, and construction applications. Producers emphasize reliable raw material sourcing and upgraded purification systems to strengthen consistency and compliance. Strategic partnerships with downstream industries help stabilize long-term supply contracts and support market penetration. Growing interest in high-purity and specialty-grade sodium thiocyanate encourages firms to modernize facilities and adopt advanced quality-control systems. Competitive strength increasingly depends on production efficiency, environmental compliance, and the ability to serve diverse industrial requirements across global markets.
Key Player Analysis
- Honeywell
- Ronas Chemical
- Hebei Chengxin
- Dongsheng Chemical
- Jiaozuo Henghua Chemical
- Triveni Chemicals
- Shandong Tiancheng Chemical
- Anhui Shuguang Chemical
- Henan Province Tianshui Chemical
Recent Developments
- In 2025, Ronas Chemical continued its operations as a significant manufacturer, supporting the expanding use of sodium thiocyanate in various chemical formulations and laboratory reagents.
- In 2024, Honeywell announced it will spin off its Advanced Materials business, which includes specialty and research-grade chemicals like sodium thiocyanate, into a separate U.S.-listed company by late 2025/early 2026 to streamline focus and sharpen investment for lab reagents.
- In 2023, Triveni Chemicals continued to be an active supplier of various industrial chemicals, including sodium thiocyanate, within the Indian market.
Report Coverage
- The research report offers an in-depth analysis based on Type, End-Use and Geography. It details leading market players, providing an overview of their business, product offerings, investments, revenue streams, and key applications. Additionally, the report includes insights into the competitive environment, SWOT analysis, current market trends, as well as the primary drivers and constraints. Furthermore, it discusses various factors that have driven market expansion in recent years. The report also explores market dynamics, regulatory scenarios, and technological advancements that are shaping the industry. It assesses the impact of external factors and global economic changes on market growth. Lastly, it provides strategic recommendations for new entrants and established companies to navigate the complexities of the market.
- Future Outlook
- The market will grow steadily as pharmaceutical manufacturing expands worldwide.
- Demand will rise in textile and polymer production due to higher synthetic fiber output.
- Construction chemicals will use more sodium thiocyanate for faster-setting admixtures.
- Producers will upgrade plants to deliver higher-purity and specialty-grade material.
- Sustainability goals will push manufacturers toward cleaner and energy-efficient processes.
- Asia Pacific will strengthen its role as the leading production and consumption hub.
- Supply chains will become more localized to reduce raw material and import risks.
- Research applications will expand as labs adopt advanced reagent-based testing.
- Regulatory compliance will shape investments in safety, waste treatment, and monitoring.
- New opportunities will emerge in niche sectors such as electronics chemicals and performance materials.
Request a Free Sample
Fill in your details and we'll send you a free sample report.
- Sample data tables & charts
- Research methodology
Need a Custom Version of This Report?
Tailor the scope, geography, or segments to your exact requirements.
- Custom geography or segment scope
- Direct access to our analyst team
Frequently Asked Questions
What is the current market size for Sodium Thiocyanate Market, and what is its projected size in 2032?
At what Compound Annual Growth Rate is the Sodium Thiocyanate Market projected to grow between 2025 and 2032?
Which Sodium Thiocyanate Market segment held the largest share in 2024?
What are the primary factors fueling the growth of the Sodium Thiocyanate Market?
Who are the leading companies in the Sodium Thiocyanate Market?
Which region commanded the largest share of the Sodium Thiocyanate Market in 2024?
Table of Content
Chapter 1. Report Introduction
- 1.1 Report Description & Purpose
- 1.1.1 Report Title & Market Definition
- 1.1.2 Unique Selling Propositions (USP) & Key Differentiators
- 1.1.3 Value Proposition for Stakeholders
- 1.2 Research Objectives
- 1.2.1 Market Sizing Objectives (Volume & Revenue) (Volume Where Applicable)
- 1.2.2 Segmentation Objectives
- 1.2.3 Competitive Intelligence Objectives
- 1.2.4 Forecast & Scenario Objectives
- 1.3 Report Scope
- 1.3.1 Sodium Thiocyanate Scope – Segments & Subsegments Covered
- 1.3.2 Geographic Scope – Regions & Countries Covered
- 1.3.3 Historical Period, Base Year & Forecast Period (2024; forecast to 2032)
- 1.3.4 Inclusions & Exclusions
- 1.4 Industry Classification & Applicable Codes
- 1.5 Currency, Measurement Units & Valuation Basis
- 1.6 Target Stakeholders
- 1.7 Limitations & Assumptions
Chapter 2. Executive Summary
- 2.1 Global Sodium Thiocyanate Market Snapshot
- 2.1.1 Market Size – Historical (2024) & Forecast (2024-2032) (2024: USD 182.77 million → 2032: USD 263.92 million)
- 2.1.2 Volume & Revenue – Global Totals (Volume Where Applicable)
- 2.1.3 Key Market Highlights – Top Five Facts
- 2.2 Sodium Thiocyanate Market Segmentation Snapshot
- 2.2.1 Market Split by Region – 2024 vs. 2032
- 2.3 Competitive Snapshot
- 2.3.1 Top 10 Players by Revenue Share – 2024
- 2.3.2 Top 10 Players by Volume Share – 2024 (Volume Where Applicable)
- 2.3.3 Recent Strategic Developments (18-Month Summary)
- 2.4 Key Investment Highlights & Strategic Conclusions
Chapter 3. Sodium Thiocyanate Market Dynamics & Industry Analysis
- 3.1 Market Overview & Context
- 3.1.1 Sodium Thiocyanate Market Position in the Broader Industry Value Chain
- 3.1.2 Demand Structure & Purchasing Dynamics
- 3.1.3 Market Maturity & Development Stage by Region
- 3.2 Sodium Thiocyanate Market Drivers
- 3.3 Sodium Thiocyanate Market Restraints & Challenges
- 3.4 Sodium Thiocyanate Market Opportunities
- 3.5 Porter's Five Forces Analysis
- 3.5.1 Threat of New Entrants
- 3.5.2 Bargaining Power of Suppliers
- 3.5.3 Bargaining Power of Buyers
- 3.5.4 Threat of Substitutes
- 3.5.5 Competitive Rivalry – Intensity Assessment
- 3.6 Sodium Thiocyanate Value Chain Analysis
- 3.6.1 Upstream – Key Inputs, Resources & Suppliers
- 3.6.1.1 Key Input/Resource 1
- 3.6.1.2 Key Input/Resource 2
- 3.6.1.3 Key Input/Resource 3
- 3.6.2 Midstream – Core Operations & Value Creation
- 3.6.2.1 Operating Model & Process Overview
- 3.6.2.2 Key Operating Locations & Capabilities by Company
- 3.6.3 Downstream – Market Channels & End Users
- 3.6.3.1 Direct Sales & Customer Engagement Channels
- 3.6.3.2 Indirect Sales, Intermediaries & Partner Channels
- 3.6.4 Value Chain Profitability Analysis
- 3.6.1 Upstream – Key Inputs, Resources & Suppliers
- 3.7 PESTEL Analysis
- 3.7.1 Political Factors
- 3.7.2 Economic Factors
- 3.7.3 Social Factors
- 3.7.4 Technological Factors
- 3.7.5 Environmental Factors
- 3.7.6 Legal Factors
- 3.8 Sodium Thiocyanate Supply Chain Analysis
- 3.8.1 Critical Input & Resource Availability Risk Assessment
- 3.8.2 Supplier & Operational Concentration Risk (Geographic Exposure)
- 3.8.3 Supply & Service Disruption Impact Analysis
- 3.9 Regulatory & Policy Landscape
Note: The regulatory and policy landscape section covers regulations based on their applicability to the market, Sodium Thiocyanate category, geography, and scope of the study. Only regulatory frameworks with a material impact on operations, compliance, trade, sustainability, or market access are analyzed in detail.
Chapter 4. Key Investment Pockets & Opportunity Analysis
- 4.1 Sodium Thiocyanate Market Attractiveness Analysis
- 4.1.1 By Region – Investment Attractiveness Matrix (Market Size × CAGR)
- 4.2 Absolute Revenue Growth Opportunity
- 4.2.1 By Region – Absolute Revenue Growth Through 2032
- 4.3 Incremental Demand Opportunity
- 4.3.1 By Region – Incremental Demand Through 2032
- 4.3.2 Segment – Incremental Demand
- 4.4 Emerging Submarket Opportunity Deep Dive (Subject to Applicability)
- 4.5 Priority Market Opportunity Scorecards
- 4.5.1 United States
- 4.5.2 Europe
- 4.5.3 Asia
- 4.5.4 Middle East & Africa
Note: Priority market opportunity scorecards reflect the geographic scope and strategic relevance of the study. Listed markets are indicative and may be adapted to the industry.
Chapter 5. Sodium Thiocyanate Cross-Border Trade & Market Access Analysis
- 5.1 International Trade & Cross-Border Activity Overview
- 5.1.1 Global Export Value by Country (2024)
- 5.1.2 Global Export Volume by Country (2024) (Volume Where Applicable)
- 5.1.3 Global Import Value by Country (2024)
- 5.1.4 Global Import Volume by Country (2024) (Volume Where Applicable)
- 5.1.5 Net Trade Balance by Country (2024)
- 5.2 Export Analysis – Segment
- 5.2.1 Category 1 (Applicable Classification Code)
- 5.2.2 Category 2 (Applicable Classification Code)
- 5.2.3 Category 3 (Applicable Classification Code)
- 5.2.4 Category 4 (Applicable Classification Code)
- 5.2.5 Category 5 (Applicable Classification Code)
- 5.3 Import Analysis – Segment
- 5.3.1 Category 1 (Applicable Classification Code)
- 5.3.2 Category 2 (Applicable Classification Code)
- 5.3.3 Category 3 (Applicable Classification Code)
- 5.3.4 Category 4 (Applicable Classification Code)
- 5.3.5 Category 5 (Applicable Classification Code)
- 5.4 Cross-Border Pricing & Transaction Benchmarks
- 5.4.1 Export Pricing – Segment & Country
- 5.4.2 Import Pricing – Segment & Source Country
- 5.4.3 Price Trends (2024)
- 5.5 Key Cross-Border Trade & Delivery Routes
- 5.5.1 Cross-Border Trade/Delivery Route 1
- 5.5.2 Cross-Border Trade/Delivery Route 2
- 5.5.3 Cross-Border Trade/Delivery Route 3
- 5.5.4 Cross-Border Trade/Delivery Route 4
- 5.5.5 Cross-Border Trade/Delivery Route 5
- 5.6 Trade Policy & Market Access Impact Assessment
- 5.6.1 Tariff & Non-Tariff Barriers
- 5.6.2 Regional Trade & Economic Integration Frameworks
- 5.6.3 Bilateral & Multilateral Trade Agreements
- 5.6.4 Cross-Border Operating, Licensing & Localization Requirements
Note: This chapter applies where cross-border trade or delivery is relevant to Sodium Thiocyanate. Goods, services, and digital offerings are assessed using applicable classifications and transaction measures. Import-export volumes, trade balances, and route analyses are included only where meaningful to the market.
Chapter 6. Competitive Landscape & Company Benchmarking
- 6.1 Sodium Thiocyanate Market Concentration & Structure
- 6.1.1 Herfindahl-Hirschman Index (HHI) – vs. 2024
- 6.1.2 Leading, Mid-Sized & Emerging Player Structure
- 6.1.3 Global, Regional & Local Player Dynamics
- 6.2 Sodium Thiocyanate Market Share Analysis – 2024
- 6.2.1 Global Revenue Share by Company
- 6.2.2 Global Volume Share by Company (Volume Where Applicable)
- 6.2.3 Regional Revenue Share
- 6.2.4 Market Share Evolution ( vs. 2024)
- 6.2.5 Company Market Share by Key Segment
- 6.2.6 Company Market Share by Customer Group
- 6.3 Operating Scale, Capacity & Infrastructure Analysis
- 6.3.1 Global Operating Scale & Supply Capacity
- 6.3.2 Resource Utilization & Operating Efficiency
- 6.3.3 Output, Service Delivery & Activity Metrics
- 6.3.4 Operating Footprint & Infrastructure Map
- 6.3.5 Planned Operational & Capacity Expansion
- 6.4 Sodium Thiocyanate Competitive Benchmarking Matrix
- 6.4.1 Revenue, Growth, Profitability & Operating Metric Comparison
- 6.4.2 Channel Revenue Mix
- 6.4.3 Geographic Revenue Exposure
- 6.4.4 R&D Intensity
- 6.4.5 Sustainability Maturity
- 6.5 Strategic Developments in Sodium Thiocyanate (Last 24 Months)
- 6.5.1 Mergers, Acquisitions & Divestments
- 6.5.2 New Products, Services & Solutions in Sodium Thiocyanate
- 6.5.3 Operational & Infrastructure Expansions
- 6.5.4 Strategic Alliances, Joint Ventures & Partnerships
- 6.5.5 Distribution Expansion & Market Entry
- 6.5.6 Sustainability & ESG Initiatives
- 6.6 Competitive Strategy Mapping
- 6.6.1 Leader, Challenger, Follower & Niche Classification
- 6.6.2 Pricing Strategy Comparison
- 6.6.3 Channel Strategy Matrix
Note: Strategic developments are included based on their materiality and the availability of reliable information.
Chapter 7. Global Sodium Thiocyanate Market – By Sales & Delivery Channel
- 7.1 Segment Overview
- 7.1.1 Volume & Revenue Split by Channel (2024 & 2032) (Volume Where Applicable)
- 7.1.2 Channel Mix Evolution (2024-2032)
Chapter 8. Regional Market Analysis – Global Overview
- 8.1 Global Regional Overview
- 8.1.1 Regional Volume Share (Volume Where Applicable)
- 8.1.2 Regional Revenue Share
- 8.1.3 Regional Volume by Region (Volume Where Applicable)
- 8.1.4 Regional Revenue by Region
- 8.1.5 Regional Forecast Through 2032
- 8.2 Cross-Regional Segment Analysis
- 8.2.1 By Sales & Delivery Channel
- 8.2.2 By Competitive Positioning & Price Tier
Chapter 9. North America Sodium Thiocyanate Market
- 9.1 United States
- 9.2 Canada
- 9.3 Mexico
Chapter 10. Europe Sodium Thiocyanate Market
- 10.1 Germany
- 10.2 France
- 10.3 Italy
- 10.4 United Kingdom
- 10.5 Spain
- 10.6 Poland
- 10.7 Russia
- 10.8 Netherlands
- 10.9 Belgium
- 10.10 Sweden
- 10.11 Denmark
- 10.12 Norway
- 10.13 Rest of Europe
Chapter 11. Asia Pacific Sodium Thiocyanate Market
- 11.1 China
- 11.2 India
- 11.3 Japan
- 11.4 South Korea
- 11.5 Thailand
- 11.6 Indonesia
- 11.7 Vietnam
- 11.8 Malaysia
- 11.9 Australia
- 11.10 Rest of Asia Pacific
Chapter 12. Latin America Sodium Thiocyanate Market
- 12.1 Brazil
- 12.2 Argentina
- 12.3 Colombia
- 12.4 Chile
- 12.5 Rest of Latin America
Chapter 13. Middle East Sodium Thiocyanate Market
- 13.1 Saudi Arabia
- 13.2 United Arab Emirates
- 13.3 Turkey
- 13.4 Israel
- 13.5 Iran
- 13.6 Rest of the Middle East
Chapter 14. Africa Sodium Thiocyanate Market
- 14.1 South Africa
- 14.2 Egypt
- 14.3 Nigeria
- 14.4 Morocco
- 14.5 Rest of Africa
Chapter 15. Sodium Thiocyanate Company Profiles
- 15.1 [Company 01]
- 15.1.1 Company Overview
- 15.1.2 Key Management Personnel
- 15.1.3 Products & Services Portfolio
- 15.1.4 Financial Performance
- 15.1.5 Key Market Focus & Geographic Presence
- 15.1.6 Recent Developments & Strategic Initiatives
Note: The company profile list is preliminary and may change based on research findings, market developments, data availability, and client requirements.
Chapter 16. Appendices
- Appendix A – List of Abbreviations & Acronyms
- Appendix B – Industry Classification Code Reference – Full Series
- Appendix C – Supply, Output & Operating Capacity Data Tables
- Appendix D – End-Use & Demand Base Tables
- Appendix E – Demand, Adoption & Usage Assumptions
- Appendix F – Pricing & Revenue Metric Reference Tables
- Appendix G – Company Operations & Infrastructure Database
- Appendix H – Cross-Border Trade & Activity Data Tables (Where Applicable)
- Appendix I – Regulatory Summary Tables
- Appendix J – Primary Research Participant List (Anonymized)
- Appendix K – Primary Research Questionnaire Framework
- Appendix L – Data Sources & Bibliography
- Appendix M – Market Size Divergence & Source Comparison
Chapter 17. Research Methodology
- 17.1 Research Framework & Philosophy
- 17.2 Secondary Research – Sources, Hierarchy & Data Extraction
- 17.3 Data Modeling – Bottom-Up & Top-Down Market Sizing
- 17.4 Primary Research – Stakeholder Framework, LOI & Sample Sizes
- 17.5 Forecast Methodology – Regression, Scenario & Sensitivity Analysis
- 17.6 Quality Control – Four-Layer Validation Framework
- 17.7 Limitations & Standard Assumptions
- 17.8 Disclaimer
