
| REPORT ATTRIBUTE | DETAILS |
|---|---|
| Historical Period | 2020-2023 |
| Base Year | 2024 |
| Forecast Period | 2025-2032 |
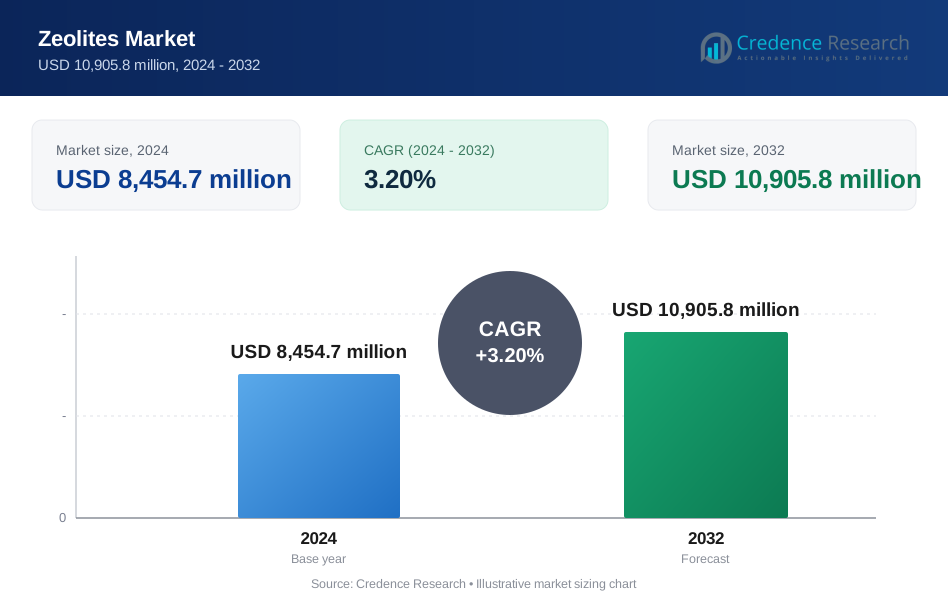
| Zeolites Market Size 2024 | USD 8,454.7 million |
| Zeolites Market, CAGR | 3.20% |
| Zeolites Market Size 2032 | USD 10,905.8 million |
Market Overview
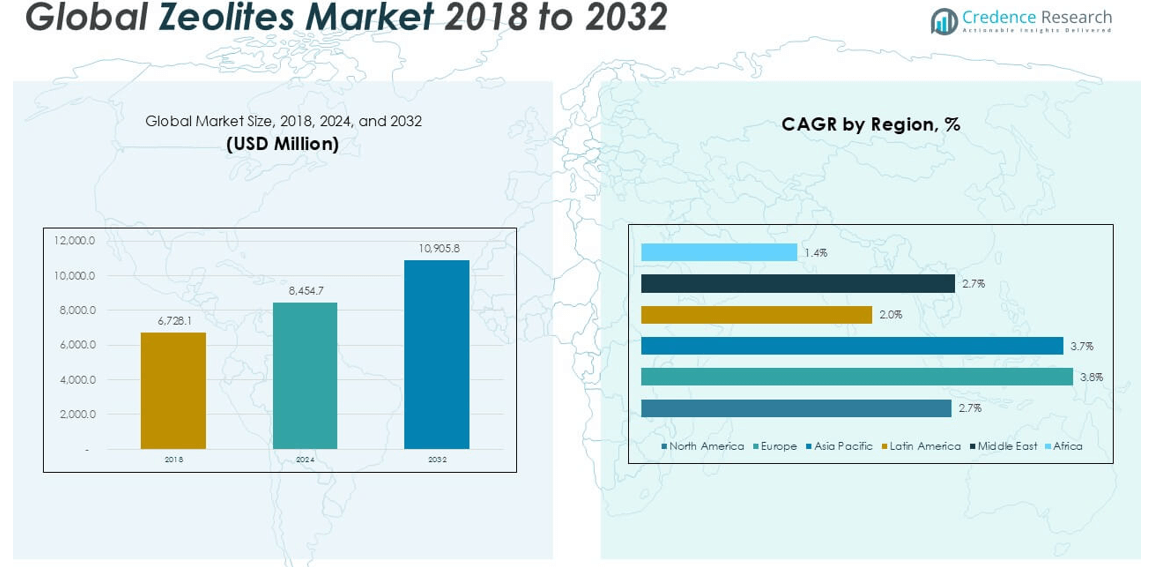
The Global Zeolites Market is projected to grow from USD 8,454.7 million in 2024 to an estimated USD 10,905.8 million by 2032, registering a compound annual growth rate (CAGR) of 3.20% from 2025 to 2032.
Growing environmental concerns and increasing regulatory pressure are driving the adoption of zeolites in industrial processes as eco-friendly alternatives to conventional chemicals. Their effectiveness in reducing volatile organic compounds (VOCs), ammonia emissions, and heavy metals from wastewater is increasing their usage in environmental remediation. Furthermore, the rising need for energy-efficient and sustainable solutions has spurred interest in zeolites for emerging applications in renewable energy and green chemistry. Technological advancements in zeolite synthesis and structure optimization are also shaping future trends in the market.
Regionally, Asia-Pacific dominates the global zeolites market, driven by strong industrialization in countries such as China, India, and Japan. Europe follows closely due to stringent environmental regulations and high demand from the detergent and catalyst sectors. North America also holds a significant share, particularly in refining and gas separation. Key players in the market include BASF SE, Clariant AG, Honeywell International Inc., Albemarle Corporation, Tosoh Corporation, and Arkema Group, all of whom are focusing on product innovation and capacity expansion to maintain competitive advantage.
Market Insights
- The Global Zeolites Market is projected to grow from USD 8,454.7 million in 2024 to USD 10,905.8 million by 2032, at a CAGR of 3.20% between 2025 and 2032.
- Rising demand for eco-friendly and phosphate-free alternatives in detergents is a key driver fueling market growth.
- Increasing usage of zeolites in petrochemical and refining industries supports long-term industrial demand.
- High production costs and energy-intensive synthetic processes remain major restraints for small manufacturers.
- Regulatory pressure to reduce VOCs and improve wastewater treatment is pushing adoption across industrial sectors.
- Asia-Pacific dominates the market due to strong industrial output in China, India, and Japan.
- Europe and North America also show steady growth, driven by environmental regulations and high-performance application needs.
Market Drivers
Rising Demand for Eco-Friendly Alternatives in Industrial Applications
The Global Zeolites Market is experiencing steady growth due to the increasing demand for environmentally friendly alternatives in industrial processes. Zeolites are replacing phosphates in detergents, aligning with global regulations targeting water pollution and sustainability. Their ability to absorb and neutralize harmful substances supports cleaner manufacturing across various industries. Governments worldwide are implementing strict guidelines for emissions and wastewater management, pushing industries toward zeolite-based solutions. These minerals play a critical role in reducing the environmental footprint of chemical and petrochemical operations. The market benefits from growing consumer awareness about the environmental impact of everyday products.
- For instance, over 1,500,000 metric tons of synthetic zeolites were produced globally for use in detergents and water treatment, reflecting widespread adoption as a phosphate alternative in compliance with environmental regulations.
Expanding Use in Petrochemical and Refining Industries
The use of zeolites in refining and petrochemical sectors continues to drive significant growth. It supports catalytic cracking, hydrocracking, and isomerization processes that enhance fuel efficiency and quality. Refineries prefer zeolites for their thermal stability and high surface area, which improves operational output. Increasing energy demand across emerging economies is pushing capacity expansion in the refining sector, fueling demand for zeolite catalysts. The material's high efficiency and reliability under extreme conditions make it indispensable in these applications. The Global Zeolites Market remains closely linked to the performance and growth of the global oil and gas industry.
- For instance, in 2024, global petrochemical and refining operations consumed more than 800,000 metric tons of zeolite catalysts, according to company-reported production and sales data, underscoring the material’s critical role in large-scale industrial processes.
Increasing Adoption in Water Treatment and Air Purification
Water treatment facilities are incorporating zeolites to remove heavy metals, ammonia, and other contaminants efficiently. It offers a sustainable solution to water purification challenges in both municipal and industrial settings. Governments are investing in advanced water infrastructure, creating new opportunities for zeolite deployment. The rise in urbanization and the need for safe drinking water enhance market prospects. In air purification systems, zeolites capture VOCs and odors, supporting clean air initiatives in commercial and residential buildings. These expanding applications continue to elevate the relevance of the Global Zeolites Market.
Growing Applications in Agriculture and Construction Sectors
Zeolites are gaining attention in agriculture for their role in improving soil quality and nutrient retention. It enhances fertilizer efficiency, reduces leaching, and supports crop yield improvements. In construction, zeolites are added to lightweight concrete and insulating materials for better thermal performance and sustainability. Increasing demand for green buildings and energy-efficient construction supports this growth. The agriculture sector, particularly in Asia-Pacific and Latin America, is integrating zeolites into soil amendment strategies. These diversified applications strengthen the Global Zeolites Market and widen its growth potential across multiple industries.
Market Trends
Increasing Use of Synthetic Zeolites in High-Performance Applications
The shift toward synthetic zeolites continues to shape the Global Zeolites Market due to their uniform pore structure and superior adsorption capacity. Industries favor synthetic variants for applications requiring consistency, such as in petrochemical catalysts and detergent builders. It allows precise control over properties like pore size and ion-exchange capacity, enhancing product performance. Companies are investing in R\&D to develop advanced formulations for niche applications in gas separation and specialty chemicals. These developments support broader adoption across sectors where natural zeolites fall short in performance. The trend reflects a growing preference for engineered materials in complex industrial processes.
- For instance, in 2024, a leading global manufacturer reported the production of over 1,400,000 metric tonnes of synthetic zeolites for use in detergent and petrochemical applications, with more than 350 industrial clients adopting new high-performance zeolite formulations for catalytic cracking and gas separation, as documented in company production data and industry association surveys.
Growing Integration in Renewable Energy and CO₂ Capture Solutions
The market is witnessing a notable trend in the use of zeolites for carbon capture and renewable energy storage. It serves as a promising material for storing hydrogen and capturing CO₂ from flue gases, supporting decarbonization efforts. Researchers are optimizing zeolite frameworks to improve gas adsorption and selectivity, making them suitable for green energy systems. With global targets focused on reducing emissions, industries are turning to zeolites as part of their sustainability strategies. These developments position the Global Zeolites Market at the intersection of climate innovation and industrial efficiency. Demand is rising for zeolite-based solutions in next-generation energy applications.
- For instance, in 2024, more than 120 pilot and commercial-scale CO₂ capture facilities worldwide deployed zeolite-based adsorption systems, processing over 8,500,000 tonnes of flue gas annually, according to surveys by international energy agencies and government environmental reports.
Expansion of Zeolite-Based Products in Consumer Goods Sector
Consumer product manufacturers are incorporating zeolites into health, hygiene, and cosmetic items. It is used in deodorants, toothpaste, and skincare due to its natural absorption and antimicrobial properties. The market trend aligns with the rising demand for safe, non-toxic, and mineral-based formulations in personal care. Companies are branding zeolite-infused products as sustainable and effective, appealing to eco-conscious consumers. Innovations in product design and marketing are driving this trend forward. The Global Zeolites Market benefits from its growing visibility in consumer-facing industries beyond traditional industrial applications.
Strategic Collaborations and Regional Capacity Expansion
Key players are forming partnerships and expanding regional manufacturing capabilities to meet rising demand. It helps improve supply chain efficiency and reduce production costs across global markets. Asia-Pacific is witnessing significant capacity additions due to strong industrial demand and lower production costs. Companies are also pursuing mergers and joint ventures to strengthen their market position and technology offerings. These collaborations accelerate innovation and expand access to high-quality zeolites across regions. The Global Zeolites Market is becoming increasingly competitive, with players focusing on both scale and specialization.
Market Challenges
High Production Costs and Complex Manufacturing Processes
The Global Zeolites Market faces challenges from high production costs and energy-intensive manufacturing methods. Synthetic zeolite production requires precise temperature control, advanced equipment, and high-purity raw materials, which increase operational expenses. It often limits the cost competitiveness of zeolites compared to other chemical alternatives. Smaller manufacturers struggle to scale operations due to capital intensity and technical expertise requirements. Fluctuating energy and raw material prices further impact overall profitability. These factors can restrict market penetration in price-sensitive regions and industries.
- For instance, the energy cost for producing one ton of synthetic zeolite can exceed 450 units, while the installation of a standard production line may require an initial investment of over 1,200,000 units in equipment and facility upgrades. Smaller producers often face operational expenses that are 30 to 50 units higher per ton compared to large-scale manufacturers, making it difficult to compete in markets where cost sensitivity is high.
Limited Natural Reserves and Environmental Constraints
The availability of high-quality natural zeolite deposits is limited and unevenly distributed across regions. It creates supply constraints for manufacturers dependent on natural sources. Mining operations face increasing scrutiny from environmental regulators due to land degradation and ecological concerns. Delays in obtaining permits and strict compliance norms affect extraction activities. The Global Zeolites Market must also address sustainability issues linked to mining waste and processing emissions. These environmental and regulatory hurdles may limit growth and require stronger investment in responsible sourcing and recycling technologies.
Market Opportunities
Rising Demand in Emerging Economies and Untapped Industrial Sectors
The Global Zeolites Market holds strong growth potential in emerging economies where industrialization and urban development are accelerating. Rapid expansion in sectors like construction, water treatment, and agriculture is creating demand for cost-effective and sustainable materials. It provides effective solutions for improving soil quality, purifying wastewater, and enhancing building efficiency. Governments in Asia-Pacific, Latin America, and Africa are investing in infrastructure, which will increase the adoption of zeolites in new applications. Untapped markets offer significant opportunities for manufacturers to expand distribution networks and develop localized product offerings. These regions can become key growth engines over the next decade.
Innovation in Green Technologies and Circular Economy Models
Advancements in green technologies present major opportunities for zeolite applications in energy storage, emissions control, and chemical recycling. It plays a key role in carbon capture, hydrogen storage, and catalytic processes designed to reduce environmental impact. Companies are exploring ways to integrate zeolites into circular economy strategies, including waste-to-resource initiatives and closed-loop manufacturing. Regulatory support for clean energy and pollution reduction will increase funding for zeolite-based innovations. The Global Zeolites Market can benefit from aligning product development with climate goals and sustainable practices. Innovation in this space can open new revenue streams and drive long-term growth.
Market Segmentation Analysis
By Form
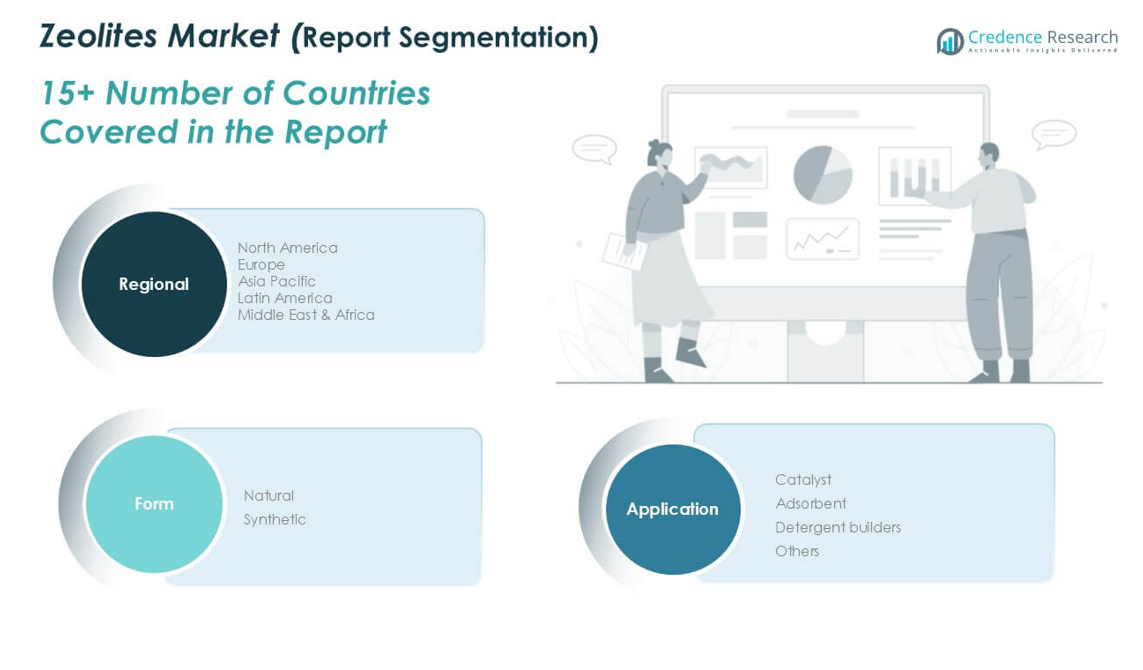
The Global Zeolites Market is segmented into Natural and Synthetic forms. Natural zeolites are widely used in agriculture, water treatment, and animal feed applications due to their abundance and lower cost. Their ion-exchange capacity and adsorption properties make them suitable for less demanding processes. Synthetic zeolites dominate in terms of revenue share owing to their tailored pore structures, thermal stability, and higher efficiency in industrial applications. It offers consistent performance in catalysts, gas separation, and detergent production, making it the preferred choice for high-precision applications. Increasing focus on performance and quality control is likely to drive further adoption of synthetic variants across global marketsFor instance, industry data from 2023 show that global production of synthetic zeolites exceeded 4.5 million metric tons, while natural zeolite production was estimated at around 3.1 million metric tons for the same year.
By Application
Based on application, the Global Zeolites Market is classified into Catalyst, Adsorbent, Detergent Builders, and Others. Catalyst applications account for a significant market share due to strong demand from petrochemical and refining industries. It enhances process efficiency in cracking and isomerization units, making it a critical material in fuel and chemical production. The adsorbent segment also holds a considerable share, supported by rising usage in gas purification, air treatment, and wastewater management. Detergent builders form another major segment, driven by their phosphate-replacement capabilities and growing consumer demand for eco-friendly cleaning products. Other applications include agricultural soil treatment and biomedical uses, which offer emerging growth opportunities.
- For instance, a 2023 industry survey reported that more than 2.2 million metric tons of zeolites were used globally in detergent builder applications, while catalyst and adsorbent uses accounted for approximately 1.7 million and 1.3 million metric tons, respectively.
Segments
Based on Form
- Natural
- Syntheti
Based on Application
- Catalyst
- Adsorbent
- Detergent builders
- Others
Based on Region
- North America
- U.S.
- Canada
- Mexico
- Europe
- UK
- France
- Germany
- Italy
- Spain
- Russia
- Belgium
- Netherlands
- Austria
- Sweden
- Poland
- Denmark
- Switzerland
- Rest of Europe
- Asia Pacific
- China
- Japan
- South Korea
- India
- Australia
- Thailand
- Indonesia
- Vietnam
- Malaysia
- Philippines
- Taiwan
- Rest of Asia Pacific
- Latin America
- Brazil
- Argentina
- Peru
- Chile
- Colombia
- Rest of Latin America
- Middle East
- UAE
- KSA
- Israel
- Turkey
- Iran
- Rest of Middle East
- Africa
- Egypt
- Nigeria
- Algeria
- Morocco
- Rest of Africa
Regional Analysis
North America Zeolites Market
The North America Zeolites Market reached USD 2,019.96 million in 2024 and is projected to reach USD 2,508.33 million by 2032, growing at a CAGR of 2.7%. It accounts for approximately 23.9% of the global market share in 2024. The region benefits from strong demand in refining, petrochemical, and detergent applications. The United States leads the market due to advanced manufacturing capabilities and high adoption of synthetic zeolites in industrial processes. It also shows increasing use in environmental remediation and water treatment sectors. The market continues to grow steadily, supported by technological advancements and environmental regulations.
Europe Zeolites Market
The Europe Zeolites Market was valued at USD 1,905.22 million in 2024 and is expected to rise to USD 2,567.22 million by 2032, registering a CAGR of 3.8%. The region holds around 22.5% of the global market share in 2024. Germany, France, and the UK drive growth through increased applications in detergents, catalysts, and environmental technologies. It is supported by strict EU regulations that favor phosphate-free products and sustainable industrial processes. Growing awareness of water and air purification is also boosting demand. The market benefits from strong R\&D infrastructure and high consumer preference for eco-friendly solutions.
Asia Pacific Zeolites Market
The Asia Pacific Zeolites Market dominates globally, valued at USD 2,932.59 million in 2024, with projections to reach USD 3,926.07 million by 2032, growing at a CAGR of 3.7%. It represents the largest regional share at 34.7% of the global market in 2024. China, India, and Japan lead in industrial production, detergent manufacturing, and environmental applications. Rapid industrialization, urbanization, and infrastructure investments fuel regional growth. It sees widespread use in agriculture and construction, further boosting volume demand. Strong regional manufacturing capabilities and cost advantages attract major players to expand operations.
Latin America Zeolites Market
The Latin America Zeolites Market stood at USD 834.36 million in 2024 and is projected to reach USD 981.52 million by 2032, with a CAGR of 2.0%. The region contributes about 9.9% of the global market share in 2024. Brazil and Mexico drive most of the demand, particularly in agriculture, water treatment, and detergent applications. It faces limitations due to lower industrial output compared to other regions. However, growing awareness of environmental and soil health applications supports gradual adoption. Market players are exploring opportunities in natural zeolite deposits for cost-effective sourcing.
Middle East Zeolites Market
The Middle East Zeolites Market was valued at USD 551.97 million in 2024 and is estimated to reach USD 687.06 million by 2032, growing at a CAGR of 2.7%. It holds 6.5% of the global market share in 2024. Countries such as Saudi Arabia and the UAE show increasing demand for zeolites in oil refining, water treatment, and environmental management. It is driven by government initiatives to adopt cleaner technologies and reduce dependence on conventional chemical treatments. The market benefits from proximity to petrochemical hubs, enabling easy integration into industrial applications. Growth remains moderate but stable.
Africa Zeolites Market
The Africa Zeolites Market recorded USD 210.64 million in 2024, with forecasts to reach USD 235.56 million by 2032, reflecting a CAGR of 1.4%. The region holds the smallest share, accounting for 2.4% of the global market in 2024. South Africa leads regional consumption, with limited contributions from other countries. It is used mainly in agriculture and water purification in rural and urban infrastructure. Market growth is restrained by limited industrial development and supply chain challenges. However, increased attention to sustainable agriculture and access to clean water may create new demand over time.
Key players
- Anhui Mingmei MinChem Co.
- Arkema Group
- BASF SE
- Chemiewerk Bad Köstritz GmbH
- Clariant
- Dalian Haixin Chemical Industrial Co. Ltd
- Grace Catalysts Technologies
- Interra Global Corporation
- KNT Group
- Tricat Group
Competitive Analysis
The Global Zeolites Market is highly competitive, with both multinational corporations and regional players actively shaping its structure. Companies like BASF SE, Arkema Group, and Clariant lead through advanced product development, global distribution networks, and strong brand recognition. It is characterized by continuous innovation in synthetic zeolite formulations and expanding application portfolios in energy, environment, and consumer goods. Smaller firms such as Chemiewerk Bad Köstritz GmbH and Interra Global Corporation focus on specialized applications and flexible manufacturing capabilities to gain market share. Strategic collaborations, capacity expansions, and investments in R\&D remain the core growth tactics across the board. The market continues to evolve with rising focus on sustainability and technological integration.
Recent Developments
- In August 2024, BASF launched Fourtiva, a new Fluid Catalytic Cracking (FCC) catalyst. It utilizes BASF's Advanced Innovative Matrix (AIM) and Multiple Frameworks Topology (MFT) technologies to optimize performance, particularly for gasoil to mild resid feedstock. The catalyst is designed to maximize butylene yields, improve naphtha octane, and minimize coke and dry gas formation.
Market Concentration and Characteristics
The Global Zeolites Market exhibits moderate market concentration, with a mix of large multinational corporations and several regional and niche players. It is characterized by a diverse product landscape, spanning natural and synthetic forms used across multiple industries including petrochemicals, detergents, agriculture, and environmental applications. Leading players hold competitive advantages through advanced manufacturing technologies, strong distribution networks, and sustained R&D investments. The market remains innovation-driven, with synthetic zeolites gaining preference for high-performance applications. It shows stable long-term demand supported by regulatory shifts toward sustainability and clean technologies. Barriers to entry include high capital requirements and technical expertise, which limit new entrants.
Report Coverage
The research report offers an in-depth analysis based on Form, Application and Region. It details leading market players, providing an overview of their business, product offerings, investments, revenue streams, and key applications. Additionally, the report includes insights into the competitive environment, SWOT analysis, current market trends, as well as the primary drivers and constraints. Furthermore, it discusses various factors that have driven market expansion in recent years. The report also explores market dynamics, regulatory scenarios, and technological advancements that are shaping the industry. It assesses the impact of external factors and global economic changes on market growth. Lastly, it provides strategic recommendations for new entrants and established companies to navigate the complexities of the market.
Future Outlook
- The market will see rising preference for synthetic zeolites due to their superior uniformity, performance consistency, and suitability in high-end industrial applications.
- Zeolites will play a greater role in air and water purification systems as governments strengthen environmental regulations and promote green infrastructure investments.
- Emerging markets across Asia-Pacific, Latin America, and Africa will drive demand, supported by industrial expansion, urbanization, and public health initiatives.
- Zeolites will become integral to energy transition efforts, particularly in hydrogen storage, carbon capture systems, and catalytic processes for low-emission fuels.
- The agriculture sector will expand its use of zeolites for soil conditioning, nutrient management, and livestock feed efficiency, boosting rural market penetration.
- Ongoing research will enable highly specialized zeolite structures tailored to meet evolving industrial needs, opening new avenues for niche applications.
- Market players will focus on acquisitions, partnerships, and capacity expansions to improve their global reach and diversify their product offerings.
- Zeolites will gain more exposure in health and personal care products, where their antimicrobial and absorption properties support clean-label trends.
- Manufacturers will invest in energy-efficient technologies and raw material optimization to overcome cost barriers and improve profit margins.
- The Global Zeolites Market will maintain steady growth due to its essential role in environmental sustainability, industrial performance, and regulatory compliance.
Request a Free Sample
Fill in your details and we'll send you a free sample report.
- Sample data tables & charts
- Research methodology
Need a Custom Version of This Report?
Tailor the scope, geography, or segments to your exact requirements.
- Custom geography or segment scope
- Direct access to our analyst team
Frequently Asked Questions
What is the market size of the Global Zeolites Market in 2023 and its forecast for 2032, including the CAGR?
Which region leads the Global Zeolites Market in terms of demand and consumption?
Why is there a growing shift toward zeolites in environmental and industrial processes?
Who are the leading players in the Global Zeolites Market?
Table of Content
Chapter 1. Report Introduction
- 1.1 Report Description & Purpose
- 1.1.1 Report Title & Market Definition
- 1.1.2 Unique Selling Propositions (USP) & Key Differentiators
- 1.1.3 Value Proposition for Stakeholders
- 1.2 Research Objectives
- 1.2.1 Market Sizing Objectives (Volume & Revenue) (Volume Where Applicable)
- 1.2.2 Segmentation Objectives
- 1.2.3 Competitive Intelligence Objectives
- 1.2.4 Forecast & Scenario Objectives
- 1.3 Report Scope
- 1.3.1 Zeolites Scope – Segments & Subsegments Covered
- 1.3.2 Geographic Scope – Regions & Countries Covered
- 1.3.3 Historical Period, Base Year & Forecast Period (2024; forecast to 2032)
- 1.3.4 Inclusions & Exclusions
- 1.4 Industry Classification & Applicable Codes
- 1.5 Currency, Measurement Units & Valuation Basis
- 1.6 Target Stakeholders
- 1.7 Limitations & Assumptions
Chapter 2. Executive Summary
- 2.1 Global Zeolites Market Snapshot
- 2.1.1 Market Size – Historical (2024) & Forecast (2024-2032) (2024: USD 8,454.7 million → 2032: USD 10,905.8 million)
- 2.1.2 Volume & Revenue – Global Totals (Volume Where Applicable)
- 2.1.3 Key Market Highlights – Top Five Facts
- 2.2 Zeolites Market Segmentation Snapshot
- 2.2.1 Market Split by Region – 2024 vs. 2032
- 2.3 Competitive Snapshot
- 2.3.1 Top 10 Players by Revenue Share – 2024
- 2.3.2 Top 10 Players by Volume Share – 2024 (Volume Where Applicable)
- 2.3.3 Recent Strategic Developments (18-Month Summary)
- 2.4 Key Investment Highlights & Strategic Conclusions
Chapter 3. Zeolites Market Dynamics & Industry Analysis
- 3.1 Market Overview & Context
- 3.1.1 Zeolites Market Position in the Broader Industry Value Chain
- 3.1.2 Demand Structure & Purchasing Dynamics
- 3.1.3 Market Maturity & Development Stage by Region
- 3.2 Zeolites Market Drivers
- 3.3 Zeolites Market Restraints & Challenges
- 3.4 Zeolites Market Opportunities
- 3.5 Porter's Five Forces Analysis
- 3.5.1 Threat of New Entrants
- 3.5.2 Bargaining Power of Suppliers
- 3.5.3 Bargaining Power of Buyers
- 3.5.4 Threat of Substitutes
- 3.5.5 Competitive Rivalry – Intensity Assessment
- 3.6 Zeolites Value Chain Analysis
- 3.6.1 Upstream – Key Inputs, Resources & Suppliers
- 3.6.1.1 Key Input/Resource 1
- 3.6.1.2 Key Input/Resource 2
- 3.6.1.3 Key Input/Resource 3
- 3.6.2 Midstream – Core Operations & Value Creation
- 3.6.2.1 Operating Model & Process Overview
- 3.6.2.2 Key Operating Locations & Capabilities by Company
- 3.6.3 Downstream – Market Channels & End Users
- 3.6.3.1 Direct Sales & Customer Engagement Channels
- 3.6.3.2 Indirect Sales, Intermediaries & Partner Channels
- 3.6.4 Value Chain Profitability Analysis
- 3.6.1 Upstream – Key Inputs, Resources & Suppliers
- 3.7 PESTEL Analysis
- 3.7.1 Political Factors
- 3.7.2 Economic Factors
- 3.7.3 Social Factors
- 3.7.4 Technological Factors
- 3.7.5 Environmental Factors
- 3.7.6 Legal Factors
- 3.8 Zeolites Supply Chain Analysis
- 3.8.1 Critical Input & Resource Availability Risk Assessment
- 3.8.2 Supplier & Operational Concentration Risk (Geographic Exposure)
- 3.8.3 Supply & Service Disruption Impact Analysis
- 3.9 Regulatory & Policy Landscape
Note: The regulatory and policy landscape section covers regulations based on their applicability to the market, Zeolites category, geography, and scope of the study. Only regulatory frameworks with a material impact on operations, compliance, trade, sustainability, or market access are analyzed in detail.
Chapter 4. Key Investment Pockets & Opportunity Analysis
- 4.1 Zeolites Market Attractiveness Analysis
- 4.1.1 By Region – Investment Attractiveness Matrix (Market Size × CAGR)
- 4.2 Absolute Revenue Growth Opportunity
- 4.2.1 By Region – Absolute Revenue Growth Through 2032
- 4.3 Incremental Demand Opportunity
- 4.3.1 By Region – Incremental Demand Through 2032
- 4.3.2 Segment – Incremental Demand
- 4.4 Emerging Submarket Opportunity Deep Dive (Subject to Applicability)
- 4.5 Priority Market Opportunity Scorecards
- 4.5.1 United States
- 4.5.2 Europe
- 4.5.3 Asia
- 4.5.4 Middle East & Africa
Note: Priority market opportunity scorecards reflect the geographic scope and strategic relevance of the study. Listed markets are indicative and may be adapted to the industry.
Chapter 5. Zeolites Cross-Border Trade & Market Access Analysis
- 5.1 International Trade & Cross-Border Activity Overview
- 5.1.1 Global Export Value by Country (2024)
- 5.1.2 Global Export Volume by Country (2024) (Volume Where Applicable)
- 5.1.3 Global Import Value by Country (2024)
- 5.1.4 Global Import Volume by Country (2024) (Volume Where Applicable)
- 5.1.5 Net Trade Balance by Country (2024)
- 5.2 Export Analysis – Segment
- 5.2.1 Category 1 (Applicable Classification Code)
- 5.2.2 Category 2 (Applicable Classification Code)
- 5.2.3 Category 3 (Applicable Classification Code)
- 5.2.4 Category 4 (Applicable Classification Code)
- 5.2.5 Category 5 (Applicable Classification Code)
- 5.3 Import Analysis – Segment
- 5.3.1 Category 1 (Applicable Classification Code)
- 5.3.2 Category 2 (Applicable Classification Code)
- 5.3.3 Category 3 (Applicable Classification Code)
- 5.3.4 Category 4 (Applicable Classification Code)
- 5.3.5 Category 5 (Applicable Classification Code)
- 5.4 Cross-Border Pricing & Transaction Benchmarks
- 5.4.1 Export Pricing – Segment & Country
- 5.4.2 Import Pricing – Segment & Source Country
- 5.4.3 Price Trends (2024)
- 5.5 Key Cross-Border Trade & Delivery Routes
- 5.5.1 Cross-Border Trade/Delivery Route 1
- 5.5.2 Cross-Border Trade/Delivery Route 2
- 5.5.3 Cross-Border Trade/Delivery Route 3
- 5.5.4 Cross-Border Trade/Delivery Route 4
- 5.5.5 Cross-Border Trade/Delivery Route 5
- 5.6 Trade Policy & Market Access Impact Assessment
- 5.6.1 Tariff & Non-Tariff Barriers
- 5.6.2 Regional Trade & Economic Integration Frameworks
- 5.6.3 Bilateral & Multilateral Trade Agreements
- 5.6.4 Cross-Border Operating, Licensing & Localization Requirements
Note: This chapter applies where cross-border trade or delivery is relevant to Zeolites. Goods, services, and digital offerings are assessed using applicable classifications and transaction measures. Import-export volumes, trade balances, and route analyses are included only where meaningful to the market.
Chapter 6. Competitive Landscape & Company Benchmarking
- 6.1 Zeolites Market Concentration & Structure
- 6.1.1 Herfindahl-Hirschman Index (HHI) – vs. 2024
- 6.1.2 Leading, Mid-Sized & Emerging Player Structure
- 6.1.3 Global, Regional & Local Player Dynamics
- 6.2 Zeolites Market Share Analysis – 2024
- 6.2.1 Global Revenue Share by Company
- 6.2.2 Global Volume Share by Company (Volume Where Applicable)
- 6.2.3 Regional Revenue Share
- 6.2.4 Market Share Evolution ( vs. 2024)
- 6.2.5 Company Market Share by Key Segment
- 6.2.6 Company Market Share by Customer Group
- 6.3 Operating Scale, Capacity & Infrastructure Analysis
- 6.3.1 Global Operating Scale & Supply Capacity
- 6.3.2 Resource Utilization & Operating Efficiency
- 6.3.3 Output, Service Delivery & Activity Metrics
- 6.3.4 Operating Footprint & Infrastructure Map
- 6.3.5 Planned Operational & Capacity Expansion
- 6.4 Zeolites Competitive Benchmarking Matrix
- 6.4.1 Revenue, Growth, Profitability & Operating Metric Comparison
- 6.4.2 Channel Revenue Mix
- 6.4.3 Geographic Revenue Exposure
- 6.4.4 R&D Intensity
- 6.4.5 Sustainability Maturity
- 6.5 Strategic Developments in Zeolites (Last 24 Months)
- 6.5.1 Mergers, Acquisitions & Divestments
- 6.5.2 New Products, Services & Solutions in Zeolites
- 6.5.3 Operational & Infrastructure Expansions
- 6.5.4 Strategic Alliances, Joint Ventures & Partnerships
- 6.5.5 Distribution Expansion & Market Entry
- 6.5.6 Sustainability & ESG Initiatives
- 6.6 Competitive Strategy Mapping
- 6.6.1 Leader, Challenger, Follower & Niche Classification
- 6.6.2 Pricing Strategy Comparison
- 6.6.3 Channel Strategy Matrix
Note: Strategic developments are included based on their materiality and the availability of reliable information.
Chapter 7. Global Zeolites Market – By Sales & Delivery Channel
- 7.1 Segment Overview
- 7.1.1 Volume & Revenue Split by Channel (2024 & 2032) (Volume Where Applicable)
- 7.1.2 Channel Mix Evolution (2024-2032)
Chapter 8. Regional Market Analysis – Global Overview
- 8.1 Global Regional Overview
- 8.1.1 Regional Volume Share (Volume Where Applicable)
- 8.1.2 Regional Revenue Share
- 8.1.3 Regional Volume by Region (Volume Where Applicable)
- 8.1.4 Regional Revenue by Region
- 8.1.5 Regional Forecast Through 2032
- 8.2 Cross-Regional Segment Analysis
- 8.2.1 By Sales & Delivery Channel
- 8.2.2 By Competitive Positioning & Price Tier
Chapter 9. North America Zeolites Market
- 9.1 United States
- 9.2 Canada
- 9.3 Mexico
Chapter 10. Europe Zeolites Market
- 10.1 Germany
- 10.2 France
- 10.3 Italy
- 10.4 United Kingdom
- 10.5 Spain
- 10.6 Poland
- 10.7 Russia
- 10.8 Netherlands
- 10.9 Belgium
- 10.10 Sweden
- 10.11 Denmark
- 10.12 Norway
- 10.13 Rest of Europe
Chapter 11. Asia Pacific Zeolites Market
- 11.1 China
- 11.2 India
- 11.3 Japan
- 11.4 South Korea
- 11.5 Thailand
- 11.6 Indonesia
- 11.7 Vietnam
- 11.8 Malaysia
- 11.9 Australia
- 11.10 Rest of Asia Pacific
Chapter 12. Latin America Zeolites Market
- 12.1 Brazil
- 12.2 Argentina
- 12.3 Colombia
- 12.4 Chile
- 12.5 Rest of Latin America
Chapter 13. Middle East Zeolites Market
- 13.1 Saudi Arabia
- 13.2 United Arab Emirates
- 13.3 Turkey
- 13.4 Israel
- 13.5 Iran
- 13.6 Rest of the Middle East
Chapter 14. Africa Zeolites Market
- 14.1 South Africa
- 14.2 Egypt
- 14.3 Nigeria
- 14.4 Morocco
- 14.5 Rest of Africa
Chapter 15. Zeolites Company Profiles
- 15.1 [Company 01]
- 15.1.1 Company Overview
- 15.1.2 Key Management Personnel
- 15.1.3 Products & Services Portfolio
- 15.1.4 Financial Performance
- 15.1.5 Key Market Focus & Geographic Presence
- 15.1.6 Recent Developments & Strategic Initiatives
Note: The company profile list is preliminary and may change based on research findings, market developments, data availability, and client requirements.
Chapter 16. Appendices
- Appendix A – List of Abbreviations & Acronyms
- Appendix B – Industry Classification Code Reference – Full Series
- Appendix C – Supply, Output & Operating Capacity Data Tables
- Appendix D – End-Use & Demand Base Tables
- Appendix E – Demand, Adoption & Usage Assumptions
- Appendix F – Pricing & Revenue Metric Reference Tables
- Appendix G – Company Operations & Infrastructure Database
- Appendix H – Cross-Border Trade & Activity Data Tables (Where Applicable)
- Appendix I – Regulatory Summary Tables
- Appendix J – Primary Research Participant List (Anonymized)
- Appendix K – Primary Research Questionnaire Framework
- Appendix L – Data Sources & Bibliography
- Appendix M – Market Size Divergence & Source Comparison
Chapter 17. Research Methodology
- 17.1 Research Framework & Philosophy
- 17.2 Secondary Research – Sources, Hierarchy & Data Extraction
- 17.3 Data Modeling – Bottom-Up & Top-Down Market Sizing
- 17.4 Primary Research – Stakeholder Framework, LOI & Sample Sizes
- 17.5 Forecast Methodology – Regression, Scenario & Sensitivity Analysis
- 17.6 Quality Control – Four-Layer Validation Framework
- 17.7 Limitations & Standard Assumptions
- 17.8 Disclaimer
