Home » Automotive & Transportation » Ports Autonomous Vehicles Market

Ports Autonomous Vehicles Market By Vehicle Type (Automatic Guided Vehicle (AGV), Autonomous Straddle Carrier (ASC), Autonomous Container Truck (ACT), Automated Trucks, Autonomous Cranes, Drones and Other Port Vehicles); By Autonomy Level (Fully Autonomous, Remotely Operated, Partially Autonomous); By Application (Commercial Port, Industrial Port, Fishing Port, Others) – Growth, Share, Opportunities & Competitive Analysis, 2024 – 2032

Report ID: 108254 | Report Format : Excel, PDF
REPORT ATTRIBUTE DETAILS
Historical Period 2020-2023
Base Year 2024
Forecast Period 2025-2032
Ports Autonomous Vehicles Market Size 2024 USD 1,488.23 million
Ports Autonomous Vehicles Market, CAGR 18.77%
Ports Autonomous Vehicles Market Size 2032 USD 6,452.27 million

Market Overview:

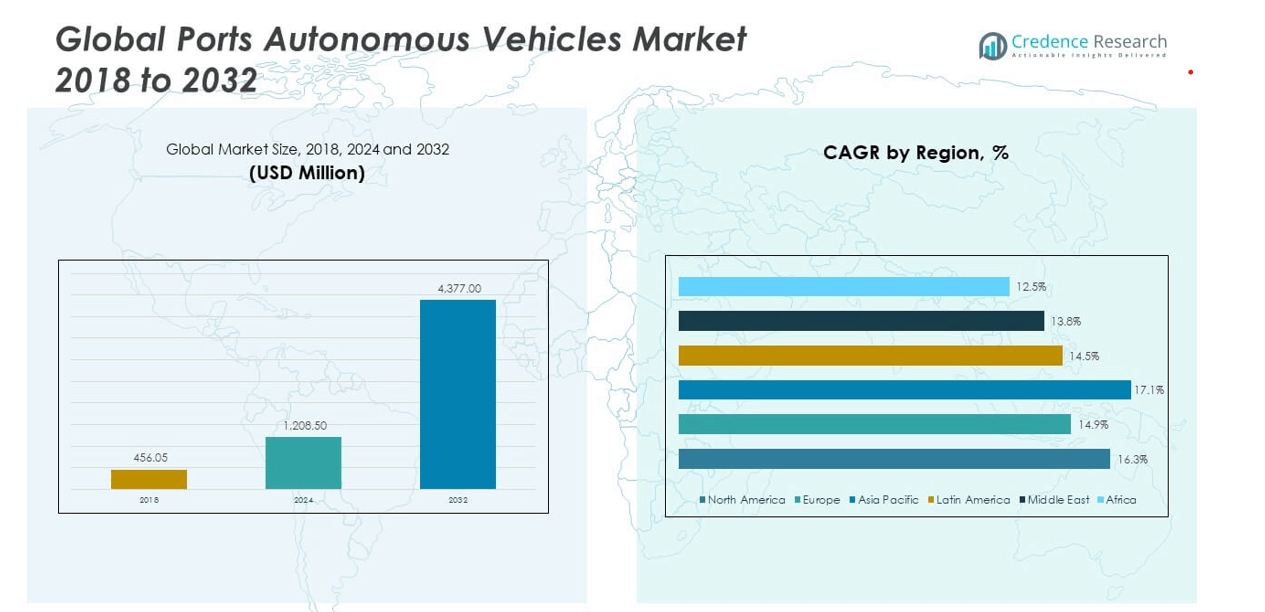
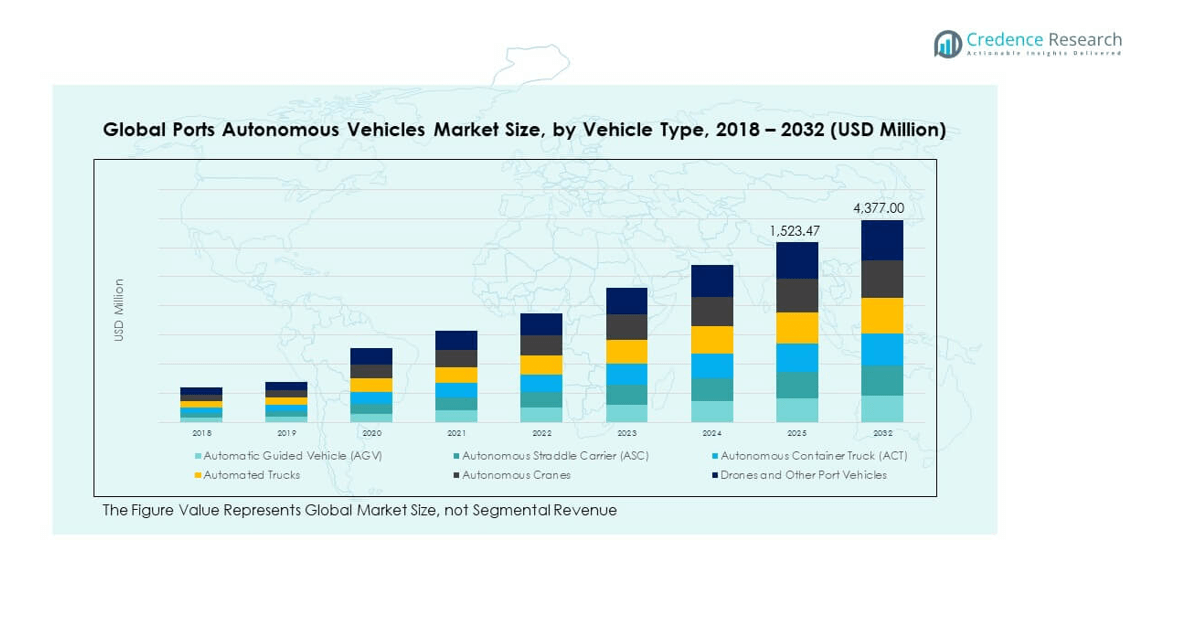
The Ports Autonomous Vehicles market size was valued at USD 686.07 million in 2018, grew to USD 1,488.23 million in 2024, and is anticipated to reach USD 6,452.27 million by 2032, at a CAGR of 18.77% during the forecast period.

The Ports Autonomous Vehicles market is highly competitive, led by key players such as Westwell Lab, ZPMC (Shanghai Zhenhua Heavy Industries), TuSimple, Beijing Trunk Technology, and Fabu.Ai. These companies are at the forefront of innovation, offering AI-driven, fully autonomous solutions tailored for complex port environments. They are expanding through strategic collaborations, pilot projects, and investments in smart port ecosystems. Regionally, Asia Pacific dominates the market with a 44.1% share in 2024, driven by significant automation initiatives in countries like China, Japan, and South Korea. North America and Europe follow, leveraging advanced infrastructure and supportive government policies to enhance port efficiency.

Ports Autonomous Vehicles Market size

Market Insights

  • The Ports Autonomous Vehicles market was valued at USD 686.07 million in 2018, reached USD 1,488.23 million in 2024, and is projected to hit USD 6,452.27 million by 2032, growing at a CAGR of 18.77% during the forecast period.
  • Growth is primarily driven by increasing demand for port automation, rising global cargo volumes, and labor shortages, prompting investments in AGVs, autonomous cranes, and container trucks.
  • A major trend is the integration of AI, IoT, and electric mobility into autonomous port systems, enabling real-time monitoring, energy efficiency, and predictive operations.
  • Key players such as Westwell Lab, ZPMC, and TuSimple dominate the market through innovation, strategic partnerships, and global expansion, though high implementation costs and cybersecurity risks act as key restraints.
  • Regionally, Asia Pacific holds the largest share at 44.1%, followed by Europe at 28.5% and North America at 18.7%; by segment, Automatic Guided Vehicles (AGVs) lead in adoption due to versatility and reliability.

Access crucial information at unmatched prices!

Request your sample report today & start making informed decisions powered by Credence Research Inc.!

Download Sample

Market Segmentation Analysis:

By Vehicle Type:

In the Ports Autonomous Vehicles market, the Automatic Guided Vehicle (AGV) segment holds the largest market share, driven by its widespread deployment in container handling and material transport operations within port terminals. AGVs offer high precision, reduced labor dependency, and enhanced operational safety, making them a preferred choice in large commercial ports. Additionally, the rising demand for efficient port automation and growing container traffic globally supports AGV adoption. Other segments such as Autonomous Container Trucks and Autonomous Cranes are gaining traction, particularly in high-throughput ports aiming to minimize turnaround time and enhance scalability.

  • For instance, Westwell’s “Q-Truck” autonomous electric container truck has been deployed at Qingdao Port, completing over 300,000 autonomous operating hours and handling more than 6 million TEU movements since its launch. This demonstrates the scalability and maturity of autonomous truck solutions in AGV-heavy environments.

By Autonomy Level

The Fully Autonomous segment dominates the Ports Autonomous Vehicles market in terms of both revenue and deployment volume. This dominance is attributed to the increasing investments in smart port infrastructure and the push for complete automation to improve safety, efficiency, and reduce human error. Fully autonomous vehicles offer continuous 24/7 operation with minimal supervision, making them ideal for high-volume port environments. While Remotely Operated and Partially Autonomous vehicles continue to serve transitional roles, their market share remains lower due to higher long-term operational costs and limited scalability compared to fully autonomous systems.

  • For instance, TuSimple’s autonomous freight trucks have demonstrated the capability to operate over 1 million miles without a safety driver, achieving a disengagement rate of less than 0.1 per 1,000 miles, which reinforces the feasibility of scaling fully autonomous solutions for port and logistics environments.

By Application

Among application segments, the Commercial Port segment accounts for the largest share of the Ports Autonomous Vehicles market. This dominance stems from the high cargo throughput, frequent container movements, and greater budget allocation for automation in commercial port facilities. The emphasis on improving turnaround times, minimizing labor costs, and enhancing port logistics drives the adoption of autonomous vehicles in this segment. In contrast, Industrial and Fishing Ports exhibit slower adoption due to smaller scale operations and budget limitations. However, ongoing digital transformation and automation trends are expected to gradually expand usage in these segments as well.

Market Overview

Rising Demand for Port Automation

The growing need for efficient and seamless port operations is a significant driver in the Ports Autonomous Vehicles market. Increasing global trade volumes and container traffic are compelling port authorities to adopt autonomous solutions that enhance operational speed, accuracy, and throughput. Automation reduces human intervention, minimizes delays, and ensures continuous functioning—especially important in high-traffic ports. As supply chain stakeholders focus on reducing logistics costs and improving turnaround times, the deployment of autonomous vehicles across container handling, stacking, and internal transport operations has become a strategic necessity.

  • For instance, at Yangshan Deep Water Port in Shanghai, ZPMC deployed 130+ autonomous guided vehicles (AGVs) and 26 automated quay cranes, enabling the port to handle more than 6.3 million TEUs annually through automated systems, with round-the-clock operations that significantly reduce vessel berthing time.

Labor Shortages and Operational Safety Requirements

A persistent shortage of skilled labor in port operations, combined with rising concerns over worker safety, is accelerating the adoption of autonomous vehicles. These vehicles not only reduce dependency on manual labor but also enhance workplace safety by minimizing exposure to hazardous port environments. With growing regulatory emphasis on occupational safety and increasing compensation costs due to accidents or inefficiencies, port operators are turning to driverless technologies. The ability of autonomous vehicles to operate in adverse conditions with consistent precision adds further value, especially in large commercial and industrial ports.

  • For instance, Westwell’s autonomous “Q-Truck” fleet deployed at Qatar’s Hamad Port completed over 80,000 unmanned operating hours and conducted over 370,000 autonomous container movements without a single safety incident, demonstrating its effectiveness in high-risk, labor-deficient environments.

Government Initiatives and Smart Port Investments

Government-led smart port initiatives and funding for infrastructure modernization are providing a robust foundation for the expansion of the Ports Autonomous Vehicles market. Public-private partnerships and national strategies in regions like Asia-Pacific and Europe are driving investments in digital port infrastructure, including AI, IoT, and autonomous transport systems. These initiatives aim to strengthen port competitiveness, reduce emissions, and meet sustainability goals. Additionally, favorable regulatory environments and pilot projects for autonomous logistics solutions are encouraging port operators to scale adoption beyond pilot phases into full-scale commercial deployment.

Key Trends & Opportunities

Integration of AI and IoT for Real-Time Operations

The integration of Artificial Intelligence (AI) and Internet of Things (IoT) technologies in autonomous port vehicles is emerging as a major trend, enabling real-time decision-making and predictive maintenance. These technologies enhance vehicle navigation, route optimization, and equipment coordination within the port ecosystem. Ports are increasingly adopting smart systems to monitor performance, reduce energy consumption, and automate logistics workflows. This trend is opening new opportunities for technology providers and port operators to collaborate on creating intelligent, connected, and scalable port environments for future-ready operations.

  • For instance, Fabu.AI’s autonomous driving system, deployed in port logistics, uses AI-powered sensor fusion and IoT connectivity to achieve a system response time of under 20 milliseconds and supports real-time V2X (vehicle-to-everything) communication over 5G networks, ensuring precise coordination and safe maneuvering in dynamic port environments.

Expansion of Electrified Autonomous Fleets

The transition toward sustainable port operations is giving rise to electrified autonomous vehicle fleets. As environmental regulations tighten and carbon neutrality targets gain prominence, ports are investing in electric-powered autonomous trucks, cranes, and AGVs. These vehicles help reduce emissions while maintaining high efficiency in container handling and transport. Opportunities are emerging for OEMs and software developers to design solutions that combine electric mobility with autonomy. This convergence of sustainability and automation is shaping a new generation of eco-friendly and intelligent port vehicles.

  • For instance, BYD’s electric terminal tractor (model Q1), deployed at Yantian Port, can tow up to 75 tons, runs over 100 km on a single charge, and has been integrated into autonomous port logistics chains through AI-based fleet coordination systems, supporting large-scale green port operations.

Key Challenges

High Capital Investment Requirements

The substantial initial investment required for deploying autonomous vehicles in ports remains a major barrier, particularly for small and mid-sized port facilities. Costs associated with vehicle acquisition, infrastructure upgrades, connectivity, and system integration can be prohibitive. Return on investment may take years to materialize, depending on cargo volume and operational scale. This financial burden discourages widespread adoption and creates dependency on government subsidies or long-term strategic funding, slowing down market penetration in less developed or cost-sensitive regions.

Cybersecurity and System Reliability Risks

The increasing reliance on networked autonomous systems makes ports vulnerable to cybersecurity threats and operational failures. Autonomous vehicles depend on continuous data exchange, GPS, and AI-based decision-making, all of which are susceptible to hacking, signal interference, or software malfunctions. Any breach or failure can disrupt port operations, cause accidents, or lead to data loss. Ensuring robust cybersecurity frameworks, redundancy protocols, and regular system audits are essential, but add to operational complexity and costs—posing a significant challenge to scalability and reliability.

Regulatory and Standardization Gaps

Lack of universal regulations and standards for autonomous vehicle deployment in port environments continues to hinder cross-border and multi-port scalability. Regulations often vary by country and port authority, leading to inconsistencies in implementation, compliance costs, and testing procedures. Additionally, certification processes and liability concerns in case of accidents or system failures remain unresolved. Without clear global guidelines and harmonized safety protocols, the industry faces delays in large-scale rollouts, despite technological readiness.

Regional Analysis

North America

North America accounted for a significant portion of the Ports Autonomous Vehicles market, with a market size of USD 131.20 million in 2018, rising to USD 277.85 million in 2024, and projected to reach USD 1,212.38 million by 2032, growing at a CAGR of 18.9%. In 2024, the region holds approximately 18.7% of the global market share. This growth is driven by rapid adoption of smart port technologies, strong R&D infrastructure, and the presence of leading autonomous tech firms. U.S. and Canadian ports are focusing on efficiency, safety, and labor shortage solutions, further accelerating market expansion.

Europe

Europe is a key region in the Ports Autonomous Vehicles market, with the market valued at USD 202.55 million in 2018, increasing to USD 424.16 million in 2024, and expected to reach USD 1,735.70 million by 2032, growing at a CAGR of 17.9%. The region represents around 28.5% of the global market share in 2024. This growth is fueled by strong regulatory support for automation, sustainability goals, and investments in modernizing port infrastructure. Countries like Germany, the Netherlands, and the U.K. are leading the charge in integrating autonomous systems into port operations to enhance competitiveness.

Asia Pacific

Asia Pacific dominates the Ports Autonomous Vehicles market with the largest share, accounting for approximately 44.1% of the global market in 2024. The market was valued at USD 291.74 million in 2018, reached USD 656.86 million in 2024, and is projected to hit USD 3,026.17 million by 2032, growing at a CAGR of 19.7%. This robust growth is driven by massive port volumes, strong government support for automation, and rapid adoption of AI and robotics. China, Japan, and South Korea are investing heavily in smart port development, making the region a global hub for autonomous vehicle integration in port environments.

Latin America

Latin America’s Ports Autonomous Vehicles market is gradually expanding, growing from USD 32.33 million in 2018 to USD 69.26 million in 2024, and anticipated to reach USD 265.68 million by 2032, with a CAGR of 17.0%. The region holds a modest 4.7% market share in 2024. Key ports in Brazil, Chile, and Mexico are adopting automation to improve operational efficiency and reduce costs. Though adoption is slower compared to developed regions, increasing investments in digital infrastructure and international trade logistics are expected to drive future growth in this emerging market.

Middle East

The Middle East Ports Autonomous Vehicles market was valued at USD 18.00 million in 2018, increased to USD 35.46 million in 2024, and is projected to reach USD 127.94 million by 2032, growing at a CAGR of 16.0%. It holds approximately 2.4% of the global market share in 2024. Growth is supported by strategic initiatives to develop smart logistics hubs, particularly in the UAE and Saudi Arabia. These nations are investing in port automation as part of broader economic diversification efforts. However, the market still faces challenges related to infrastructure readiness and technology adoption speed.

Africa

Africa’s Ports Autonomous Vehicles market remains in the early stages of development, with a market size of USD 10.25 million in 2018, growing to USD 24.65 million in 2024, and expected to reach USD 84.41 million by 2032, at a CAGR of 15.3%. It represents the smallest share globally, with around 1.7% market share in 2024. While major ports in South Africa and Nigeria show interest in automation, limited funding, infrastructure gaps, and regulatory hurdles continue to restrict widespread adoption. Nonetheless, opportunities exist for public-private partnerships and international collaboration to modernize port operations across the continent.

Ports Autonomous Vehicles Market segmentation

Market Segmentations:

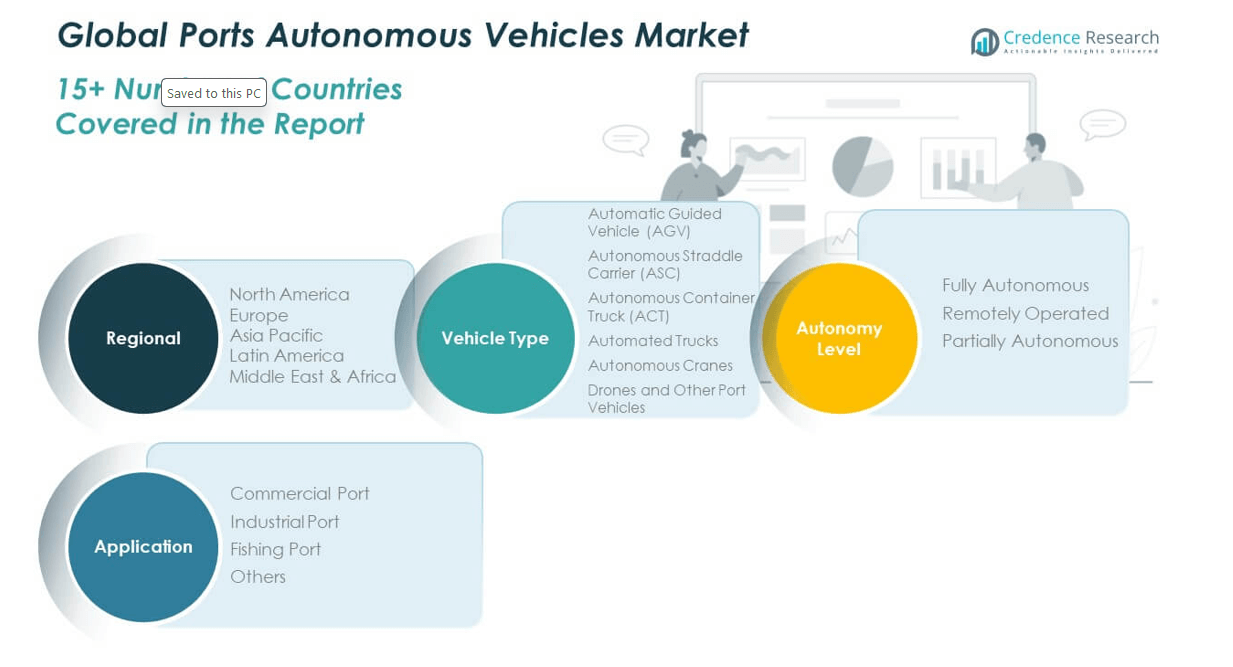
By Vehicle Type

  • Automatic Guided Vehicle (AGV)
  • Autonomous Straddle Carrier (ASC)
  • Autonomous Container Truck (ACT)
  • Automated Trucks
  • Autonomous Cranes
  • Drones and Other Port Vehicles

By Autonomy Level

  • Fully Autonomous
  • Remotely Operated
  • Partially Autonomous

By Application

  • Commercial Port
  • Industrial Port
  • Fishing Port
  • Others

By Geography:

  • North America
    • U.S.
    • Canada
    • Mexico
  • Europe
    • Germany
    • France
    • U.K.
    • Italy
    • Spain
    • Rest of Europe
  • Asia Pacific
    • China
    • Japan
    • India
    • South Korea
    • South-east Asia
    • Rest of Asia Pacific
  • Latin America
    • Brazil
    • Argentina
    • Rest of Latin America
  • Middle East & Africa
    • GCC Countries
    • South Africa
    • Rest of the Middle East and Africa

Competitive Landscape

The competitive landscape of the Ports Autonomous Vehicles market is characterized by a mix of established industrial automation giants and innovative technology startups, all striving to capture a share of the growing demand for port automation. Companies such as Westwell Lab, ZPMC (Shanghai Zhenhua Heavy Industries), and TuSimple are leading the market with advanced autonomous vehicle solutions, strong R&D capabilities, and extensive port deployment experience. Meanwhile, emerging players like Beijing Trunk Technology, Fabu.Ai, and Deeproute.Ai are focusing on AI-powered navigation, sensor technologies, and system integration to enhance the efficiency of autonomous port operations. Strategic partnerships, government-supported pilot projects, and global expansion initiatives are key competitive strategies. Additionally, companies are leveraging data analytics, electrification, and connectivity to offer comprehensive smart port solutions. As the market matures, competition is expected to intensify, particularly in regions investing heavily in digital port infrastructure, such as Asia-Pacific and Europe, prompting continuous innovation and service differentiation.

Shape Your Report to Specific Countries or Regions & Enjoy 30% Off!

Key Player Analysis

  • Westwell Lab
  • Beijing Trunk Technology
  • Ai
  • Plusgo
  • Auto
  • Ai
  • TuSimple
  • ZPMC (Shanghai Zhenhua Heavy Industries)
  • Sany Marine Heavy Industry

Recent Developments

  • In June 2025, Westwell unveiled its next-generation E-Truck S2 and flagship autonomous Q-Truck at TOC Europe 2025. The E-Truck S2 is a fully electric, autonomous-ready heavy-duty vehicle with an advanced AI-VCU and a next-gen steer-by-wire chassis. The Q-Truck, already in use at global ports, features a unique multi-task perception engine and Transformer-based decision-making. Additionally, Westwell introduced the ReeWell dispatch platform to support its intelligent logistics strategy.
  • In March 2025, Deeproute.ai was recognized as a key innovator in sensor fusion technology for autonomous container trucks (ACTs). This recognition highlights their work in enhancing self-driving perception and reducing accident risks, particularly in the complex environment of crowded ports.
  • In April 2025, TuSimple is continuing to deploy its Level 4 autonomous trucking solutions, leveraging NVIDIA DRIVE Orin™ for advanced autonomous domain control in both long-haul and port logistics. This involves utilizing AI-driven technology to enable autonomous driving capabilities in these specific sectors.
  • In May 2022, TuSimple announced a delay in the commercialization of its purpose-built autonomous trucks to 2025, relying instead on retrofitted Navistar trucks for expanding driverless routes, including port logistic.

Market Concentration & Characteristics

The Ports Autonomous Vehicles Market exhibits a moderately concentrated structure, with a mix of established automation firms and emerging technology providers shaping the competitive dynamics. Key players such as Westwell Lab, ZPMC, TuSimple, and Beijing Trunk Technology dominate with strong portfolios in AI-powered mobility and integration capabilities. It features high entry barriers due to capital-intensive infrastructure, complex regulatory compliance, and the need for advanced software-hardware integration. The market favors players with expertise in AI, robotics, and smart logistics systems. Innovation cycles are fast, driven by port authorities’ growing interest in reducing labor dependence and improving turnaround time. Adoption remains strongest in high-volume commercial ports with the capacity to invest in full-scale automation. It is influenced heavily by regional policy frameworks and investment readiness, with Asia Pacific leading due to large-scale port modernization projects. Product differentiation depends on operational reliability, scalability, and alignment with sustainability goals. The market continues to evolve alongside broader smart port development strategies.

Report Coverage

The research report offers an in-depth analysis based on Vehicle Type, Autonomy Level, Application and Geography. It details leading market players, providing an overview of their business, product offerings, investments, revenue streams, and key applications. Additionally, the report includes insights into the competitive environment, SWOT analysis, current market trends, as well as the primary drivers and constraints. Furthermore, it discusses various factors that have driven market expansion in recent years. The report also explores market dynamics, regulatory scenarios, and technological advancements that are shaping the industry. It assesses the impact of external factors and global economic changes on market growth. Lastly, it provides strategic recommendations for new entrants and established companies to navigate the complexities of the market.

Future Outlook

  1. The market will continue to grow steadily due to rising demand for efficient and automated port operations.
  2. Asia Pacific will maintain its leadership position with large-scale adoption of autonomous technologies.
  3. Autonomous Guided Vehicles will remain the most widely used vehicle type across major ports.
  4. Fully autonomous systems will see wider deployment as technology matures and reliability improves.
  5. Commercial ports will invest more in automation to reduce operational costs and labor dependency.
  6. Integration of AI, IoT, and data analytics will enhance navigation, coordination, and performance monitoring.
  7. Governments and port authorities will launch more smart port initiatives to modernize infrastructure.
  8. Partnerships between technology providers and port operators will drive innovation and deployment.
  9. The adoption of electric-powered autonomous vehicles will rise in response to sustainability goals.
  10. Regulatory clarity and standardization will become key enablers for global market expansion.

CHAPTER NO. 1 : GENESIS OF THE MARKET    

1.1 Market Prelude – Introduction & Scope

1.2 The Big Picture – Objectives & Vision

1.3 Strategic Edge – Unique Value Proposition

1.4 Stakeholder Compass – Key Beneficiaries

CHAPTER NO. 2 : EXECUTIVE LENS

2.1 Pulse of the Industry – Market Snapshot

2.2 Growth Arc – Revenue Projections (USD Million)

2.3. Premium Insights – Based on Primary Interviews

CHAPTER NO. 3 : PORTS AUTONOMOUS VEHICLES MARKET FORCES & INDUSTRY PULSE

3.1 Foundations of Change – Market Overview
3.2 Catalysts of Expansion – Key Market Drivers
3.2.1 Momentum Boosters – Growth Triggers
3.2.2 Innovation Fuel – Disruptive Technologies
3.3 Headwinds & Crosswinds – Market Restraints
3.3.1 Regulatory Tides – Compliance Challenges
3.3.2 Economic Frictions – Inflationary Pressures
3.4 Untapped Horizons – Growth Potential & Opportunities
3.5 Strategic Navigation – Industry Frameworks
3.5.1 Market Equilibrium – Porter’s Five Forces
3.5.2 Ecosystem Dynamics – Value Chain Analysis
3.5.3 Macro Forces – PESTEL Breakdown

3.6 Price Trend Analysis

    3.6.1 Regional Price Trend
3.6.2 Price Trend by Produc

CHAPTER NO. 4 : KEY INVESTMENT EPICENTER        

4.1 Regional Goldmines – High-Growth Geographies

4.2 Product Frontiers – Lucrative Product Categories

4.3 Application Sweet Spots – Emerging Demand Segments

CHAPTER NO. 5: REVENUE TRAJECTORY & WEALTH MAPPING

5.1 Momentum Metrics – Forecast & Growth Curves

5.2 Regional Revenue Footprint – Market Share Insights

5.3 Segmental Wealth Flow – Vehicle Type & Autonomy Level Revenue

CHAPTER NO. 6 : TRADE & COMMERCE ANALYSIS    

6.1.      Import Analysis by Region

6.1.1.    Global Ports Autonomous Vehicles Market Import Volume By Region

6.2.      Export Analysis by Region

6.2.1.    Global Ports Autonomous Vehicles Market Export Volume By Region

CHAPTER NO. 7 : COMPETITION ANALYSIS      

7.1.      Company Market Share Analysis

7.1.1.    Global Ports Autonomous Vehicles Market: Company Market Share

7.1.      Global Ports Autonomous Vehicles Market Company Volume Market Share

7.2.      Global Ports Autonomous Vehicles Market Company Revenue Market Share

7.3.      Strategic Developments

7.3.1.    Acquisitions & Mergers

7.3.2.    New Product Launch

7.3.3.    Regional Expansion

7.4.      Competitive Dashboard

7.5.    Company Assessment Metrics, 2024

CHAPTER NO. 8 : PORTS AUTONOMOUS VEHICLES MARKET – BY VEHICLE TYPE SEGMENT ANALYSIS

8.1.      Ports Autonomous Vehicles Market Overview by Vehicle Type Segment

8.1.1.    Ports Autonomous Vehicles Market Volume Share By Vehicle Type

8.1.2.    Ports Autonomous Vehicles Market Revenue Share By Vehicle Type

8.2.      Automatic Guided Vehicle (AGV)

8.3.      Autonomous Straddle Carrier (ASC)

8.4.      Autonomous Container Truck (ACT)

8.5.      Automated Trucks

8.6.      Autonomous Cranes

8.7.      Drones and Other Port Vehicles

CHAPTER NO. 9 : PORTS AUTONOMOUS VEHICLES MARKET – BY AUTONOMY LEVEL SEGMENT ANALYSIS

9.1.      Ports Autonomous Vehicles Market Overview by Autonomy Level Segment

9.1.1.    Ports Autonomous Vehicles Market Volume Share By Autonomy Level

9.1.2.    Ports Autonomous Vehicles Market Revenue Share By Autonomy Level

9.2.      Fully Autonomous

9.3.      Remotely Operated

9.4.      Partially Autonomous

CHAPTER NO. 10 : PORTS AUTONOMOUS VEHICLES MARKET – BY APPLICATION SEGMENT ANALYSIS

10.1.     Ports Autonomous Vehicles Market Overview by Application Segment

10.1.1.  Ports Autonomous Vehicles Market Volume Share By Application

10.1.2.  Ports Autonomous Vehicles Market Revenue Share By Application

10.2.     Commercial Port

10.3.     Industrial Port

10.4.     Fishing Port

10.5.     Others

CHAPTER NO. 11 : PORTS AUTONOMOUS VEHICLES MARKET – REGIONAL ANALYSIS     

11.1.     Ports Autonomous Vehicles Market Overview by Region Segment

11.1.1.  Global Ports Autonomous Vehicles Market Volume Share By Region

11.1.2.  Global Ports Autonomous Vehicles Market Revenue Share By Region

11.1.3.  Regions

11.1.4.  Global Ports Autonomous Vehicles Market Volume By Region

11.1.5.  Global Ports Autonomous Vehicles Market Revenue By Region

11.1.6.  Vehicle Type

11.1.7.  Global Ports Autonomous Vehicles Market Volume By Vehicle Type

11.1.8.  Global Ports Autonomous Vehicles Market Revenue By Vehicle Type

11.1.9.  Autonomy Level

11.1.10. Global Ports Autonomous Vehicles Market Volume By Autonomy Level

11.1.11. Global Ports Autonomous Vehicles Market Revenue By Autonomy Level

11.1.12. Application

11.1.13. Global Ports Autonomous Vehicles Market Volume By Application

11.1.14. Global Ports Autonomous Vehicles Market Revenue By Application

CHAPTER NO. 12 : NORTH AMERICA PORTS AUTONOMOUS VEHICLES MARKET – COUNTRY ANALYSIS 

12.1.     North America Ports Autonomous Vehicles Market Overview by Country Segment

12.1.1.  North America Ports Autonomous Vehicles Market Volume Share By Region

12.1.2.  North America Ports Autonomous Vehicles Market Revenue Share By Region

12.2.     North America

12.2.1.  North America Ports Autonomous Vehicles Market Volume By Country

12.2.2.  North America Ports Autonomous Vehicles Market Revenue By Country

12.2.3.  Vehicle Type

12.2.4.  North America Ports Autonomous Vehicles Market Volume By Vehicle Type

12.2.5.  North America Ports Autonomous Vehicles Market Revenue By Vehicle Type

12.2.6.  Autonomy Level

12.2.7.  North America Ports Autonomous Vehicles Market Volume By Autonomy Level

12.2.8.  North America Ports Autonomous Vehicles Market Revenue By Autonomy Level

12.2.9.  Application

12.2.10. North America Ports Autonomous Vehicles Market Volume By Application

12.2.11. North America Ports Autonomous Vehicles Market Revenue By Application

12.3.     U.S.

12.4.     Canada

12.5.     Mexico

CHAPTER NO. 13 : EUROPE PORTS AUTONOMOUS VEHICLES MARKET – COUNTRY ANALYSIS

13.1.     Europe Ports Autonomous Vehicles Market Overview by Country Segment

13.1.1.  Europe Ports Autonomous Vehicles Market Volume Share By Region

13.1.2.  Europe Ports Autonomous Vehicles Market Revenue Share By Region

13.2.     Europe

13.2.1.  Europe Ports Autonomous Vehicles Market Volume By Country

13.2.2.  Europe Ports Autonomous Vehicles Market Revenue By Country

13.2.3.  Vehicle Type

13.2.4.  Europe Ports Autonomous Vehicles Market Volume By Vehicle Type

13.2.5.  Europe Ports Autonomous Vehicles Market Revenue By Vehicle Type

13.2.6.  Autonomy Level

13.2.7.  Europe Ports Autonomous Vehicles Market Volume By Autonomy Level

13.2.8.  Europe Ports Autonomous Vehicles Market Revenue By Autonomy Level

13.2.9.  Application

13.2.10. Europe Ports Autonomous Vehicles Market Volume By Application

13.2.11. Europe Ports Autonomous Vehicles Market Revenue By Application

13.3.     UK

13.4.     France

13.5.     Germany

13.6.     Italy

13.7.     Spain

13.8.     Russia

13.9.   Rest of Europe

CHAPTER NO. 14 : ASIA PACIFIC PORTS AUTONOMOUS VEHICLES MARKET – COUNTRY ANALYSIS

14.1.     Asia Pacific Ports Autonomous Vehicles Market Overview by Country Segment

14.1.1.  Asia Pacific Ports Autonomous Vehicles Market Volume Share By Region

14.1.2.  Asia Pacific Ports Autonomous Vehicles Market Revenue Share By Region

14.2.     Asia Pacific

14.2.1.  Asia Pacific Ports Autonomous Vehicles Market Volume By Country

14.2.2.  Asia Pacific Ports Autonomous Vehicles Market Revenue By Country

14.2.3.  Vehicle Type

14.2.4.  Asia Pacific Ports Autonomous Vehicles Market Volume By Vehicle Type

14.2.5.  Asia Pacific Ports Autonomous Vehicles Market Revenue By Vehicle Type

14.2.6.  Autonomy Level

14.2.7.  Asia Pacific Ports Autonomous Vehicles Market Volume By Autonomy Level

14.2.8.  Asia Pacific Ports Autonomous Vehicles Market Revenue By Autonomy Level

14.2.9.  Application

14.2.10. Asia Pacific Ports Autonomous Vehicles Market Volume By Application

14.2.11. Asia Pacific Ports Autonomous Vehicles Market Revenue By Application

14.3.     China

14.4.     Japan

14.5.     South Korea

14.6.     India

14.7.     Australia

14.8.     Southeast Asia

14.9.     Rest of Asia Pacific

CHAPTER NO. 15 : LATIN AMERICA PORTS AUTONOMOUS VEHICLES MARKET – COUNTRY ANALYSIS

15.1.     Latin America Ports Autonomous Vehicles Market Overview by Country Segment

15.1.1.  Latin America Ports Autonomous Vehicles Market Volume Share By Region

15.1.2.  Latin America Ports Autonomous Vehicles Market Revenue Share By Region

15.2.     Latin America

15.2.1.  Latin America Ports Autonomous Vehicles Market Volume By Country

15.2.2.  Latin America Ports Autonomous Vehicles Market Revenue By Country

15.2.3.  Vehicle Type

15.2.4.  Latin America Ports Autonomous Vehicles Market Volume By Vehicle Type

15.2.5.  Latin America Ports Autonomous Vehicles Market Revenue By Vehicle Type

15.2.6.  Autonomy Level

15.2.7.  Latin America Ports Autonomous Vehicles Market Volume By Autonomy Level

15.2.8.  Latin America Ports Autonomous Vehicles Market Revenue By Autonomy Level

15.2.9.  Application

15.2.10. Latin America Ports Autonomous Vehicles Market Volume By Application

15.2.11. Latin America Ports Autonomous Vehicles Market Revenue By Application

15.3.     Brazil

15.4.     Argentina

15.5.     Rest of Latin America

CHAPTER NO. 16 : MIDDLE EAST PORTS AUTONOMOUS VEHICLES MARKET – COUNTRY ANALYSIS

16.1.     Middle East Ports Autonomous Vehicles Market Overview by Country Segment

16.1.1.  Middle East Ports Autonomous Vehicles Market Volume Share By Region

16.1.2.  Middle East Ports Autonomous Vehicles Market Revenue Share By Region

16.2.     Middle East

16.2.1.  Middle East Ports Autonomous Vehicles Market Volume By Country

16.2.2.  Middle East Ports Autonomous Vehicles Market Revenue By Country

16.2.3.  Vehicle Type

16.2.4.  Middle East Ports Autonomous Vehicles Market Volume By Vehicle Type

16.2.5.  Middle East Ports Autonomous Vehicles Market Revenue By Vehicle Type

16.2.6.  Autonomy Level

16.2.7.  Middle East Ports Autonomous Vehicles Market Volume By Autonomy Level

16.2.8.  Middle East Ports Autonomous Vehicles Market Revenue By Autonomy Level

16.2.9.  Application

16.2.10. Middle East Ports Autonomous Vehicles Market Volume By Application

16.2.11. Middle East Ports Autonomous Vehicles Market Revenue By Application

16.3.     GCC Countries

16.4.     Israel

16.5.     Turkey

16.6.     Rest of Middle East

CHAPTER NO. 17 : AFRICA PORTS AUTONOMOUS VEHICLES MARKET – COUNTRY ANALYSIS

17.1.     Africa Ports Autonomous Vehicles Market Overview by Country Segment

17.1.1.  Africa Ports Autonomous Vehicles Market Volume Share By Region

17.1.2.  Africa Ports Autonomous Vehicles Market Revenue Share By Region

17.2.     Africa

17.2.1.  Africa Ports Autonomous Vehicles Market Volume By Country

17.2.2.  Africa Ports Autonomous Vehicles Market Revenue By Country

17.2.3.  Vehicle Type

17.2.4.  Africa Ports Autonomous Vehicles Market Volume By Vehicle Type

17.2.5.  Africa Ports Autonomous Vehicles Market Revenue By Vehicle Type

17.2.6.  Autonomy Level

17.2.7.  Africa Ports Autonomous Vehicles Market Volume By Autonomy Level

17.2.8.  Africa Ports Autonomous Vehicles Market Revenue By Autonomy Level

17.2.9.  Application

17.2.10. Africa Ports Autonomous Vehicles Market Volume By Application

17.2.11. Africa Ports Autonomous Vehicles Market Revenue By Application

17.3.     South Africa

17.4.     Egypt

17.5.     Rest of Africa

CHAPTER NO. 18 : COMPANY PROFILES

18.1.     Westwell Lab

18.1.1.  Company Overview

18.1.2.  Product Portfolio

18.1.3.  Financial Overview

18.1.4.  Recent Developments

18.1.5.  Growth Strategy

18.1.6.  SWOT Analysis

18.2.     Beijing Trunk Technology

18.3.     Fabu.Ai

18.4.     Plusgo

18.5.     Senior.Auto

18.6.     Deeproute.Ai

18.7.     TuSimple

18.8.     ZPMC (Shanghai Zhenhua Heavy Industries)

18.9.     Sany Marine Heavy Industry

Request Free Sample

Ready to Transform Data into Decisions?

Request Your Sample Report and Start Your Journey of Informed Choices


Providing the strategic compass for industry titans.

cr-clients-logos

Frequently Asked Questions

What is the current size of the Ports Autonomous Vehicles Market?

The market size reached USD 1,488.23 million in 2024 and is projected to reach USD 6,452.27 million by 2032, growing at a CAGR of 18.77%.

What are the key segments within the Ports Autonomous Vehicles Market?

The market is segmented by Vehicle Type, Autonomy Level, Application, and Geography.

What are some challenges faced by the Ports Autonomous Vehicles Market?

High capital investment, cybersecurity threats, and lack of regulatory standardization are major challenges.

Who are the major players in the Ports Autonomous Vehicles Market?

Key players include Westwell Lab, ZPMC, TuSimple, Beijing Trunk Technology, and Fabu.Ai.

About Author

Ganesh Chandwade

Ganesh Chandwade

Senior Industry Consultant

Ganesh is a senior industry consultant specializing in heavy industries and advanced materials.

View Profile

Related Reports

Second-Hand Fashion Market

The Second-Hand Fashion Market was valued at USD 190 billion in 2024 and is projected to reach USD 422.3 billion by 2032, expanding at a CAGR of 10.5% during the forecast period.

Passenger Tire Market

The Passenger Tire Market was valued at USD 156.1 billion in 2024 and is projected to reach USD 210.3 billion by 2032, expanding at a CAGR of 3.8% during the forecast period.

Passenger Vehicles Market

The Passenger Vehicles Market was valued at USD 1705.2 billion in 2024 and is anticipated to reach USD 2805.1 billion by 2032, growing at a CAGR of 6.42% during the forecast period.

Operator Training Simulator Market

Operator Training Simulator Market size was valued at USD 12.4 billion in 2024 and is anticipated to reach USD 35.7 billion by 2032, at a CAGR of 14.1% during the forecast period.

UK Anesthesia Breathing Filters Market

The UK Anesthesia Breathing Filters Market size was valued at USD 3.75 million in 2018 to USD 4.68 million in 2024 and is anticipated to reach USD 6.35 million by 2032, at a CAGR of 3.60% during the forecast period.

Secure Logistics Market

Secure Logistics Market size was valued at USD 88 billion in 2024 and is anticipated to reach USD 136.2 billion by 2032, at a CAGR of 5.62% during the forecast period.

Zeolite Molecular Sieve Market

The Zeolite Molecular Sieve Market size was valued at USD 4609.8 million in 2024 and is anticipated to reach USD 7744.6 million by 2032, at a CAGR of 6.7% during the forecast period (2024-2032).

Non-Alcoholic Beer Market

The Non-Alcoholic Beer Market size was valued at USD 19 million in 2024 and is projected to reach USD 34.4 million by 2032, expanding at a CAGR of 7.7% during the forecast period.

Non-Alcoholic RTD Beverages Market

The Non-Alcoholic RTD Beverages Market was valued at USD 760.6 million in 2024 and is anticipated to reach USD 1178 million by 2032, growing at a CAGR of 5.62% during the forecast period.

Purchase Options

The report comes as a view-only PDF document, optimized for individual clients. This version is recommended for personal digital use and does not allow printing. Use restricted to one purchaser only.
$4999

To meet the needs of modern corporate teams, our report comes in two formats: a printable PDF and a data-rich Excel sheet. This package is optimized for internal analysis. Unlimited users allowed within one corporate location (e.g., regional office).
$6999

The report will be delivered in printable PDF format along with the report’s data Excel sheet. This license offers 100 Free Analyst hours where the client can utilize Credence Research Inc. research team. Permitted for unlimited global use by all users within the purchasing corporation, such as all employees of a single company.
$12999

Credence Staff 3

WILLIAM, North America

Support Staff at Credence Research

KEITH PHILLIPS, Europe

Lee - CR Sales Staff

LEE VALLANCE, Asia Pacific

Kieran Jameson

KIERAN JAMESON, Australia

Report delivery within 24 to 48 hours

User Review

Thank you for the data! The numbers are exactly what we asked for and what we need to build our business case.

Materials Scientist
(privacy requested)

User Review

The report was an excellent overview of the Industrial Burners market. This report does a great job of breaking everything down into manageable chunks.

Imre Hof
Management Assistant, Bekaert

cr-clients-logos

Request Sample