
Market Overview
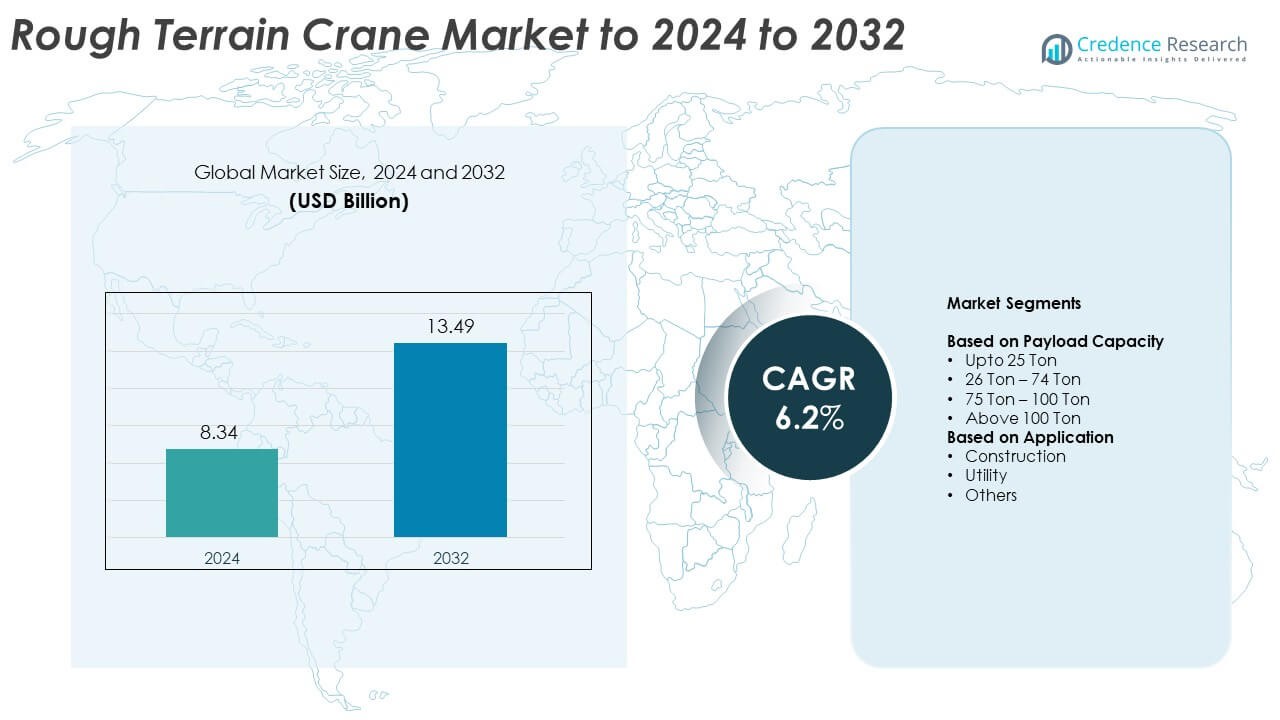
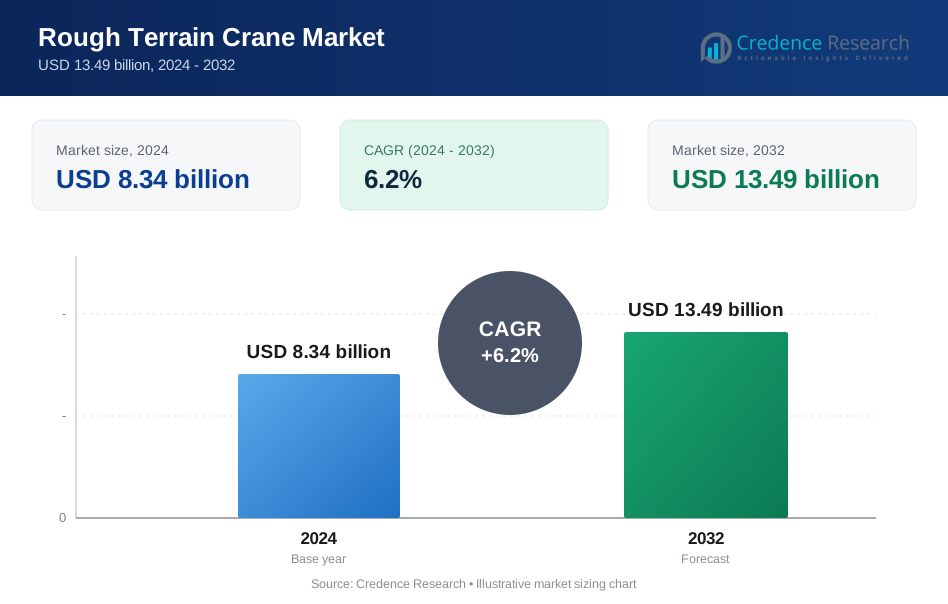
The Rough Terrain Crane Market size was valued at USD 8.34 billion in 2024 and is anticipated to reach USD 13.49 billion by 2032, at a CAGR of 6.2% during the forecast period.
| REPORT ATTRIBUTE | DETAILS |
|---|---|
| Historical Period | 2020-2023 |
| Base Year | 2024 |
| Forecast Period | 2025-2032 |
| Rough Terrain Crane Market Size 2024 | USD 8.34 Billion |
| Rough Terrain Crane Market, CAGR | 6.2% |
| Rough Terrain Crane Market Size 2032 | USD 13.49 Billion |
The rough terrain crane market is led by major players such as Tadano Ltd, Liebherr Group, Terex Corporation, SANY Group, Manitowoc Company, Konecranes, Zoomlion, Manitex International, Xuzhou Construction Machinery Group Co, TIL Limited, and KATO WORKS CO LTD. These companies compete through continuous innovation, strong distribution networks, and diverse product portfolios. North America emerged as the leading region in 2024, commanding a 37.2% market share, supported by large-scale infrastructure and energy projects. Asia-Pacific followed with 28.9%, driven by industrialization and government-funded construction programs, while Europe maintained a stable position through technological advancements and sustainability-focused crane manufacturing.
Market Insights
- The rough terrain crane market was valued at USD 8.34 billion in 2024 and is expected to reach USD 13.49 billion by 2032, growing at a CAGR of 6.2%.
- Growth is primarily driven by rising infrastructure development, energy projects, and industrial construction across developed and emerging regions.
- Advancements in telematics, automation, and hybrid power systems are shaping modern crane designs, improving operational efficiency and sustainability.
- The market remains competitive with leading players focusing on product innovation, regional expansion, and rental service growth to strengthen their positions.
- North America held the largest regional share of 37.2% in 2024, followed by Asia-Pacific with 28.9%, while the 26–74 ton payload capacity segment dominated globally with a 43.6% share, reflecting strong demand for versatile, mid-capacity cranes used in construction and energy applications.
Market Segmentation Analysis:
By Payload Capacity
The 26–74 ton segment dominated the rough terrain crane market in 2024, accounting for a 43.6% share. Its leadership is driven by strong demand for mid-capacity lifting solutions across industrial, construction, and energy sectors. These cranes provide an ideal balance between maneuverability and lifting power, supporting complex infrastructure and refinery projects. Increasing deployment in port maintenance and bridge construction has reinforced segment dominance. Companies such as Tadano and Liebherr are advancing medium-capacity models with enhanced telematics and low-emission engines to improve performance and sustainability.
- For instance, Tadano’s GR-800XL-4 is rated 72.6 t with a 12–47 m boom and 64.4 m max tip height.
By Application
The construction segment held the largest share of 59.4% in 2024, fueled by ongoing urbanization and infrastructure expansion across emerging economies. Rough terrain cranes are preferred for handling heavy materials efficiently in confined and uneven construction sites. Their high mobility and fast setup times make them essential for road, bridge, and commercial building projects. Rising investments in renewable energy and smart city developments are further accelerating adoption. Manufacturers such as Terex and Zoomlion are focusing on compact, high-lift cranes designed for improved onsite versatility and operator safety.
- For instance, Zoomlion ZRT1100 rough-terrain crane is that it is rated for a maximum lifting capacity of 110 tonnes, with a five-section main boom that extends to a maximum length of 49 meters.
Key Growth Drivers
Infrastructure Expansion and Urbanization
Rapid infrastructure development across emerging economies is a major growth catalyst for the rough terrain crane market. Rising investments in highways, bridges, metro systems, and renewable energy installations are boosting equipment demand. Governments in Asia-Pacific and the Middle East are prioritizing transportation modernization, leading to steady procurement of high-capacity cranes. These cranes enable efficient material handling in constrained sites and rough landscapes, making them indispensable for urban and industrial construction projects.
- For instance, Liebherr’s LRT 1100-2.1 is HVO-ready and can cut CO₂ emissions “up to 90%” during operation.
Rising Demand from Energy and Utility Projects
The growing number of power generation, oil & gas, and wind energy projects significantly supports market growth. Rough terrain cranes are preferred for their ability to operate in uneven terrain during equipment installation and maintenance. The ongoing transition toward renewable energy, including wind and solar farms, has expanded the utility sector’s crane needs. Global energy infrastructure upgrades and refineries modernization are further propelling adoption, especially in North America and the Middle East.
- For instance, SANY’s SRC900T offers 90 t max capacity, 47 m boom, and 65.5 m max lifting height for energy sites.
Technological Advancements in Crane Design
Continuous innovation in lifting technology and machine automation is driving equipment efficiency and safety. Integration of load monitoring systems, telematics, and advanced hydraulic controls has improved precision and reliability in lifting operations. Manufacturers are also focusing on hybrid power systems and low-emission engines to meet environmental standards. These advancements enhance crane productivity, reduce maintenance downtime, and extend operational life, making technologically advanced models more attractive to contractors and equipment rental companies.
Key Trends & Opportunities
Adoption of Telematics and IoT Integration
The growing adoption of telematics and IoT solutions is transforming fleet management and operational efficiency. Real-time data analytics enables remote monitoring of crane performance, fuel consumption, and predictive maintenance. Rental fleet operators are using these technologies to optimize equipment utilization and reduce unplanned downtime. The trend toward digitalized construction machinery supports greater safety compliance and asset visibility, driving demand for connected cranes across both developed and developing markets.
- For instance, Manitowoc’s Grove CONNECT enables real-time monitoring; new RTs add a 20° tilting cab and a 30 cm CCS display for operators.
Growth of Rental and Leasing Services
The rising preference for rental and leasing models presents significant opportunities for market expansion. Contractors and project developers prefer renting cranes to minimize upfront capital costs and maintenance expenses. Equipment rental companies are expanding fleets with mid and high-capacity rough terrain cranes to meet increasing construction and energy sector demand. This trend ensures wider accessibility of advanced models, especially in developing regions with limited procurement budgets.
- For instance, XCMG’s RT100 provides 100 t capacity with a 48 m main boom and 68.6 m boom-plus-jib length, fitting rental fleet needs.
Key Challenges
High Equipment Cost and Maintenance Burden
The high initial investment and maintenance requirements of rough terrain cranes pose a major challenge for small and medium contractors. Regular inspections, spare parts replacement, and specialized operator training add to operational costs. Limited resale value and high insurance expenses further impact affordability. These financial constraints often push buyers toward used or rental equipment, restraining new crane sales, particularly in cost-sensitive markets across Latin America and Africa.
Supply Chain Disruptions and Component Shortages
The global supply chain instability has led to delays in component availability and increased production costs. Shortages of steel, hydraulic parts, and electronic components affect manufacturing timelines and delivery schedules. Logistics bottlenecks and fluctuating raw material prices have pressured manufacturers to adjust pricing strategies. Prolonged disruptions in key sourcing regions continue to limit inventory availability, creating uncertainty for both producers and end users in large-scale infrastructure projects.
Regional Analysis
North America
North America held the largest share of 37.2% in the rough terrain crane market in 2024. The region’s growth is driven by strong construction activity, oil and gas exploration, and utility infrastructure projects. The United States leads demand, supported by ongoing energy transition projects and equipment replacement initiatives. Increasing investment in renewable energy and heavy industrial construction enhances the adoption of medium and high-capacity cranes. Major manufacturers, including Terex and Manitowoc, have established extensive service networks, ensuring continuous supply and aftermarket support across major metropolitan and industrial hubs.
Europe
Europe accounted for a 25.6% share of the rough terrain crane market in 2024, supported by steady infrastructure modernization and renewable energy expansion. Germany, the United Kingdom, and France remain key contributors due to high investments in road upgrades, rail transport, and offshore wind projects. Environmental regulations promoting cleaner construction equipment encourage adoption of hybrid and low-emission cranes. Increasing rental demand from large construction firms also contributes to regional market stability. Manufacturers in the region are focusing on advanced safety features and compact designs for urban project applications.
Asia-Pacific
Asia-Pacific captured a 28.9% share in 2024 and is expected to experience the fastest growth through 2032. Rapid industrialization and large-scale infrastructure development in China, India, and Japan are driving equipment demand. Expanding urban centers and government initiatives for transport and energy projects further fuel adoption. Increasing foreign investment in heavy manufacturing and petrochemical sectors is boosting crane utilization. Local production capabilities by companies like Kobelco and Tadano provide cost-effective options and improve supply chain reliability, making Asia-Pacific a key growth engine in the global market.
Latin America
Latin America represented a 5.1% share of the rough terrain crane market in 2024, primarily driven by growth in mining and energy projects. Brazil and Mexico are leading markets due to ongoing investments in oil exploration, power transmission, and infrastructure rehabilitation. Despite economic fluctuations, government-backed public works and renewable energy projects sustain moderate crane demand. The adoption of rental services is rising as contractors seek cost-efficient equipment solutions. Expanding partnerships between global manufacturers and local distributors are strengthening aftermarket service accessibility across the region.
Middle East & Africa
The Middle East & Africa accounted for a 3.2% share in 2024, supported by increasing oilfield development, urban expansion, and infrastructure investments. The Gulf countries, particularly Saudi Arabia and the UAE, continue to drive demand through large-scale construction and energy diversification projects. Africa’s emerging markets, including South Africa and Nigeria, are seeing gradual adoption in mining and road development. Government initiatives to modernize logistics infrastructure and industrial zones are further encouraging crane utilization. Strong manufacturer presence and dealership networks ensure steady equipment availability in the region.
Market Segmentations:
By Payload Capacity
- Upto 25 Ton
- 26 Ton – 74 Ton
- 75 Ton – 100 Ton
- Above 100 Ton
By Application
- Construction
- Utility
- Others
By Geography
- North America
- U.S.
- Canada
- Mexico
- Europe
- Germany
- France
- U.K.
- Italy
- Spain
- Rest of Europe
- Asia Pacific
- China
- Japan
- India
- South Korea
- South-east Asia
- Rest of Asia Pacific
- Latin America
- Brazil
- Argentina
- Rest of Latin America
- Middle East & Africa
- GCC Countries
- South Africa
- Rest of the Middle East and Africa
Competitive Landscape
The competitive landscape of the rough terrain crane market features leading manufacturers such as Tadano Ltd, Liebherr Group, Terex Corporation, SANY Group, Manitowoc Company, Konecranes, Zoomlion, Manitex International, Xuzhou Construction Machinery Group Co, TIL Limited, and KATO WORKS CO LTD. The market is characterized by continuous innovation in lifting technology, automation, and energy efficiency. Major players focus on expanding production capacities and enhancing product portfolios through strategic alliances and regional partnerships. Companies are also emphasizing after-sales services, operator training programs, and telematics integration to strengthen brand reliability. Growing demand from construction, energy, and industrial projects is pushing manufacturers to develop more compact, fuel-efficient, and environmentally compliant crane models. The rise in rental and leasing demand further encourages manufacturers to deliver durable, cost-effective solutions that meet diverse operational requirements across global markets.
Key Player Analysis
- Tadano Ltd
- Liebherr Group
- Terex Corporation
- SANY Group
- Manitowoc Company
- Konecranes
- Zoomlion
- Manitex International
- Xuzhou Construction Machinery Group Co
- TIL Limited
- KATO WORKS CO LTD
Recent Developments
- In 2024, Tadano unveiled its first electric rough-terrain crane, the eGR-1000XLL-1, in North America.
- In 2024, Konecranes unveiled its X-Series Crane with an S-Series Low Headroom Hoist at bauma CONEXPO India in Greater Noida.
- In 2023, Liebherr supplied various LRT rough-terrain cranes to clients, showcasing the existing range's popularity, particularly in the North American market.
Report Coverage
The research report offers an in-depth analysis based on Payload Capacity, Application and Geography. It details leading market players, providing an overview of their business, product offerings, investments, revenue streams, and key applications. Additionally, the report includes insights into the competitive environment, SWOT analysis, current market trends, as well as the primary drivers and constraints. Furthermore, it discusses various factors that have driven market expansion in recent years. The report also explores market dynamics, regulatory scenarios, and technological advancements that are shaping the industry. It assesses the impact of external factors and global economic changes on market growth. Lastly, it provides strategic recommendations for new entrants and established companies to navigate the complexities of the market.
Future Outlook
- The market will continue to grow steadily, driven by infrastructure and industrial expansion.
- Demand for medium-capacity cranes will remain dominant due to versatility in urban projects.
- Technological innovation will focus on telematics, automation, and fuel-efficient engines.
- Rental and leasing services will expand as companies seek cost-effective project solutions.
- Hybrid and electric-powered cranes will gain traction with stricter emission regulations.
- Asia-Pacific will emerge as the fastest-growing regional market, supported by urbanization.
- North America will maintain strong demand from energy, oil, and utility sectors.
- Manufacturers will invest in safety systems and operator-assist technologies.
- Supply chain optimization and local assembly plants will enhance product availability.
- Increased focus on sustainable materials and digital integration will shape future designs.
Request a Free Sample
Fill in your details and we'll send you a free sample report.
- Sample data tables & charts
- Research methodology
Need a Custom Version of This Report?
Tailor the scope, geography, or segments to your exact requirements.
- Custom geography or segment scope
- Direct access to our analyst team
Frequently Asked Questions
What is the current market size for Rough Terrain Crane Market, and what is its projected size in 2032?
At what Compound Annual Growth Rate is the Rough Terrain Crane Market projected to grow between 2025 and 2032?
Which Rough Terrain Crane Market segment held the largest share in 2024?
What are the primary factors fueling the growth of the Rough Terrain Crane Market?
Who are the leading companies in the Rough Terrain Crane Market?
Which region commanded the largest share of the Rough Terrain Crane Market in 2024?
Table of Content
Chapter 1. Report Introduction
- 1.1 Report Description & Purpose
- 1.1.1 Report Title & Market Definition
- 1.1.2 Unique Selling Propositions (USP) & Key Differentiators
- 1.1.3 Value Proposition for Stakeholders
- 1.2 Research Objectives
- 1.2.1 Market Sizing Objectives (Volume & Revenue)
- 1.2.2 Segmentation Objectives
- 1.2.3 Competitive Intelligence Objectives
- 1.2.4 Forecast & Scenario Objectives
- 1.3 Report Scope
- 1.3.1 Rough Terrain Crane Scope – Types & Subtypes Covered
- 1.3.2 Geographic Scope – Regions & Countries Covered
- 1.3.3 Historical Period, Base Year & Forecast Period (2024; forecast to 2032)
- 1.3.4 Inclusions & Exclusions
- 1.4 HS Code & Classification Framework
- 1.5 Currency, Units & Pricing Basis
- 1.6 Target Stakeholders
- 1.7 Limitations & Assumptions
Chapter 2. Executive Summary
- 2.1 Global Rough Terrain Crane Market Snapshot
- 2.1.1 Market Size – Historical (2024) & Forecast (2024-2032) (2024: USD 8.34 billion → 2032: USD 13.49 billion)
- 2.1.2 Volume & Revenue – Global Totals
- 2.1.3 Key Market Highlights – Top Five Facts
- 2.2 Rough Terrain Crane Market Segmentation Snapshot
- 2.2.1 Market Split by Region – 2024 vs. 2032
- 2.3 Competitive Snapshot
- 2.3.1 Top 10 Players by Revenue Share – 2024
- 2.3.2 Top 10 Players by Volume Share – 2024
- 2.3.3 Recent Strategic Developments (18-Month Summary)
- 2.4 Key Investment Highlights & Strategic Conclusions
Chapter 3. Rough Terrain Crane Market Dynamics & Industry Analysis
- 3.1 Market Overview & Context
- 3.1.1 Rough Terrain Crane Market Position in the Broader Automotive Value Chain
- 3.1.2 OEM vs. Replacement Market Dynamics
- 3.1.3 Market Maturity & Development Stage by Region
- 3.2 Rough Terrain Crane Market Drivers
- 3.3 Rough Terrain Crane Market Restraints & Challenges
- 3.4 Rough Terrain Crane Market Opportunities
- 3.5 Porter's Five Forces Analysis
- 3.5.1 Threat of New Entrants
- 3.5.2 Bargaining Power of Suppliers
- 3.5.3 Bargaining Power of Buyers
- 3.5.4 Threat of Substitutes
- 3.5.5 Competitive Rivalry – Intensity Assessment
- 3.6 Rough Terrain Crane Value Chain Analysis
- 3.6.1 Upstream – Raw Material/Input Suppliers
- 3.6.1.1 Raw Material/Input 1
- 3.6.1.2 Raw Material/Input 2
- 3.6.1.3 Raw Material/Input 3
- 3.6.2 Midstream – Production/Manufacturing/Service Delivery
- 3.6.2.1 Production/Process Overview
- 3.6.2.2 Key Facility Locations & Capacity by Manufacturer
- 3.6.3 Downstream – Distribution & End Consumer
- 3.6.3.1 Primary Channel – B2B/OEM
- 3.6.3.2 Secondary Channels – Dealer, Retail, Online, Direct
- 3.6.4 Value Chain Profitability Analysis
- 3.6.1 Upstream – Raw Material/Input Suppliers
- 3.7 PESTEL Analysis
- 3.7.1 Political Factors
- 3.7.2 Economic Factors
- 3.7.3 Social Factors
- 3.7.4 Technological Factors
- 3.7.5 Environmental Factors
- 3.7.6 Legal Factors
- 3.8 Rough Terrain Crane Supply Chain Analysis
- 3.8.1 Raw Material/Input Supply Risk Assessment
- 3.8.2 Manufacturing Concentration Risk (Geographic Exposure)
- 3.8.3 Trade Disruption Impact Analysis
- 3.9 Regulatory & Policy Landscape
Note: The regulatory and policy landscape section covers regulations based on their applicability to the market, Rough Terrain Crane category, geography, and scope of the study. Only regulatory frameworks with a material impact on operations, compliance, trade, sustainability, or market access are analyzed in detail.
Chapter 4. Key Investment Pockets & Opportunity Analysis
- 4.1 Rough Terrain Crane Market Attractiveness Analysis
- 4.1.1 By Region – Investment Attractiveness Matrix (Volume × CAGR)
- 4.2 Absolute Revenue Growth Opportunity
- 4.2.1 By Region – Absolute USD Growth Through 2032
- 4.3 Incremental Volume Opportunity
- 4.3.1 By Region – Incremental Volume Through 2032
- 4.3.2 Segment – Incremental Volume
- 4.4 Emerging Submarket Opportunity Deep Dive (Subject to Applicability)
- 4.5 Emerging Market Opportunity Scorecards
- 4.5.1 United States
- 4.5.2 Europe
- 4.5.3 Asia
- 4.5.4 Middle East & Africa
Note: Emerging Market Opportunity Scorecards will be included based on relevance and strategic importance. Regions listed are indicative and may vary depending on data availability and market dynamics.
Chapter 5. Rough Terrain Crane Import-Export Analysis & Trade Flows
- 5.1 Global Trade Overview
- 5.1.1 Global Export Value by Country (2024)
- 5.1.2 Global Export Volume by Country (2024)
- 5.1.3 Global Import Value by Country (2024)
- 5.1.4 Global Import Volume by Country (2024)
- 5.1.5 Net Trade Balance by Country (2024)
- 5.2 Export Analysis – Segment
- 5.2.1 Type 1 (HS Code)
- 5.2.2 Type 2 (HS Code)
- 5.2.3 Type 3 (HS Code)
- 5.2.4 Type 4 (HS Code)
- 5.2.5 Type 5 (HS Code)
- 5.3 Import Analysis – Segment
- 5.3.1 Type 1 (HS Code)
- 5.3.2 Type 2 (HS Code)
- 5.3.3 Type 3 (HS Code)
- 5.3.4 Type 4 (HS Code)
- 5.3.5 Type 5 (HS Code)
- 5.4 Average Unit Trade Prices
- 5.4.1 Average Export Price – Segment & Country
- 5.4.2 Average Import Price – Segment & Source Country
- 5.4.3 Price Trends (2024)
- 5.5 Key Trade Route Analysis
- 5.5.1 Trade Route 1
- 5.5.2 Trade Route 2
- 5.5.3 Trade Route 3
- 5.5.4 Trade Route 4
- 5.5.5 Trade Route 5
- 5.6 Trade Policy Impact Assessment
- 5.6.1 US Anti-Dumping & Section 301 Tariffs
- 5.6.2 EU Customs Union Impact
- 5.6.3 Major Free Trade Agreements
- 5.6.4 USMCA Rules of Origin
Note: Trade policy analysis will be included only where relevant to the Rough Terrain Crane market.
Chapter 6. Competitive Landscape & Company Benchmarking
- 6.1 Rough Terrain Crane Market Concentration & Structure
- 6.1.1 Herfindahl-Hirschman Index (HHI) – vs. 2024
- 6.1.2 Tier 1, Tier 2 & Tier 3 Market Structure
- 6.1.3 Global, Regional & Local Player Dynamics
- 6.2 Rough Terrain Crane Market Share Analysis – 2024
- 6.2.1 Global Revenue Share by Company
- 6.2.2 Global Volume Share by Company
- 6.2.3 Regional Revenue Share
- 6.2.4 Market Share Evolution ( vs. 2024)
- 6.2.5 OEM Segment Share by Company
- 6.2.6 Replacement Segment Share by Company
- 6.3 Production/Delivery Capacity & Facility Analysis
- 6.3.1 Global Installed Capacity
- 6.3.2 Capacity Utilization Rates
- 6.3.3 Production/Output Volume
- 6.3.4 Facility Locations & Capacity Map
- 6.3.5 Planned Capacity Additions
- 6.4 Rough Terrain Crane Competitive Benchmarking Matrix
- 6.4.1 Revenue, Volume, CAGR & Profitability Comparison
- 6.4.2 Channel Revenue Mix
- 6.4.3 Geographic Revenue Exposure
- 6.4.4 R&D Intensity
- 6.4.5 Sustainability Maturity
- 6.5 Strategic Developments in Rough Terrain Crane (Last 24 Months)
- 6.5.1 Mergers, Acquisitions & Divestments
- 6.5.2 New Rough Terrain Crane Launches
- 6.5.3 Facility Expansions
- 6.5.4 Strategic Alliances, Joint Ventures & Partnerships
- 6.5.5 Distribution Expansion & Market Entry
- 6.5.6 Sustainability & ESG Initiatives
- 6.6 Competitive Strategy Mapping
- 6.6.1 Leader, Challenger, Follower & Niche Classification
- 6.6.2 Pricing Strategy Comparison
- 6.6.3 Channel Strategy Matrix
Note: Strategic developments are included based on their materiality and the availability of reliable information.
Chapter 7. Global Rough Terrain Crane Market – By Distribution Channel
- 7.1 Segment Overview
- 7.1.1 Volume & Revenue Split by Channel (2024 & 2032)
- 7.1.2 Channel Mix Evolution (2024-2032)
Chapter 8. Regional Market Analysis – Global Overview
- 8.1 Global Regional Overview
- 8.1.1 Regional Volume Share
- 8.1.2 Regional Revenue Share
- 8.1.3 Regional Volume by Region
- 8.1.4 Regional Revenue by Region
- 8.1.5 Regional Forecast Through 2032
- 8.2 Cross-Regional Segment Analysis
- 8.2.1 By Distribution Channel
- 8.2.2 By Brand/Price Tier
Chapter 9. North America Rough Terrain Crane Market
- 9.1 United States
- 9.2 Canada
- 9.3 Mexico
Chapter 10. Europe Rough Terrain Crane Market
- 10.1 Germany
- 10.2 France
- 10.3 Italy
- 10.4 United Kingdom
- 10.5 Spain
- 10.6 Poland
- 10.7 Russia
- 10.8 Netherlands
- 10.9 Belgium
- 10.10 Sweden
- 10.11 Denmark
- 10.12 Norway
- 10.13 Rest of Europe
Chapter 11. Asia Pacific Rough Terrain Crane Market
- 11.1 China
- 11.2 India
- 11.3 Japan
- 11.4 South Korea
- 11.5 Thailand
- 11.6 Indonesia
- 11.7 Vietnam
- 11.8 Malaysia
- 11.9 Australia
- 11.10 Rest of Asia Pacific
Chapter 12. Latin America Rough Terrain Crane Market
- 12.1 Brazil
- 12.2 Argentina
- 12.3 Colombia
- 12.4 Chile
- 12.5 Rest of Latin America
Chapter 13. Middle East Rough Terrain Crane Market
- 13.1 Saudi Arabia
- 13.2 United Arab Emirates
- 13.3 Turkey
- 13.4 Israel
- 13.5 Iran
- 13.6 Rest of the Middle East
Chapter 14. Africa Rough Terrain Crane Market
- 14.1 South Africa
- 14.2 Egypt
- 14.3 Nigeria
- 14.4 Morocco
- 14.5 Rest of Africa
Chapter 15. Rough Terrain Crane Company Profiles
- 15.1 [Company 01]
- 15.1.1 Company Overview
- 15.1.2 Key Management Personnel
- 15.1.3 Products & Services Portfolio
- 15.1.4 Financial Performance
- 15.1.5 Key Market Focus & Geographic Presence
- 15.1.6 Recent Developments & Strategic Initiatives
Note: The company profile list is preliminary and may change based on research findings, market developments, data availability, and client requirements.
Chapter 16. Appendices
- Appendix A – List of Abbreviations & Acronyms
- Appendix B – Industry Classification Code Reference – Full Series
- Appendix C – Production & Capacity Data Tables
- Appendix D – End-Use & Demand Base Tables
- Appendix E – Consumption & Replacement Rate Assumptions
- Appendix F – ASP Reference Tables
- Appendix G – Manufacturing & Facility Database
- Appendix H – Import-Export Data Tables
- Appendix I – Regulatory Summary Tables
- Appendix J – Primary Research Participant List (Anonymized)
- Appendix K – Primary Research Questionnaire Framework
- Appendix L – Data Sources & Bibliography
- Appendix M – Market Size Divergence & Source Comparison
Chapter 17. Research Methodology
- 17.1 Research Framework & Philosophy
- 17.2 Secondary Research – Sources, Hierarchy & Data Extraction
- 17.3 Data Modeling – Bottom-Up & Top-Down Market Sizing
- 17.4 Primary Research – Stakeholder Framework, LOI & Sample Sizes
- 17.5 Forecast Methodology – Regression, Scenario & Sensitivity Analysis
- 17.6 Quality Control – Four-Layer Validation Framework
- 17.7 Limitations & Standard Assumptions
- 17.8 Disclaimer
