| REPORT ATTRIBUTE |
DETAILS |
| Historical Period |
2020-2023 |
| Base Year |
2024 |
| Forecast Period |
2025-2032 |
| Virus Filtration Market Size 2024 |
USD 5,597.56 million |
| Virus Filtration Market CAGR |
13.36% |
| Virus Filtration Market Size 2032 |
USD 15,227.01 million |
Market Overview
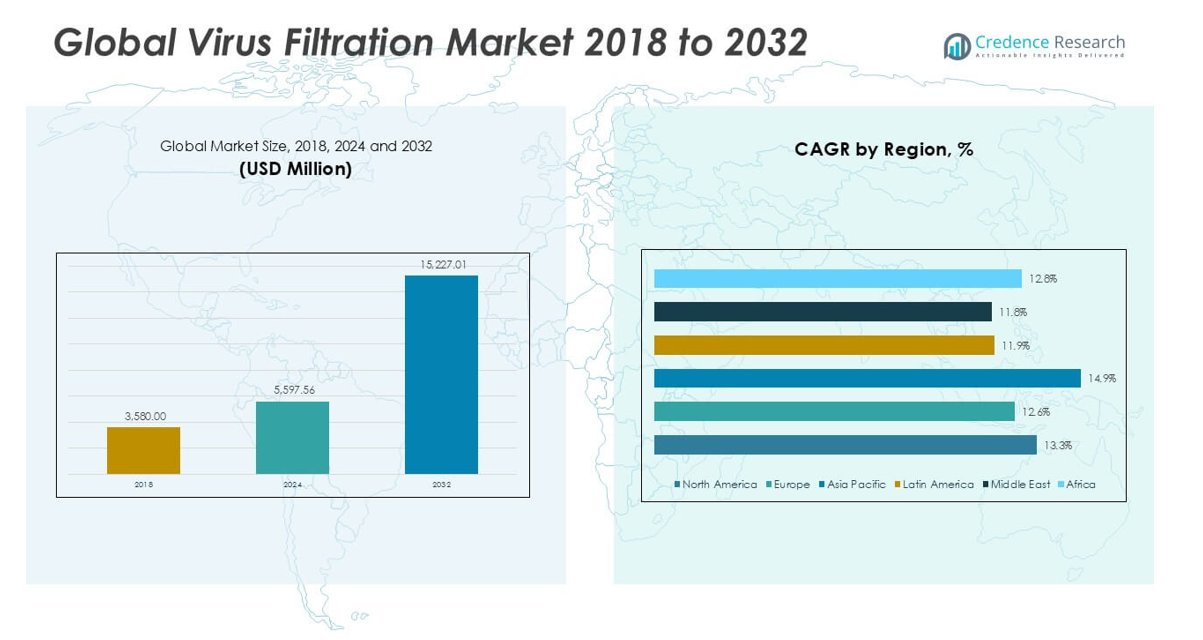
The Global Virus Filtration Market is projected to grow from USD 5,597.56 million in 2024 to an estimated USD 15,227.01 million based on 2032, with a compound annual growth rate (CAGR) of 13.36% from 2025 to 2032.
Market growth is fueled by rising biologics production, increased R\&D activities in cell and gene therapies, and a growing focus on ensuring biosafety in drug development. Virus filtration technologies are evolving to offer higher throughput, scalability, and reliability for diverse manufacturing scales. Trends such as single-use filtration systems and fully integrated continuous processing are gaining traction. Additionally, the ongoing threat of viral contamination in bioprocessing pipelines is prompting pharmaceutical companies to enhance viral clearance strategies and adopt advanced filtration systems.
North America holds a dominant share of the virus filtration market, supported by a robust biopharmaceutical sector and regulatory emphasis on product safety. Europe follows closely with strong investments in biosimilars and biologics manufacturing. The Asia Pacific region is experiencing the fastest growth due to expanding pharmaceutical infrastructure in China, India, and South Korea. Key players operating in this market include Merck KGaA, Sartorius AG, Danaher Corporation, Thermo Fisher Scientific Inc., and Asahi Kasei Medical Co., Ltd
Market Insights
- The Global Virus Filtration Market is projected to grow from USD 5,597.56 million in 2024 to USD 15,227.01 million by 2032, registering a CAGR of 13.36% from 2025 to 2032.
- Rising demand for biologics, vaccines, and gene therapies is driving the adoption of virus filtration systems across the biopharmaceutical sector.
- Increasing regulatory emphasis on viral safety and contamination control supports the integration of advanced filtration technologies in drug manufacturing.
- High costs associated with filter validation, system installation, and regulatory compliance challenge adoption among small and mid-sized firms.
- Membrane fouling and limited throughput in high-viscosity or complex biologic solutions hinder process efficiency and scalability.
- North America leads with a 42.13% market share in 2024, driven by a mature biopharma ecosystem and stringent safety regulations.
- Asia Pacific shows the fastest growth at a CAGR of 14.9%, fueled by expanding biologics infrastructure and rising pharmaceutical investments in China and India.
Access crucial information at unmatched prices!
Request your sample report today & start making informed decisions powered by Credence Research Inc.!
Download Sample
Market Drivers
Rising Demand for Biologics and Recombinant Therapeutics Fuels Market Expansion
The Global Virus Filtration Market benefits significantly from the increasing production of biologics, including monoclonal antibodies, recombinant proteins, and gene therapies. These complex biological products require stringent virus removal steps to meet regulatory guidelines and ensure patient safety. Pharmaceutical and biotechnology companies are scaling up biologic manufacturing capacities, driving the demand for advanced virus filtration systems. The focus on product purity and compliance enhances the need for reliable viral clearance processes. Virus filtration plays a critical role in the downstream purification of biologics. It ensures product integrity and supports robust validation protocols required by health authorities.
- For instance, according to the U.S. Food and Drug Administration (FDA), over 1,200 biologic license applications and supplements were reviewed in 2023, reflecting the surge in biologic product manufacturing that necessitates extensive virus filtration.
Regulatory Compliance Drives Adoption of High-Performance Filtration Technologies
Regulatory bodies such as the FDA and EMA mandate thorough virus safety assessments in biopharmaceutical production. These frameworks encourage manufacturers to adopt validated virus filtration solutions that provide consistent viral clearance. The Global Virus Filtration Market responds to this pressure with innovations in filter membranes and system design that meet evolving standards. Compliance with GMP and biosafety requirements compels facilities to integrate virus filters into routine workflows. It improves overall production reliability and supports faster approval timelines. Manufacturers prioritize virus filtration to reduce batch failures and avoid costly recalls.
- For instance, data from the European Medicines Agency (EMA) show that in 2024, more than 350 biopharmaceutical manufacturing facilities across Europe underwent virus filtration validation inspections to comply with updated regulatory standards.
Growth in Vaccine Development Intensifies the Focus on Viral Safety
The surge in vaccine development, both for infectious diseases and emerging pandemics, reinforces the importance of virus filtration. Filtration systems help eliminate endogenous and adventitious viruses in vaccine formulations, ensuring safety and efficacy. The Global Virus Filtration Market gains traction from growing public health investments and government-funded immunization programs. Vaccine manufacturers rely on scalable filtration technologies to meet global supply demands. Virus removal processes are central to maintaining the quality of live attenuated, inactivated, and subunit vaccines. It enables production consistency and strengthens public trust in immunization efforts.
Expansion of Single-Use Technologies Enhances System Flexibility and Integration
The bioprocessing industry increasingly adopts single-use virus filtration systems due to their reduced contamination risk and faster turnaround times. These disposable systems support flexible manufacturing and align with modular production strategies. The Global Virus Filtration Market sees strong adoption across small and mid-sized biopharma companies transitioning to cost-efficient setups. Single-use filters integrate seamlessly with upstream and downstream operations, enhancing process efficiency. It eliminates cleaning validation steps and lowers operational complexity. This trend aligns with industry goals to streamline biologics production and meet dynamic demand shifts.
Market Trends
Integration of Continuous Bioprocessing with Virus Filtration Solutions
Continuous bioprocessing is gaining traction in the biopharmaceutical industry, prompting the integration of virus filtration into streamlined production lines. The shift from batch to continuous operations aims to improve productivity, reduce footprint, and maintain consistent product quality. The Global Virus Filtration Market aligns with this shift by offering filters designed for uninterrupted processing without compromising virus removal efficacy. Manufacturers are designing filtration units that support steady flow rates and operate under constant pressure conditions. It helps reduce process variability and supports real-time quality control. This trend supports faster scale-up and enhances operational agility across production sites.
- For instance, according to a 2024 survey by BioPlan Associates, more than 140 biomanufacturing facilities worldwide reported implementing continuous virus filtration steps as part of their commercial production lines.
Rising Preference for Single-Use Virus Filtration Systems
The growing adoption of single-use systems in biopharmaceutical manufacturing has accelerated the demand for disposable virus filters. These systems offer benefits such as reduced cross-contamination risks, faster setup times, and lower cleaning validation requirements. The Global Virus Filtration Market reflects this transition with a surge in product innovations tailored for flexible, modular manufacturing environments. Companies are developing plug-and-play filter assemblies that integrate easily into disposable upstream and downstream workflows. It increases process efficiency and supports rapid product changeovers. The trend supports scalability while reducing the burden of traditional stainless-steel infrastructure.
- For instance, MilliporeSigma reported shipping over 2,400,000 single-use virus filtration units to biopharmaceutical manufacturers globally in 2024, reflecting the strong industry shift toward disposable solutions.
Advancements in Filter Membrane Technologies Improve Performance
Recent innovations in membrane chemistry and pore structure have enhanced virus retention capacity and flow characteristics. High-throughput membranes now offer better durability and lower fouling rates, making them suitable for complex biologics. The Global Virus Filtration Market benefits from increased investment in R\&D focused on improving membrane selectivity and longevity. Advanced materials such as polyethersulfone and nanofiber-based membranes support higher productivity while maintaining viral clearance. It allows manufacturers to operate at reduced pressures while achieving validated log reduction values. This trend strengthens reliability and consistency in large-scale manufacturing.
Digital Monitoring and Automation Improve Virus Filtration Control
The implementation of automation and real-time monitoring tools in virus filtration processes is improving process control and data accuracy. Sensors and digital interfaces allow operators to track pressure, flow rate, and membrane integrity in real time. The Global Virus Filtration Market is adopting smart filtration systems that integrate with plant-wide control platforms. It reduces human error and supports predictive maintenance strategies, minimizing downtime. Automated virus filtration enhances reproducibility and supports regulatory documentation through electronic batch records. This trend reflects a broader move toward digital transformation in pharmaceutical manufacturing.
Market Challenges
High Cost of Filtration Systems and Validation Poses Barriers for Small Manufacturers
Virus filtration systems involve significant capital investment, particularly for validated filters and compatible hardware. Smaller biopharmaceutical firms often face financial constraints when integrating virus filtration into their production workflows. The Global Virus Filtration Market reflects this disparity, with large players more easily absorbing the high cost of validation studies and filter replacements. Regulatory compliance demands rigorous viral clearance testing, adding to the overall expenditure. It restricts access for emerging firms and limits the adoption of filtration systems in low-budget manufacturing setups. These cost-related challenges hinder broader market penetration across smaller-scale biologics developers.
- For instance, a 2023 industry survey by BioProcess International found that the average cost for a single virus filtration validation study—including filter qualification and viral clearance testing—was approximately $320,000 per product batch, a figure that poses a major barrier for firms with annual R&D budgets under $2 million.
Membrane Fouling and Throughput Limitations Affect Operational Efficiency
Membrane fouling remains a technical hurdle that can reduce filter lifespan and impact throughput during virus filtration. Complex biologics, high-viscosity fluids, or large-scale batches often accelerate clogging, requiring frequent filter replacements or pre-treatment steps. The Global Virus Filtration Market experiences operational inefficiencies when filters cannot maintain consistent flow rates or virus removal under high load conditions. It increases downtime and raises process costs, particularly in continuous manufacturing environments. Advancements in membrane materials have mitigated some issues, but challenges persist for demanding biologic formulations. These limitations affect scalability and complicate process optimization efforts.
Market Opportunities
Growing Biopharmaceutical Activity in Emerging Markets Creates New Revenue Streams
Emerging economies such as India, China, and Brazil are rapidly expanding their biopharmaceutical manufacturing capabilities. Increased government support, infrastructure investment, and rising demand for affordable biologics are driving local production. The Global Virus Filtration Market has an opportunity to grow by offering cost-effective, scalable solutions tailored to regional needs. It can address the rising demand for viral safety in vaccine, biosimilar, and recombinant protein production. Suppliers that localize manufacturing and support services can gain competitive advantage. Collaborations with domestic biopharma firms can also accelerate market penetration and regulatory acceptance.
Innovation in Filtration Materials and Automation Expands Application Scope
Continued advancements in membrane technology, pre-filtration devices, and automated virus removal systems unlock new applications in gene therapy and cell-based products. The Global Virus Filtration Market stands to benefit from the rising number of clinical trials involving complex biologics that require advanced viral clearance. It can support evolving regulatory frameworks by offering traceable, validated, and efficient filtration processes. Smart filtration systems with integrated monitoring and automated feedback loops appeal to manufacturers seeking real-time control. These innovations enhance process robustness and attract firms focused on personalized medicine and high-value therapeutics. The market can capitalize on this shift by aligning solutions with emerging therapeutic platforms.
Market Segmentation Analysis
By Product
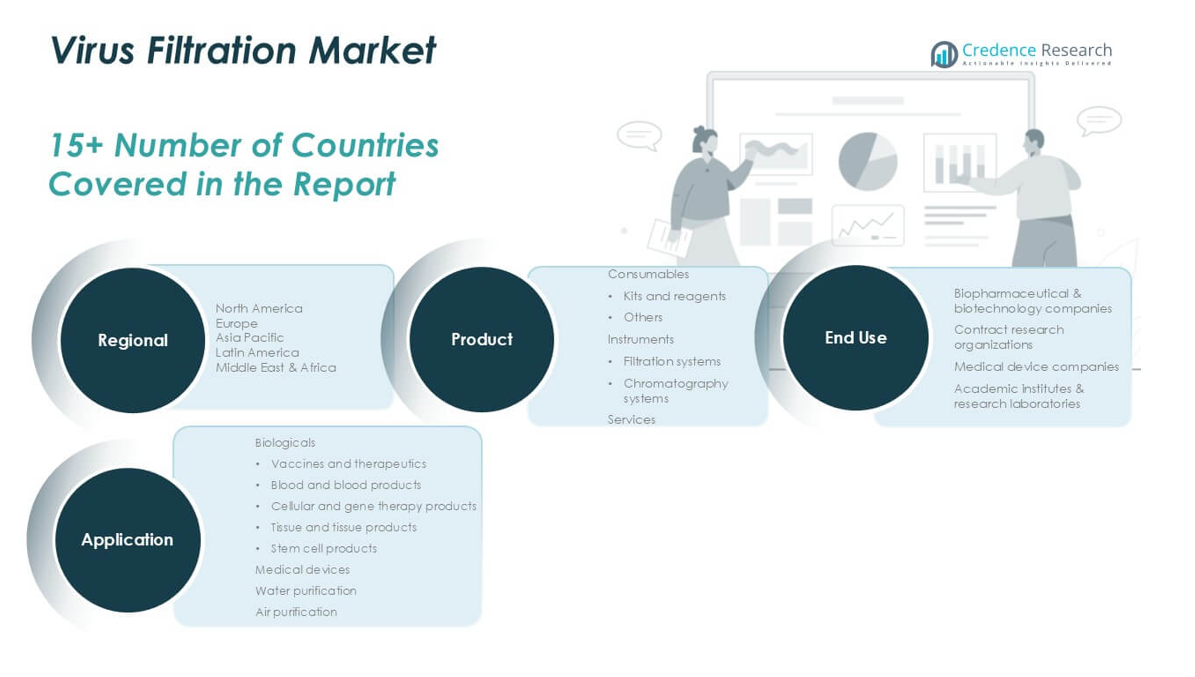
The Global Virus Filtration Market is segmented into consumables, instruments, and services. Consumables dominate the market due to their recurring use in filtration workflows, with kits, reagents, and disposable membranes forming the bulk of this segment. Instruments, including filtration systems and chromatography systems, account for a significant share, driven by demand for high-throughput and automated processing. Filtration systems remain essential in large-scale biologics production, while chromatography systems offer virus removal support during purification. Services, though smaller in share, are gaining traction as companies outsource filtration validation and compliance testing to specialized providers. It supports operational efficiency and compliance with stringent quality standards.
- For instance, over 50 million virus filtration consumable units were supplied globally in a single year, compared to 7,000 new instrument installations and 2,500 service contracts.
By Application
The market is classified into biologicals, medical devices, water purification, and air purification. Biologicals represent the largest segment, driven by the need for virus filtration in vaccines, blood products, stem cell therapies, and gene-modified treatments. The Global Virus Filtration Market benefits from rising production of complex biologics, where virus removal is mandatory. Medical devices require virus filtration to ensure product safety and sterility, particularly in implantable devices. Water and air purification segments leverage virus filtration technologies for critical applications in healthcare facilities and cleanrooms. It expands the use of virus filtration beyond biopharma into environmental and public health domains.
- For instance, according to a 2024 report by the U.S. FDA, more than 4,000 biologics manufacturing batches required validated virus filtration steps annually in the United States alone.
By End Use
Key end users include biopharmaceutical and biotechnology companies, contract research organizations, medical device companies, and academic institutes. Biopharmaceutical companies account for the majority of demand, driven by biologics manufacturing and compliance needs. The Global Virus Filtration Market also serves contract research organizations that manage outsourced drug development and testing services. Medical device firms use virus filtration during sterile device manufacturing. Academic and research institutions adopt virus filtration for preclinical studies and translational research. It supports a diverse user base across industrial and scientific sectors.
Segments
Based on Product
- Consumables
- Kits and Reagents
- Others
- Instruments
- Filtration Systems
- Chromatography Systems
- Services
Based on Application
- Biologicals
- Vaccines and Therapeutics
- Blood and Blood Products
- Cellular and Gene Therapy Products
- Tissue and Tissue Products
- Stem Cell Products
- Medical Devices
- Water Purification
- Air Purification
Based on End Use
- Biopharmaceutical & Biotechnology Companies
- Contract Research Organizations
- Medical Device Companies
- Academic Institutes & Research Laboratories
Based on Region
- North America
- Europe
- UK
- France
- Germany
- Italy
- Spain
- Russia
- Belgium
- Netherlands
- Austria
- Sweden
- Poland
- Denmark
- Switzerland
- Rest of Europe
- Asia Pacific
- China
- Japan
- South Korea
- India
- Australia
- Thailand
- Indonesia
- Vietnam
- Malaysia
- Philippines
- Taiwan
- Rest of Asia Pacific
- Latin America
- Brazil
- Argentina
- Peru
- Chile
- Colombia
- Rest of Latin America
- Middle East
- UAE
- KSA
- Israel
- Turkey
- Iran
- Rest of Middle East
- Africa
- Egypt
- Nigeria
- Algeria
- Morocco
- Rest of Africa
Regional Analysis
North America Virus Filtration Market
North America leads the Virus Filtration Market with a 42.13% share in 2024, valued at USD 2,358.78 million. It is projected to reach USD 6,398.24 million by 2032, growing at a CAGR of 13.3%. The United States drives most of the regional demand due to its dominant biopharmaceutical sector and strict regulatory environment. High investment in biologics manufacturing and early adoption of single-use technologies support market growth. Canada contributes through its growing biosimilars market and presence of academic research hubs. The region prioritizes virus safety across biologics, gene therapy, and vaccines, encouraging adoption of advanced filtration systems. The Virus Filtration Market in North America remains the most mature and innovation-driven.
Europe Virus Filtration Market
Europe holds a 25.77% share in 2024, with market value at USD 1,442.90 million, expected to grow to USD 3,711.62 million by 2032 at a CAGR of 12.6%. Germany, the UK, and France lead with a strong biologics manufacturing base and expanding cell therapy research. The European Medicines Agency mandates rigorous virus clearance validation, creating demand for high-performance filtration technologies. Regional initiatives for vaccine development and public health preparedness fuel continuous investment. It supports filtration equipment upgrades in both commercial and academic bioprocessing facilities. Europe remains a key contributor to global filtration standards and process harmonization.
Asia Pacific Virus Filtration Market
Asia Pacific accounts for 21.01% of the global market in 2024, with value at USD 1,172.94 million, projected to reach USD 3,560.73 million by 2032 at the highest CAGR of 14.9%. China, India, South Korea, and Japan dominate regional demand through biologics production expansion and rising clinical trials. Government funding and foreign direct investment support vaccine infrastructure and manufacturing hubs. The Virus Filtration Market sees increased traction from domestic biosimilar and gene therapy developers. Local players invest in cost-effective filtration solutions aligned with regulatory needs. It supports regional self-sufficiency in therapeutic manufacturing.
Latin America Virus Filtration Market
Latin America holds a 4.81% market share in 2024, with value at USD 269.19 million and projected to reach USD 658.26 million by 2032, growing at a CAGR of 11.9%. Brazil and Mexico are the largest contributors due to improving healthcare infrastructure and biomanufacturing initiatives. The region experiences growing demand for vaccines and blood products, driving filtration system usage. The Virus Filtration Market in Latin America benefits from regional public health initiatives and clinical trial expansions. Technology transfer agreements support local production. It creates opportunities for international players to partner with domestic firms.
Middle East Virus Filtration Market
The Middle East represents a 3.27% share of the global market in 2024, valued at USD 183.56 million and forecasted to reach USD 445.87 million by 2032, at a CAGR of 11.8%. Countries like Saudi Arabia and the UAE invest in biopharmaceutical and healthcare manufacturing zones. The region sees increasing demand for filtration systems in vaccine production and pandemic preparedness. The Virus Filtration Market benefits from partnerships with multinational firms supporting knowledge transfer and facility upgrades. Healthcare reforms and diversification strategies under national visions boost demand. It reflects rising awareness of viral contamination control across critical drug and vaccine production.
Africa Virus Filtration Market
Africa accounts for a 3.03% share in 2024, with market value at USD 170.19 million, projected to reach USD 452.29 million by 2032, growing at a CAGR of 12.8%. South Africa, Nigeria, and Egypt lead regional demand, supported by global health initiatives and local pharmaceutical capacity-building. The Virus Filtration Market in Africa grows steadily due to efforts in blood safety, vaccine manufacturing, and disease control programs. WHO-backed biomanufacturing hubs expand the need for virus filtration solutions. It opens up new opportunities for suppliers to serve high-impact markets. Donor-funded projects further accelerate system adoption and infrastructure modernization.
Shape Your Report to Specific Countries or Regions & Enjoy 30% Off!
Key players
- Merck KGaA
- Danaher Corporation
- Sartorius AG
- Thermo Fisher Scientific Inc.
- Asahi Kasei Medical Co., Ltd.
- Wuxi AppTec
- Charles River Laboratories
- Lonza Group Ltd.
- Parker Hannifin Corporation
- GE Healthcare
- Pall Corporation
- Bio-Rad Laboratories, Inc.
- Repligen Corporation
- Meissner Filtration Products, Inc.
- TOSOH Corporation
Competitive Analysis
The Virus Filtration Market remains highly competitive with a mix of global life science leaders and specialized filtration providers. Merck KGaA, Danaher, Sartorius AG, and Thermo Fisher Scientific dominate through extensive product portfolios and advanced filtration technologies. It emphasizes innovation in membrane design, system integration, and virus clearance validation. Companies invest in strategic partnerships, acquisitions, and capacity expansions to secure global reach and meet biopharma demands. Emerging players compete on cost, speed of delivery, and region-specific services. The market rewards firms that offer scalable, single-use solutions and comply with evolving regulatory requirements. Competitive advantage depends on technical expertise, global logistics, and alignment with biologics manufacturing trends.
Recent Developments
- In August 1, 2024, Merck KGaA closed its $600 million acquisition of Mirus Bio, enhancing its viral vector manufacturing offerings, particularly in transfection reagents and purification workflows
- In February 25, 2025, Thermo Fisher Scientific announced its agreement to acquire Solventum’s purification and filtration business for $4.1 billion, aiming to expand its footprint in bioprocessing filtration; the deal is expected to close by end of 202
Market Concentration and Characteristics
The Virus Filtration Market is moderately concentrated, with a few global players holding a dominant share due to strong product portfolios, regulatory expertise, and large-scale manufacturing capabilities. It features high entry barriers driven by complex validation requirements, stringent quality standards, and long product development cycles. The market is innovation-driven, with emphasis on membrane efficiency, throughput optimization, and single-use system compatibility. It exhibits strong buyer dependency on proven performance and regulatory compliance, favoring established suppliers. Demand remains consistent across biopharmaceutical applications, supported by the growing need for viral safety in biologics and gene therapies. Product differentiation and service reliability define competitive positioning.
Report Coverag
The research report offers an in-depth analysis based on Product, Application, End Use and Region. It details leading market players, providing an overview of their business, product offerings, investments, revenue streams, and key applications. Additionally, the report includes insights into the competitive environment, SWOT analysis, current market trends, as well as the primary drivers and constraints. Furthermore, it discusses various factors that have driven market expansion in recent years. The report also explores market dynamics, regulatory scenarios, and technological advancements that are shaping the industry. It assesses the impact of external factors and global economic changes on market growth. Lastly, it provides strategic recommendations for new entrants and established companies to navigate the complexities of the market.
Future Outlook
- Ongoing expansion in monoclonal antibody and biosimilar production will continue to drive demand for virus filtration technologies across global manufacturing facilities.
- The shift toward continuous processing in biopharma will boost integration of in-line virus filtration systems designed for uninterrupted and scalable operations.
- Wider application of virus filtration in personalized medicine, stem cell therapy, and gene therapy will create opportunities for niche, high-performance filtration solutions.
- Growth in biologics manufacturing in Asia Pacific, Latin America, and Africa will increase regional demand for cost-effective and regulatory-compliant filtration systems.
- Continued investment in next-generation filter membranes will improve viral retention capacity, reduce fouling, and extend filter life, enhancing process efficiency.
- Stricter viral safety regulations and GMP requirements will encourage manufacturers to invest in validated, pre-approved virus filtration systems to avoid production delays.
- The market will see broader adoption of single-use virus filtration setups aligned with modular bioprocessing platforms, offering faster turnaround and lower contamination risk.
- Major players will pursue acquisitions and strategic alliances to expand product lines, enter new geographies, and strengthen filtration capabilities.
- Smart filtration systems with real-time analytics and sensor-based control will gain market share by supporting predictive maintenance and process optimization.
- Long-term demand will remain robust in vaccine and plasma-derived product segments, where virus removal remains a mandatory step in production workflows.


