Market Overview
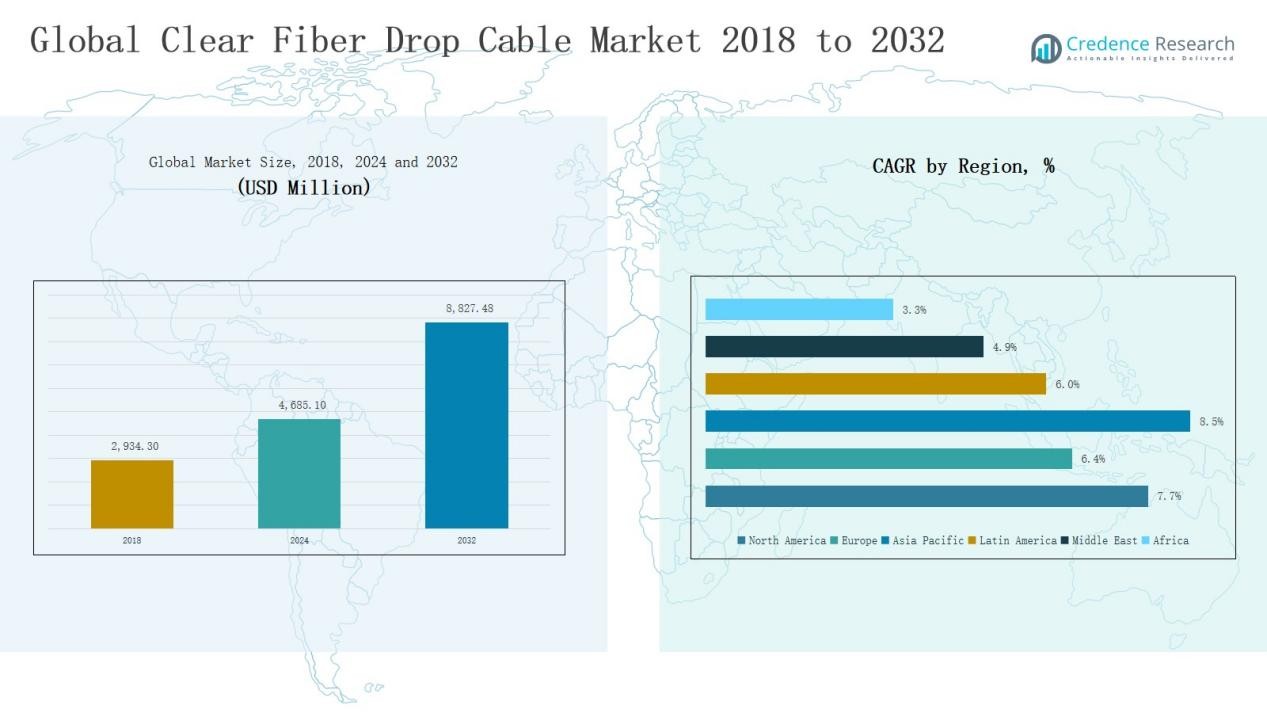
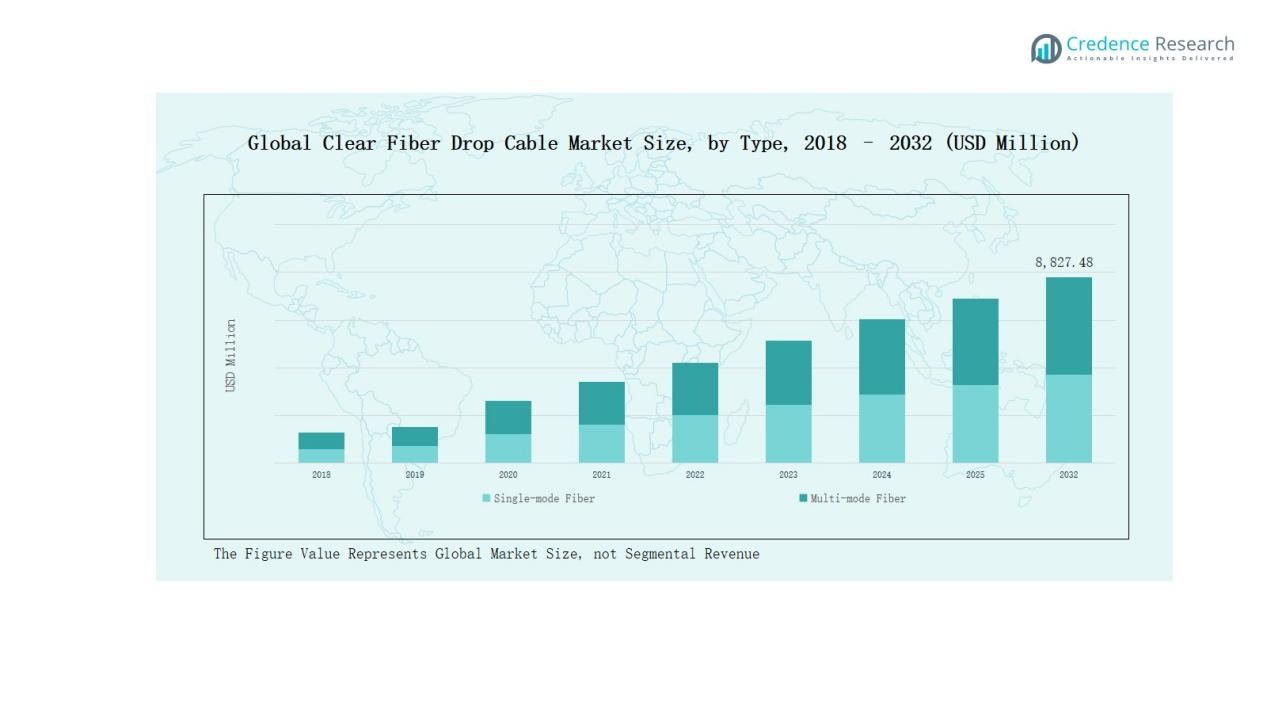
Clear Fiber Drop Cable Market size was valued at USD 2,934.30million in 2018 to USD 4,685.10 million in 2024 and is anticipated to reach USD 8,827.48 million by 2032, at a CAGR of 7.67% during the forecast period.
| REPORT ATTRIBUTE |
DETAILS |
| Historical Period |
2020-2024 |
| Base Year |
2024 |
| Forecast Period |
2025-2032 |
| Clear Fiber Drop Cable Market Size 2024 |
USD 4,685.10 Million |
| Clear Fiber Drop Cable Market, CAGR |
7.67% |
| Clear Fiber Drop Cable Market Size 2032 |
USD 8,827.48 Million |
The Clear Fiber Drop Cable Market is dominated by established players such as Corning Incorporated, CommScope Holding Company, Prysmian Group, Nexans S.A., Furukawa Electric Co. Ltd., Sumitomo Electric Industries Ltd., TE Connectivity Ltd., AFL Telecommunications LLC, Southwest Microwave Inc., Optical Cable Corporation, and Belden Inc. These companies maintain competitive leadership through advanced product portfolios, strategic investments in R&D, and strong global distribution networks. North America leads the market, accounting for 38.6% of the global revenue share, supported by robust telecom infrastructure, extensive fiber-to-the-home (FTTH) deployments, and high adoption rates across residential, commercial, and industrial sectors.
Access crucial information at unmatched prices!
Request your sample report today & start making informed decisions powered by Credence Research Inc.!
Download Sample
Market Insights
- The Clear Fiber Drop Cable Market grew from USD 2,934.30 million in 2018 to USD 4,685.10 million in 2024 and is projected to reach USD 8,827.48 million by 2032, supported by a CAGR of 7.67% during the forecast period.
- Expansion of broadband and FTTH networks, alongside 5G rollouts and modernization of telecom infrastructure, are major growth drivers, with strong demand from smart buildings and industrial automation.
- Key challenges include high initial installation costs, competition from wireless and alternative technologies, and complex deployment conditions in dense or harsh environments.
- Asia Pacific leads with a 43.0% share in 2024, followed by North America at 27.6% and Europe at 16.8%, with growth driven by aggressive fiber expansion and strong digital infrastructure investment.
- Leading companies such as Corning Incorporated, CommScope Holding Company, Prysmian Group, and Nexans S.A. maintain market leadership through advanced technologies, R&D investment, and robust global distribution networks.
Market Segment Insights
By Type
In the Clear Fiber Drop Cable Market, the single-mode fiber segment holds the leading position due to its ability to deliver high-speed data over long distances with minimal signal loss. Its performance advantages, including lower attenuation and higher bandwidth capacity, make it the preferred choice for large-scale telecom networks, 5G deployment, and fiber-to-the-home (FTTH) installations. Increasing investments in broadband infrastructure and the need for reliable long-haul connectivity continue to strengthen its market dominance.
- For instance, Corning Inc. produces single-mode fibers that are integral to 5G network expansions and fiber-to-the-home (FTTH) deployments, thanks to their high bandwidth and low attenuation.
By Application
The telecommunications segment remains the most significant contributor to market demand, driven by the global shift toward high-speed internet, widespread 5G rollouts, and the replacement of legacy copper lines with advanced fiber solutions. Its growth is further supported by continuous upgrades in telecom infrastructure and rising demand for seamless, low-latency connectivity across both urban and rural areas.
- For instance, CommScope’s launch of the Propel XFrame™ solution in 2025, designed to optimize fiber connections in data centers, reflecting industry growth toward space-efficient, scalable fiber optic infrastructure.
By Material
Plastic-based clear fiber drop cables account for the largest share in the market, favored for their flexibility, lightweight construction, and cost-efficiency. These properties make them highly suitable for short-distance connections, residential installations, and smart building networks. The growing adoption of plastic optical fibers in home and office environments, along with their ease of handling and installation, continues to drive their preference over alternative materials.
Key Growth Drivers
Expansion of Broadband and FTTH Networks
The rapid expansion of broadband and fiber-to-the-home (FTTH) networks is a primary growth driver for the Clear Fiber Drop Cable Market. Governments and telecom operators are investing heavily in high-speed internet infrastructure to meet the rising demand for seamless connectivity. The shift toward digital services, online education, and remote work has accelerated fiber deployment in both urban and rural regions. Single-mode fibers, in particular, are gaining preference due to their high bandwidth capacity and ability to support long-distance transmission without significant signal degradation.
- For instance, Corning Inc. has developed single-mode optical fibers capable of maintaining signal integrity over distances exceeding 40 kilometers without the need for repeaters, significantly enhancing long-range communication networks.
5G Rollout and Telecom Infrastructure Modernization
The global rollout of 5G networks is fueling demand for high-performance clear fiber drop cables. These cables enable the low-latency, high-capacity data transmission required for advanced telecom services, including IoT, smart city applications, and ultra-HD content delivery. Network operators are upgrading legacy copper lines to fiber to support dense small-cell deployments, ensuring reliable backhaul connectivity. This modernization effort is creating sustained demand across telecom and data center applications, positioning fiber as a core enabler of next-generation communication technologies.
- For instance, AT&T’s deployment of fiber infrastructure supports ultra-HD streaming and IoT applications by replacing legacy copper lines with high-bandwidth fiber connections.
- Rising Adoption in Smart Buildings and Industrial Automation
The growing adoption of smart building solutions and industrial automation systems is boosting the Clear Fiber Drop Cable Market. In commercial and industrial environments, these cables provide high-speed, interference-free communication for building management systems, security surveillance, and automation controls. The demand for integrated, data-driven infrastructure in manufacturing plants, offices, and residential complexes is driving installations. Clear fiber’s ability to transmit large volumes of data with high reliability makes it a preferred choice for supporting connected devices and real-time monitoring systems in advanced facilities.
Key Trends & Opportunities
Integration with Sustainable and Eco-Friendly Infrastructure
Sustainability trends are creating opportunities for the development of eco-friendly clear fiber drop cables. Manufacturers are focusing on recyclable materials and energy-efficient production methods to align with green building certifications and environmental regulations. Demand is increasing in smart cities and green infrastructure projects, where fiber solutions contribute to reducing carbon footprints. This shift toward sustainable materials not only meets regulatory compliance but also enhances brand positioning for manufacturers in a competitive market.
- For instance, Corning’s Clear Fiber drop cable uses a jacket made from dielectric materials that simplifies installation and minimizes waste while offering durability for indoor/outdoor use.
Technological Advancements in Fiber Design and Manufacturing
Innovations in fiber cable design, such as bend-insensitive fibers and enhanced coating technologies, are improving performance and installation efficiency. Advanced manufacturing processes are enabling smaller, more durable, and cost-effective cables suitable for diverse environments, including high-density urban areas and industrial sites. These technological improvements are opening opportunities in challenging installation conditions, expanding the scope of fiber adoption beyond traditional telecom applications and into emerging sectors like defense, healthcare, and transportation infrastructure.
- For instance, Corning introduced ClearCurve ZBL bend-insensitive fiber to withstand extreme bends without signal loss, and Prysmian Group launched eco-friendly fiber cables with 50% recycled glass to meet sustainability goals.
Key Challenges
High Initial Installation and Deployment Costs
The significant upfront investment required for fiber cable installation remains a key challenge, particularly in regions with underdeveloped infrastructure. Costs associated with trenching, splicing, and network integration can deter adoption in cost-sensitive markets. While long-term operational savings and performance benefits are compelling, the initial financial outlay continues to slow penetration in some residential and rural projects, where return on investment is less immediate.
Competition from Wireless and Alternative Technologies
Despite fiber’s superior performance, wireless technologies such as 5G and satellite broadband present competitive alternatives in certain scenarios. In remote or difficult-to-access locations, wireless solutions can be deployed faster and at lower cost, reducing the immediate need for fiber installation. This competitive pressure may limit market growth in specific applications, especially where latency and bandwidth demands can be met without physical cable infrastructure.
Complex Installation in Dense or Harsh Environments
Deploying clear fiber drop cables in densely populated urban centers or harsh industrial environments poses significant technical challenges. Factors such as space constraints, interference from existing utilities, and environmental hazards can complicate installation. Additionally, skilled labor shortages and the need for specialized equipment increase project timelines and costs. These barriers can delay network rollouts and hinder rapid adoption in high-potential markets.
Regional Analysis
North America
North America holds a 27.6% share of the global Clear Fiber Drop Cable Market in 2024, with a market value of USD 1,358.80 million, up from USD 864.33 million in 2018, and is projected to reach USD 2,570.78 million by 2032. The region’s growth, at a CAGR of 7.7%, is driven by advanced telecom infrastructure, extensive fiber-to-the-home (FTTH) deployment, and accelerated 5G rollouts. High adoption rates in residential, commercial, and industrial sectors, coupled with significant investments by leading telecom providers, sustain market expansion. The U.S. dominates regional demand, supported by federal broadband funding and initiatives to bridge the digital divide, while Canada and Mexico contribute through ongoing infrastructure modernization projects.
Europe
Europe accounts for 16.8% of the global market in 2024, reaching USD 829.81 million, up from USD 549.73 million in 2018, and is expected to achieve USD 1,422.26 million by 2032. The region is projected to grow at a CAGR of 6.4%, supported by strong regulatory initiatives for universal high-speed internet access, modernization of telecom infrastructure, and expanding applications in smart cities and industrial automation. The UK, Germany, and France lead adoption, with substantial public-private investments in fiber broadband projects. Europe’s focus on digital transformation and sustainability-driven building codes continues to drive demand across both urban and rural deployments.
Asia Pacific
Asia Pacific dominates the global market with a 43.0% share in 2024, valued at USD 2,129.80 million, rising from USD 1,286.56 million in 2018, and is projected to reach USD 4,256.89 million by 2032. With the fastest CAGR of 8.5%, growth is propelled by aggressive fiber network expansion in China, Japan, South Korea, and India, supported by massive 5G investments and government-backed digital initiatives. Rapid urbanization, booming data center construction, and the increasing adoption of smart building technologies further fuel demand. The region’s cost-competitive manufacturing base and strong presence of leading fiber cable producers ensure continuous technological advancement and capacity expansion.
Latin America
Latin America represents 4.2% of the global market in 2024, valued at USD 209.17 million, up from USD 132.73 million in 2018, and is forecast to reach USD 346.80 million by 2032, at a CAGR of 6.0%. Brazil and Argentina lead regional growth, driven by national efforts to expand high-speed internet coverage and replace copper lines with fiber networks. Although market penetration remains lower than in mature regions, increasing government incentives, foreign investments, and growing demand for streaming, e-commerce, and remote work services are fueling gradual but steady adoption across both residential and commercial applications.
Middle East
The Middle East holds a 2.0% share of the global market in 2024, valued at USD 99.11 million, up from USD 69.13 million in 2018, and is expected to reach USD 151.42 million by 2032, at a CAGR of 4.9%. Growth is fueled by infrastructure modernization in GCC countries, investment in smart city projects, and expanding high-speed internet services. The UAE and Saudi Arabia lead regional adoption, deploying extensive fiber networks to support economic diversification initiatives. Large-scale commercial and residential developments incorporating advanced building management systems are further boosting the need for reliable, high-performance fiber connectivity.
Africa
Africa accounts for 1.2% of the global market in 2024, valued at USD 58.40 million, rising from USD 31.82 million in 2018, and projected to reach USD 79.32 million by 2032, growing at a CAGR of 3.3%. Expansion is concentrated in South Africa, Egypt, and select urban hubs where fiber deployment initiatives are gaining traction. While high installation costs and limited infrastructure in rural areas remain challenges, rising internet penetration, government-led connectivity programs, and foreign investment in submarine cable projects are gradually improving network capacity and fostering long-term market potential for clear fiber drop cables.
Market Segmentations:
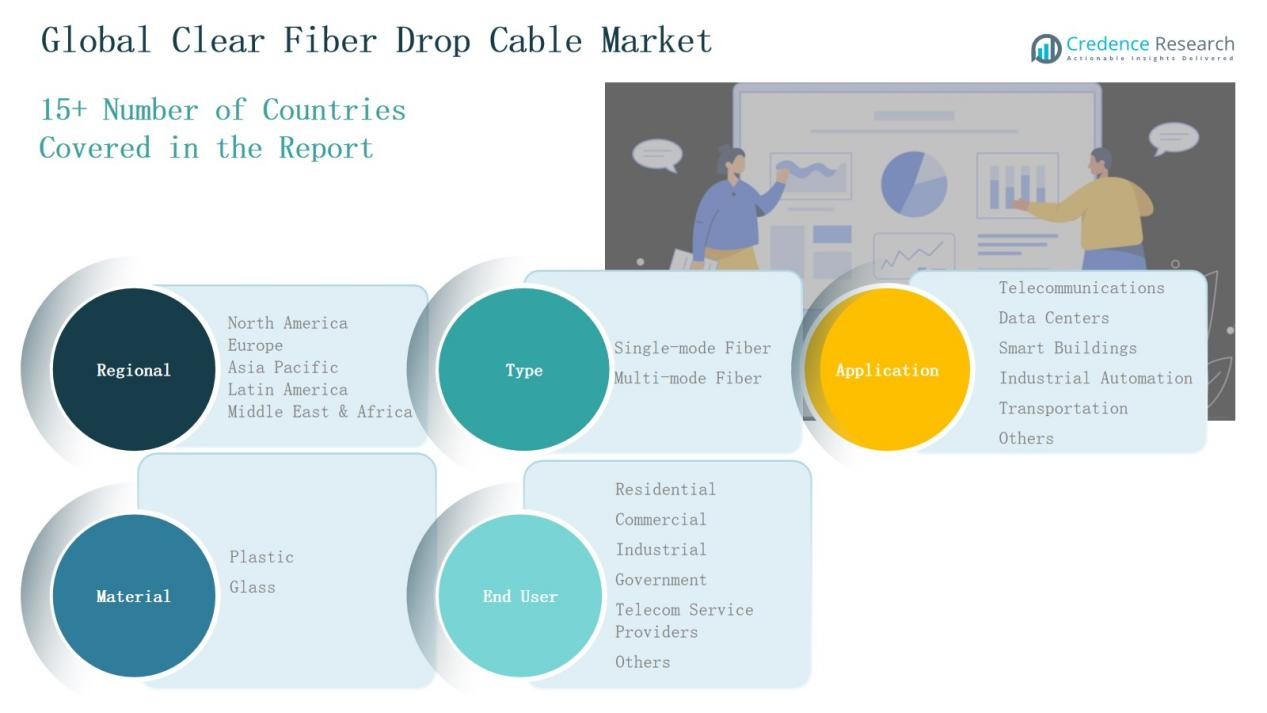
By Type
- Single-mode Fiber
- Multi-mode Fiber
By Application
- Telecommunications
- Data Centers
- Smart Buildings
- Industrial Automation
- Transportation
- Others
By Material
By End User
- Residential
- Commercial
- Industrial
- Government
- Telecom Service Providers
- Others
By Region
North America
Europe
- UK
- France
- Germany
- Italy
- Spain
- Russia
- Rest of Europe
Asia Pacific
- China
- Japan
- South Korea
- India
- Australia
- Southeast Asia
- Rest of Asia Pacific
Latin America
- Brazil
- Argentina
- Rest of Latin America
Middle East
- GCC Countries
- Israel
- Turkey
- Rest of Middle East
Africa
- South Africa
- Egypt
- Rest of Africa
Competitive Landscape
The competitive landscape of the Clear Fiber Drop Cable Market is characterized by the presence of leading global manufacturers and regional players competing on technology, product quality, and distribution reach. Key companies such as Corning Incorporated, CommScope Holding Company, Prysmian Group, Nexans S.A., Furukawa Electric Co. Ltd., Sumitomo Electric Industries Ltd., TE Connectivity Ltd., AFL Telecommunications LLC, Southwest Microwave Inc., Optical Cable Corporation, and Belden Inc. maintain strong market positions through diversified product portfolios, advanced fiber technologies, and strategic partnerships. These players actively invest in research and development to enhance cable performance, durability, and installation efficiency, while also aligning with sustainability trends through eco-friendly materials and manufacturing processes. Competitive strategies include expanding production capacity, targeting high-growth regions, and securing large-scale telecom and infrastructure contracts. With increasing demand from 5G rollouts, broadband expansion, and smart infrastructure projects, the market remains dynamic, pushing manufacturers to continuously innovate and strengthen their global supply capabilities.
Shape Your Report to Specific Countries or Regions & Enjoy 30% Off!
Key Players
- Corning Incorporated
- CommScope Holding Company
- Prysmian Group
- Nexans S.A.
- Furukawa Electric Co. Ltd.
- Sumitomo Electric Industries Ltd.
- TE Connectivity Ltd.
- AFL Telecommunications LLC
- Southwest Microwave Inc.
- Optical Cable Corporation
- Belden Inc.
Recent Developments
- In May 2025, Furukawa Electric Co., Ltd. unified its global optical fiber cable operations under the brand Lightera™, debuting it at the OFC Conference in San Francisco to strengthen brand visibility in advanced cable solutions.
- In June 2025, Lightera introduced the RollR® 200 864-Fiber Rollable Ribbon Microcable, featuring an ultra-compact 11.4 mm diameter designed for 14 mm microducts to maximize fiber capacity in constrained spaces.
- In March 2025, Airtel entered into an agreement with SpaceX to deliver Starlink’s high-speed internet in India, involving significant procurement and deployment of fiber drop cables.
- In May 2025, Clearfield, Inc. launched the TetherSmart™ Multi-Fiber Terminal, the industry’s smallest fully sealed 10-port access terminal, optimized for FTTH, FTTB, and 5G backhaul.
- In August 2025, Amphenol announced its plan to acquire CommScope’s Connectivity & Cable Solutions (CCS) division in an all-cash deal worth approximately USD 10.5 billion, aiming to expand its fiber-optic interconnect portfolio.
Market Concentration & Characteristics
The Clear Fiber Drop Cable Market exhibits a moderately consolidated structure, with a few multinational corporations holding significant market shares alongside a competitive layer of regional and niche players. It is driven by high entry barriers linked to advanced manufacturing technology, capital-intensive production, and the need for established distribution networks. Leading companies leverage economies of scale, strong R&D capabilities, and long-term supply agreements to secure competitive advantage. The market is characterized by continuous innovation in fiber design, durability enhancements, and installation efficiency improvements. Demand concentration is highest in regions with extensive telecom infrastructure and large-scale broadband initiatives, creating favorable conditions for established players to maintain leadership. Competitive dynamics are further shaped by the push toward eco-friendly materials and compliance with evolving industry standards, compelling participants to align product development with environmental and regulatory requirements while targeting emerging growth opportunities in developing markets.
Report Coverage
The research report offers an in-depth analysis based on Type, Application, Material, End User and Region. It details leading market players, providing an overview of their business, product offerings, investments, revenue streams, and key applications. Additionally, the report includes insights into the competitive environment, SWOT analysis, current market trends, as well as the primary drivers and constraints. Furthermore, it discusses various factors that have driven market expansion in recent years. The report also explores market dynamics, regulatory scenarios, and technological advancements that are shaping the industry. It assesses the impact of external factors and global economic changes on market growth. Lastly, it provides strategic recommendations for new entrants and established companies to navigate the complexities of the market.
Future Outlook
- Demand for clear fiber drop cables will increase with the expansion of global broadband and FTTH networks.
- 5G rollouts will drive higher adoption due to the need for low-latency, high-capacity connectivity.
- Smart building developments will create new opportunities for fiber-based network installations.
- Industrial automation growth will boost demand for reliable and interference-free data transmission.
- Advancements in bend-insensitive and high-durability fiber designs will improve installation efficiency.
- Eco-friendly materials and sustainable manufacturing will gain importance in product development.
- Emerging markets will experience accelerated adoption driven by government-led digital initiatives.
- Replacement of copper networks with fiber will remain a key focus for telecom operators.
- Integration of fiber solutions in transportation infrastructure will support connected mobility systems.
- Collaboration between manufacturers and service providers will strengthen large-scale deployment capabilities.


