Market Overview
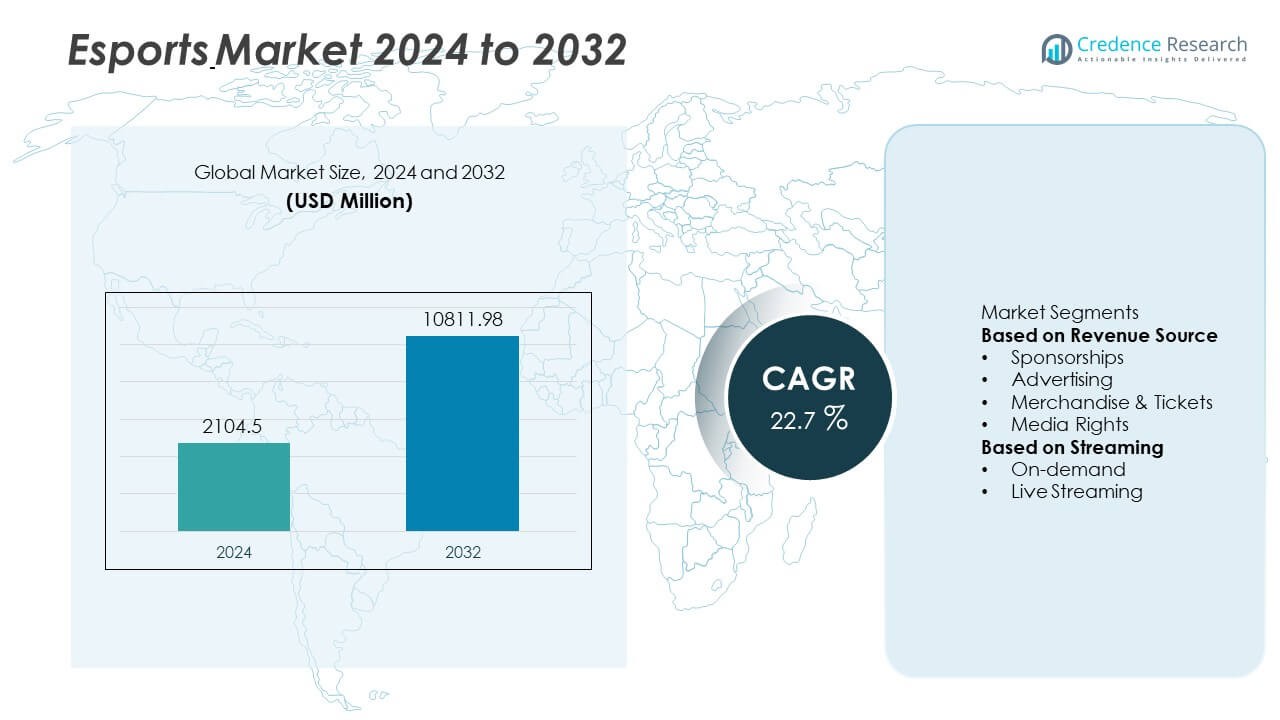
The Esports market size was valued at USD 2,104.5 million in 2024 and is projected to reach USD 10,811.98 million by 2032, growing at a CAGR of 22.7% during the forecast period.
| REPORT ATTRIBUTE |
DETAILS |
| Historical Period |
2020-2023 |
| Base Year |
2024 |
| Forecast Period |
2025-2032 |
| Esports Market Size 2024 |
USD 2,104.5 Million |
| Esports Market, CAGR |
22.7% |
| Esports Market Size 2032 |
USD 10,811.98 Million |
The esports market is driven by top players including Gameloft SE, Valve Corporation, Intel Corporation, Tencent Holding Limited, Activision Blizzard Inc., Modern Times Group (MTG), HTC Corporation, Electronic Arts Inc., NVIDIA Corporation, and Nintendo of America Inc. These companies contribute through game publishing, tournament organization, hardware innovation, and media distribution. Tencent and Activision Blizzard lead with global titles and high-revenue tournaments, while Intel and NVIDIA provide advanced gaming hardware that underpins professional play. Regionally, North America accounted for 42% of the global market share in 2024, driven by strong sponsorships, digital infrastructure, and streaming platforms. Europe held 28%, supported by international tournaments and cultural acceptance of esports. Asia Pacific captured 20%, led by China, South Korea, and Japan with strong mobile and PC gaming ecosystems. Together, these players and regions form the core of the industry’s global growth trajectory.
Access crucial information at unmatched prices!
Request your sample report today & start making informed decisions powered by Credence Research Inc.!
Download Sample
Market Insights
- The esports market was valued at USD 2,104.5 million in 2024 and is expected to reach USD 10,811.98 million by 2032, growing at a CAGR of 22.7% during the forecast period.
- Sponsorships held the largest revenue share at 35%, followed by merchandise and tickets at 25%, while live streaming accounted for 70% of streaming revenues, driven by rising fan engagement and interactive platforms.
- Growth is fueled by expanding global tournaments, rising mobile esports adoption, and strong brand sponsorships that attract both gaming and non-gaming companies.
- The competitive landscape is shaped by key players such as Tencent Holding Limited, Activision Blizzard Inc., Valve Corporation, NVIDIA Corporation, Intel Corporation, Electronic Arts Inc., Gameloft SE, HTC Corporation, Modern Times Group (MTG), and Nintendo of America Inc.
- Regionally, North America led with 42% share, followed by Europe at 28% and Asia Pacific at 20%, while Latin America and Middle East & Africa each accounted for 5%.
Market Segmentation Analysis:
By Revenue Source
Sponsorships dominated the esports market in 2024, holding over 35% of the total revenue share. Global brands continue to invest heavily in partnerships with teams, tournaments, and streaming platforms to reach younger audiences. Sponsorship deals provide strong visibility across multiple digital channels, boosting engagement and loyalty. Merchandise and tickets followed with around 25% share, driven by live events and fan engagement. Advertising accounted for nearly 22% share, while media rights contributed about 18%, supported by exclusive broadcasting agreements and rising demand from OTT platforms.
- For instance, Intel sponsors more than 20 major esports tournaments annually, including the Intel Extreme Masters, which attracted over 174,000 in-person attendees and more than 200 million online views in 2023.
By Streaming
Live streaming emerged as the leading segment in 2024, capturing nearly 70% of the esports streaming share. This dominance comes from fans’ preference for real-time engagement, interactive chats, and live tournament broadcasts on platforms like Twitch and YouTube Gaming. On-demand streaming accounted for about 30% share, fueled by viewers who consume highlights, replays, and analysis at their convenience. The rising influence of content creators, availability of archived matches, and flexible viewing options continue to support on-demand growth, while live formats remain central to esports’ global appeal.
- For instance, Valve’s The International 2023 Dota 2 championship recorded a peak of 1.44 million concurrent viewers across live streaming platforms, excluding Chinese streaming services.
Key Growth Drivers
Rising Brand Sponsorships and Partnerships
Sponsorships form the largest revenue stream in esports, with brands investing to reach younger digital audiences. Collaborations now extend beyond team apparel into digital activations, in-game branding, and tournament support. This trend enhances visibility for global companies while strengthening financial stability for esports organizations. Sponsors play a critical role in professionalizing the sector, funding large-scale competitions, and nurturing grassroots programs. As more industries recognize esports’ marketing potential, brand partnerships will continue to accelerate industry maturity and sustain long-term revenue growth.
- For instance, Intel’s long-standing Intel Extreme Masters (IEM) series is known for brand-backed esports events. IEM Katowice in 2023 saw 726,820 peak viewers and 23.3 million hours watched.
Expansion of Live Streaming Platforms
Live streaming platforms such as Twitch, YouTube Gaming, and Huya drive audience engagement and revenue generation. These platforms allow fans to experience tournaments in real-time while interacting with players and fellow viewers. Nearly three-fourths of audiences prefer live streaming, solidifying it as the industry’s primary distribution model. Features such as live chats and monetization tools increase fan loyalty and create attractive opportunities for advertisers and sponsors. With broadband expansion and mobile-first adoption in developing markets, streaming platforms will continue powering esports’ global reach.
- For instance, Nintendo’s Splatoon 3 Start Dash Cup streamed live on YouTube reached a peak concurrent viewership of 86,585. Replay views for some Splatoon world championship events have reached millions
Growing Global Esports Tournaments
Large-scale tournaments such as Dota 2’s The International and League of Legends Worlds attract millions of global viewers. Expanding prize pools and professional broadcasting elevate esports into mainstream entertainment. These competitions boost fan engagement, generate ticketing and merchandising opportunities, and strengthen commercial viability. Regional and grassroots tournaments further support player development, ensuring a continuous supply of competitive talent. With growing recognition of esports as a legitimate sport, international events are setting new standards for audience reach, sponsorship appeal, and long-term market growth.
Key Trends and Opportunities
Rising Mobile Esports Adoption
Mobile esports has emerged as one of the fastest-growing segments, particularly in Asia-Pacific and Latin America. Popular titles such as PUBG Mobile and Free Fire have built competitive ecosystems attracting millions of players and spectators. Smartphones make competitive gaming accessible to wider demographics compared to PC or console platforms. With 5G enabling low-latency streaming and gameplay, mobile esports is positioned for further expansion. This shift opens significant opportunities for sponsors, advertisers, and tournament organizers to reach cost-conscious but digitally active audiences worldwide.
- For instance, the entire PUBG Mobile esports ecosystem recorded over 135 million hours watched across all 2023 events, with the year’s main event, the PUBG Mobile Global Championship (PMGC) 2023, achieving a peak viewership of 980,110 concurrent fans.
Integration of Virtual Reality and Metaverse
The blending of esports with virtual reality and metaverse platforms is transforming fan engagement. Immersive virtual arenas allow audiences to experience tournaments interactively, extending value beyond traditional streaming. Gaming companies are exploring metaverse ecosystems that combine social interaction, live events, and digital commerce. Virtual tickets, branded in-game experiences, and collectible merchandise present new monetization models. As VR adoption grows and hardware becomes more affordable, metaverse-integrated esports is expected to redefine viewing experiences and unlock additional growth potential across global entertainment markets.
- For instance, HTC’s VIVE XR platform has been deployed in multiple esports arenas, powering VR experiences for thousands of fans during competitive events.
Key Challenges
Concerns Over Player Burnout and Well-being
Professional players face intense schedules, long practice hours, and constant competitive stress. This lifestyle often leads to burnout, mental health challenges, and repetitive strain injuries, threatening both careers and tournament quality. While some organizations are adopting wellness programs, industry-wide consistency is lacking. Without systematic health support, esports risks losing top talent prematurely. Ensuring player well-being will be crucial for sustaining growth, retaining professional talent, and maintaining competitive standards in an industry that demands peak performance year-round.
Intellectual Property and Broadcasting Rights Issues
Esports faces structural hurdles because game publishers retain control over intellectual property. This centralized control creates complexities in broadcasting rights, licensing, and revenue sharing between publishers, organizers, and streaming platforms. Smaller organizers often struggle to secure agreements, limiting event scalability and profitability. Disputes over IP rights also restrict industry-wide standardization, slowing expansion opportunities. Developing transparent and fair frameworks for broadcasting rights is essential to ensuring equitable growth, enabling more stakeholders to benefit, and unlocking esports’ full commercial potential globally.
Regional Analysis
North America
North America held the largest share of the esports market in 2024, accounting for 42% of global revenues. The region benefits from advanced digital infrastructure, high internet penetration, and the presence of leading streaming platforms such as Twitch and YouTube Gaming. Strong investments from major sponsors, coupled with established tournament organizers, strengthen its dominance. Universities and schools are also integrating esports programs, broadening grassroots participation. The growing appeal of esports as a mainstream entertainment option continues to attract advertisers, media networks, and investors, further fueling revenue expansion and sustaining North America’s leadership position in the global market.
Europe
Europe accounted for 28% of the global esports market share in 2024, supported by a mature gaming community and strong presence of international tournaments. Countries such as Germany, Sweden, and the United Kingdom serve as hubs for professional teams, gaming events, and esports startups. The region benefits from government recognition of esports in select nations, which promotes structured leagues and funding opportunities. Expanding streaming audiences across multiple languages enhance fan engagement. Europe’s robust digital ecosystem and cultural acceptance of competitive gaming continue to position it as a key market, driving sustained growth in revenues and tournament activities.
Asia Pacific
Asia Pacific captured 20% of the esports market share in 2024, making it one of the fastest-growing regions globally. China, South Korea, and Japan dominate the regional landscape due to strong gaming cultures, advanced broadband connectivity, and government-supported esports initiatives. South Korea’s well-established PC gaming infrastructure and China’s large-scale mobile esports adoption significantly contribute to market growth. The popularity of global tournaments and rising investments from technology companies strengthen regional development. With increasing youth engagement and growing smartphone penetration, Asia Pacific is expected to remain a pivotal market, shaping global esports consumption and driving innovation in digital gaming.
Latin America
Latin America represented 5% of the global esports market in 2024, with Brazil and Mexico leading the region’s expansion. Rapid smartphone adoption and growing broadband access drive esports viewership, particularly among younger demographics. Local tournaments and grassroots competitions are gaining momentum, creating opportunities for regional players and sponsors. Streaming platforms such as YouTube Gaming and Twitch are expanding their presence, enabling wider accessibility for fans. While infrastructure challenges remain in certain markets, rising investments from global sponsors and partnerships with gaming publishers are accelerating esports’ growth trajectory, positioning Latin America as an emerging hotspot in the global industry.
Middle East and Africa
The Middle East and Africa together accounted for 5% of the esports market share in 2024, supported by rising investments in gaming infrastructure and regional tournaments. Countries such as the United Arab Emirates and Saudi Arabia are actively positioning themselves as esports hubs through large-scale government-backed initiatives and events. Africa is witnessing steady growth, driven by increasing internet penetration and mobile gaming adoption among younger populations. Although the region remains in the early stages of development compared to North America, Europe, and Asia Pacific, ongoing investments and supportive government policies highlight strong future potential for esports expansion.
Market Segmentations:
By Revenue Source
- Sponsorships
- Advertising
- Merchandise & Tickets
- Media Rights
By Streaming
By Geography
- North America
- Europe
- Germany
- France
- U.K.
- Italy
- Spain
- Rest of Europe
- Asia Pacific
- China
- Japan
- India
- South Korea
- South-east Asia
- Rest of Asia Pacific
- Latin America
- Brazil
- Argentina
- Rest of Latin America
- Middle East & Africa
- GCC Countries
- South Africa
- Rest of the Middle East and Africa
Competitive Landscape
The competitive landscape of the esports market features leading players such as Gameloft SE, Valve Corporation, Intel Corporation, Tencent Holding Limited, Activision Blizzard Inc., Modern Times Group (MTG), HTC Corporation, Electronic Arts Inc., NVIDIA Corporation, and Nintendo of America Inc. These companies play a central role in shaping the industry through investments in game development, streaming platforms, and digital infrastructure. Tencent and Activision Blizzard dominate with flagship titles and global tournaments that attract massive audiences. Hardware providers like Intel and NVIDIA strengthen the ecosystem by delivering high-performance gaming solutions that support competitive play. Nintendo, Valve, and Electronic Arts continue to drive market innovation through popular franchises and immersive gaming experiences. Meanwhile, HTC supports growth with VR-based esports solutions, while MTG enhances reach through media rights and broadcasting. The combined efforts of these players foster rapid expansion, making the esports market a dynamic, highly competitive, and fast-evolving global industry.
Shape Your Report to Specific Countries or Regions & Enjoy 30% Off!
Key Player Analysis
Recent Developments
- In August 2025, Tencent showcased its strongest games lineup at gamescom 2025, promoting global esports ambitions and cross-platform integration.
- In June 2025, Valve Corporation held the BLAST.tv Austin Major—its first Counter-Strike 2 Major event with 32 teams competing, doubling previous Major field sizes.
- In 2025, Activision Blizzard emphasized tighter integration of advertising, user behavior analytics, and cross-platform gaming in its 2025 strategy.
Report Coverage
The research report offers an in-depth analysis based on Revenue Source, Streaming and Geography. It details leading market players, providing an overview of their business, product offerings, investments, revenue streams, and key applications. Additionally, the report includes insights into the competitive environment, SWOT analysis, current market trends, as well as the primary drivers and constraints. Furthermore, it discusses various factors that have driven market expansion in recent years. The report also explores market dynamics, regulatory scenarios, and technological advancements that are shaping the industry. It assesses the impact of external factors and global economic changes on market growth. Lastly, it provides strategic recommendations for new entrants and established companies to navigate the complexities of the market.
Future Outlook
- The esports market will continue expanding with double-digit growth across global regions.
- Sponsorships will remain the dominant revenue source, strengthening ties with global brands.
- Live streaming will sustain leadership as fans prefer real-time, interactive viewing.
- Mobile esports adoption will accelerate in emerging markets, expanding the player base.
- Investments in VR and metaverse integration will create immersive fan experiences.
- Global tournaments will grow in scale, boosting engagement and commercial opportunities.
- Hardware advancements from leading tech companies will enhance performance for competitive play.
- Increasing government recognition will support structured leagues and esports infrastructure.
- Player wellness initiatives will become essential to address burnout and career longevity.
- North America, Europe, and Asia Pacific will remain the leading regions, driving industry innovation.


