Market Overview
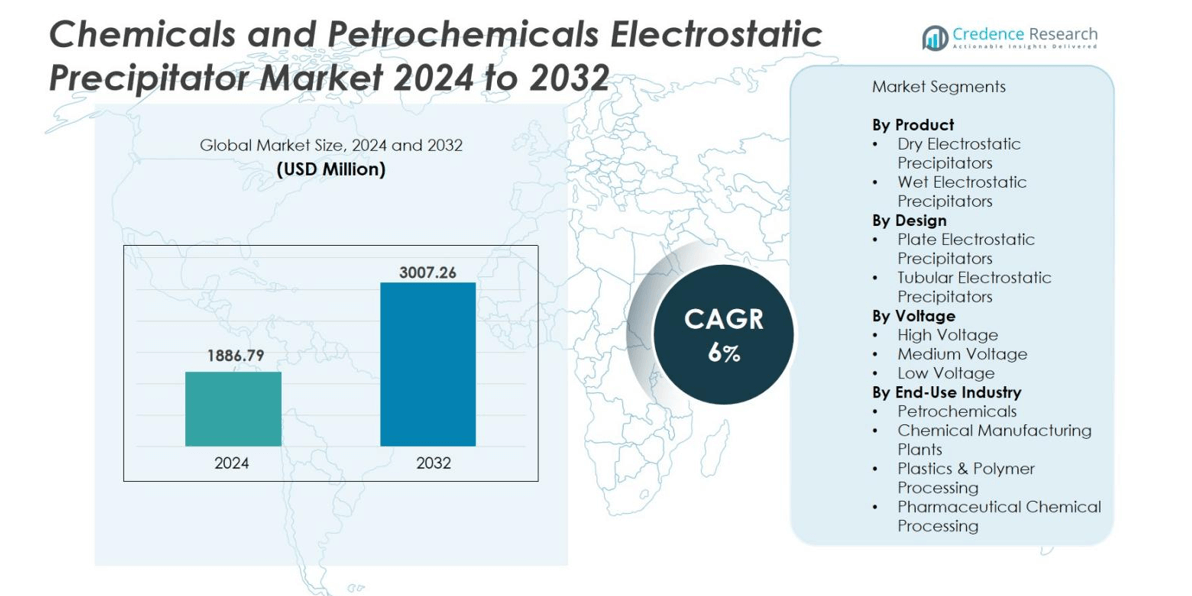
Chemicals and Petrochemicals Electrostatic Precipitator market size was valued USD 1886.79 million in 2024 and is anticipated to reach USD 3007.26 million by 2032, at a CAGR of 6% during the forecast period.
| REPORT ATTRIBUTE |
DETAILS |
| Historical Period |
2020-2023 |
| Base Year |
2024 |
| Forecast Period |
2025-2032 |
| Chemicals and Petrochemicals Electrostatic Precipitator Market Size 2024 |
USD 1886.79 million |
| Chemicals and Petrochemicals Electrostatic Precipitator Market, CAGR |
6% |
| Chemicals and Petrochemicals Electrostatic Precipitator Market Size 2032 |
USD 3007.26 million |
The Chemicals and Petrochemicals Electrostatic Precipitator market includes global manufacturers and regional engineering companies offering dry and wet ESP technologies. Key players include ANDRITZ GROUP, Babcock & Wilcox, Alstom, ELEX, GEA Group, FLSmidth, HIMENVIRO, KC Cottrell India, Isgec Heavy Engineering, and Enviropol Engineers. These companies focus on high-capacity systems, corrosion-resistant materials, and digital monitoring to improve efficiency and meet strict emission norms. Asia-Pacific remains the leading region with 41% market share, driven by expanding petrochemical complexes in China, India, and South Korea. Strong regulatory enforcement and large-scale refinery investments support continuous demand for new installations and retrofit projects across the region.
Market Insights
- Chemicals and Petrochemicals Electrostatic Precipitator market size was valued at USD 1886.79 million in 2024 and is projected to reach USD 3007.26 million by 2032, growing at a CAGR of 6%.
- Growing emission regulations in chemical and petrochemical processing plants drive adoption of dry ESPs, which hold 63% segment share due to high filtration efficiency and low operating cost.
- A major trend includes rising installation of wet ESPs for corrosive and sticky particulates, especially in sulfuric acid, polymer, and VOC treatment units, supported by improved corrosion-resistant designs.
- Competitively, global companies such as ANDRITZ GROUP, Babcock & Wilcox, FLSmidth, GEA Group, and KC Cottrell India expand through technology upgrades, digital monitoring, retrofitting services, and long-term maintenance contracts.
- Asia-Pacific leads with 41% regional share, driven by rapid petrochemical capacity expansion, while North America and Europe follow due to strict environmental compliance and modernization of aging dust-control systems.
Access crucial information at unmatched prices!
Request your sample report today & start making informed decisions powered by Credence Research Inc.!
Download Sample
Market Segmentation Analysis:
By Product
Dry electrostatic precipitators hold the dominant share of this segment, accounting for 63% of total installations. Industries prefer dry systems because they handle high-temperature flue gases and collect dust with lower operating costs. Chemical and petrochemical plants use dry ESPs to manage particulate matter from boilers, synthesis reactors, and cracking units. Their long service life, simple maintenance, and high dust collection efficiency support large-scale adoption. Wet electrostatic precipitators continue to grow in corrosive and sticky emissions environments, particularly for acid mists and fine aerosols, but adoption remains lower due to higher operational complexity.
- For instance, Mitsubishi Power uses dry ESPs extensively in coal-fired power plants to clean boiler emissions, valued for their long service life and dust collection efficiency.
By Design
Plate electrostatic precipitators lead this segment, capturing 69% share, driven by their efficiency in removing fine particulate matter from large gas volumes. The plate design supports modular installation across fertilizer units, chemical plants, polymer manufacturing, and refinery boilers. These systems offer easy maintenance and achieve stable removal rates even under fluctuating flue gas conditions. Tubular ESPs serve a smaller portion of the market because they are mainly used for low-gas-flow conditions and corrosive gases, such as sulfuric acid mist and chemical absorption units, limiting overall penetration compared to plate models.
- For instance, ANDRITZ announced its plate type ESP achieved up to 99.95 % removal efficiency for particles >5 µm in cement and power‑plant applications.
By Voltage
High-voltage electrostatic precipitators dominate with 58% of market share, as they deliver higher collection efficiency for sub-micron particulates. Refineries and petrochemical crackers prefer high-voltage systems because they reduce stack emissions, meet tightening regulatory limits, and maintain stable operation with varying gas loads. Medium-voltage systems follow in usage where plants require moderate dust-handling capacity at lower energy consumption. Low-voltage equipment remains limited to smaller chemical processing units and auxiliary boilers, resulting in a smaller uptake in large-scale petrochemical environments.
Key Growth Drivers
Stricter Emission Regulations and Compliance Standards
Governments are tightening emission norms for particulate matter, acid mist, and hazardous gases from petrochemical and chemical plants, which increases the adoption of electrostatic precipitators. Regulatory bodies across North America, Europe, and Asia enforce limits on fine dust, sulfur-based gases, and toxic aerosols released during synthesis, cracking, and refining operations. Electrostatic precipitators help facilities meet environmental compliance with high filtration efficiency, low maintenance demands, and safer operations. Increasing penalties for non-compliance, licensing restrictions, and mandatory stack emission monitoring encourage companies to upgrade outdated dust control systems.
- For instance, the U.S. Environmental Protection Agency (EPA) finalized air toxics rules targeting over 200 chemical plants which mandated an 80% reduction in hazardous emissions, driving wide ESP installations for compliance in synthetic organic chemical facilities.
Industrial Expansion in Petrochemical and Chemical Manufacturing
Global demand for plastics, polymers, fertilizers, pharmaceutical intermediates, and specialty chemicals is rising, leading to new chemical and petrochemical capacity additions. These plants rely on electrostatic precipitators to control particulate emissions from boilers, gasifiers, furnaces, fluid catalytic cracking units, and high-temperature reactors. Developing economies in Asia and the Middle East are investing in large integrated refining and petrochemical complexes, driving procurement of dry and wet ESP systems. At the same time, brownfield chemical plants are upgrading older filtration units to improve efficiency and reduce operational downtime. Growing investments in LNG-to-chemicals projects and downstream processing further support long-term equipment demand.
- For instance, Sinopec recently began upgrading its integrated refining and petrochemical project in Xinjiang, China, enhancing emission controls with advanced ESP systems as part of a broader capacity expansion.
Shift Toward Sustainable and Energy-Efficient Filtration Systems
Chemical and petrochemical producers focus on improving energy efficiency and reducing emissions together, which boosts adoption of advanced ESP technology. Modern electrostatic precipitators consume less power, reduce dust re-entrainment, and support continuous operation with lower maintenance frequency. Companies also prefer ESPs due to their long lifecycle, low waste generation, and ability to treat sub-micron particulates without using consumable filters. Industry players are integrating real-time monitoring, automatic voltage control, and digital diagnostics to optimize performance. The sustainability push encourages end users to replace bag filters and scrubbers with ESPs to meet long-term decarbonization goals, reduce visible plume pollution, and achieve cleaner industrial output. These improvements position ESPs as a preferred filtration method in emission-intensive chemical and petrochemical environments.
Key Trend & Opportunity
Increasing Demand for ESP Retrofits and Upgrades
A large number of petrochemical and chemical facilities operate legacy particulate control systems that require modernization to meet current regulatory standards. This creates opportunities for retrofitting electrostatic precipitators with better electrode designs, corrosion-resistant materials, and high-voltage control units. Service providers also offer digital monitoring platforms that track temperature, dust load, and spark discharge in real time to improve uptime. Many plants prefer retrofits instead of full replacement due to lower capital expenditure, shorter shutdown time, and higher return on investment. Vendors offering turnkey upgrades, remote diagnostics, and predictive maintenance solutions gain competitive advantage.
- For instance, Ecomak completed a fast-track retrofit of an ESP at a sinter plant in Karnataka, India, achieving sustained emission levels below 50 mg/Nm³, well within compliance limits, within 30 days of project initiation.
Rising Use of Wet ESPs in Acid Mist and Aerosol Removal
Acid mist emissions from sulfuric acid units, chlor-alkali plants, and VOC treatment systems create a growing market for wet electrostatic precipitators. These systems efficiently remove sticky aerosols and corrosive particulates that dry ESPs cannot handle. Increasing focus on controlling fine particle pollution, odor emissions, and hazardous chemical mist contributes to higher demand. Manufacturers develop wet ESPs with stainless steel internals, automatic cleaning functions, and corrosion-proof coatings to improve reliability in harsh chemical environments. As industries shift to cleaner production standards, wet ESP adoption rises in chemical plants dealing with toxic or moisture-laden gas flows.
- For instance, Babcock & Wilcox’s wet ESPs are used in sulfuric acid plants and chemical processing industries to remove submicron particulates and condensables with high efficiency.
Key Challenge
High Capital Cost and Installation Complexity
Electrostatic precipitators require significant investment compared to basic filtration technologies, which limits adoption among small and mid-scale chemical plants. Installation involves foundation work, structural support, and high-voltage systems, increasing upfront expenditure. Maintaining stable performance also requires skilled operators and periodic system tuning. Some companies delay upgrades or choose bag filters and scrubbers to minimize capital spending. High cost becomes a barrier especially in regions with slow industrial growth or limited emission enforcement. This challenge encourages vendors to offer rental models, modular ESP designs, and retrofit packages to reduce financial pressure on end users.
Performance Limitations Under Variable Gas Conditions
Flue gas temperature fluctuations, high moisture levels, and corrosive contaminants can reduce ESP efficiency. Chemical plants dealing with sticky particles, chloride-rich gases, and acidic vapors face operational issues like back-corona, re-entrainment, and electrode corrosion. Poor process stability results in lower particulate removal, frequent shutdowns, and higher maintenance costs. Plants sometimes install hybrid filtration systems or switch to alternative air pollution control equipment to handle unstable gas conditions. Manufacturers respond by developing improved electrode designs, corrosion-proof internals, and real-time voltage control systems, but performance limitations remain a concern in harsh industrial environments.
Regional Analysis
North America
North America holds 23% of the market, supported by strict environmental regulations from the EPA and the growth of large refining and petrochemical complexes in the United States and Canada. Chemical producers invest in dry and wet electrostatic precipitators to manage particulate emissions from cracking units, boilers, and fertilizer production plants. Rising shale gas and petrochemical expansion projects in Texas and the Gulf Coast region increase demand for high-capacity ESP systems. Brownfield modernization also drives retrofit opportunities, as older filtration units are upgraded to meet stricter particulate and hazardous gas emission limits across refineries and chemical manufacturing sites.
Europe
Europe accounts for 21% of the market, driven by strong compliance enforcement under regional emission directives and carbon reduction commitments. Countries such as Germany, France, Italy, and the Netherlands deploy ESPs in chemical reactors, polymer production lines, and gas treatment units to minimize fine particulate release. Petrochemical clusters in Northwest Europe, including Belgium and the UK, invest in advanced dry and wet ESP systems to meet sustainability goals. Industrial decarbonization programs and mandatory monitoring of stack emissions further encourage faster adoption. Retrofits remain common, as many facilities replace old dust collectors with energy-efficient electrostatic systems.
Asia-Pacific
Asia-Pacific dominates the global market with 41% share, fueled by rapid expansion of petrochemical, fertilizer, and chemical production across China, India, South Korea, and Southeast Asia. High-volume refining operations and integrated chemical complexes prefer dry electrostatic precipitators for managing heavy particulate emissions. Governments impose strict rules to control industrial air pollution, prompting new-build plants to adopt advanced ESPs. Growing investments in polymer, aromatics, and specialty chemical capacity also support steady product demand. Many brownfield plants upgrade outdated filtration systems to meet pollution norms, making Asia-Pacific the fastest-growing ESP market.
Latin America
Latin America holds 8% of the market, driven by refinery expansion, chemical production upgrades, and tightening emission regulations in Brazil, Mexico, and Argentina. Regional governments push clean-air initiatives and stricter pollutant controls in industrial zones. Petrochemical plants prefer ESPs to manage dust and acid mist from boilers, reformers, and polymerization units. New fertilizer capacity additions and gas-to-chemicals projects create additional demand. However, investment cycles depend on economic stability, causing slow replacement of outdated equipment. Despite this, suppliers targeting retrofit projects and turnkey solutions find steady opportunities in mid-scale chemical operations across the region.
Middle East & Africa
The Middle East & Africa represents 7% of the market, supported by growth in large refining and petrochemical hubs in Saudi Arabia, the UAE, Qatar, and South Africa. High-capacity dry precipitators are preferred in crude processing, cracking units, and fertilizer production. New petrochemical complexes and integrated refinery-to-chemicals plants increase equipment demand. Government-backed industrial diversification projects also encourage investment in emission-control technologies. Adoption remains lower in parts of Africa due to limited industrial scale, but modernization programs and environmental reforms are expected to drive gradual uptake of ESP systems in the coming years.
Market Segmentations:
By Product
- Dry Electrostatic Precipitators
- Wet Electrostatic Precipitators
By Design
- Plate Electrostatic Precipitators
- Tubular Electrostatic Precipitators
By Voltage
- High Voltage
- Medium Voltage
- Low Voltage
By End-Use Industry
- Petrochemicals
- Chemical Manufacturing Plants
- Plastics & Polymer Processing
- Pharmaceutical Chemical Processing
By Geography
- North America
- Europe
- Germany
- France
- U.K.
- Italy
- Spain
- Rest of Europe
- Asia Pacific
- China
- Japan
- India
- South Korea
- South-east Asia
- Rest of Asia Pacific
- Latin America
- Brazil
- Argentina
- Rest of Latin America
- Middle East & Africa
- GCC Countries
- South Africa
- Rest of the Middle East and Africa
Competitive Landscape
The competitive landscape of the Chemicals and Petrochemicals Electrostatic Precipitator market features global equipment manufacturers, regional engineering firms, and specialized aftermarket service providers. Leading companies focus on high-efficiency dry and wet ESP systems that handle corrosive gases, high dust loads, and fluctuating flue gas conditions common in petrochemical and chemical processing plants. Players compete through technology upgrades such as automated voltage control, digital monitoring, predictive maintenance, and corrosion-resistant electrode materials. Many suppliers also offer retrofit and refurbishment services to help plants meet emission standards without full system replacement. Partnerships with refineries, fertilizer producers, and polymer manufacturers support long-term service contracts and recurring revenue. Asia-Pacific manufacturers gain share through cost-competitive equipment and turnkey installations, while European and North American firms emphasize premium designs and advanced compliance capabilities. Growing demand for large-capacity ESPs, modernization projects, and environmental mandates continues to intensify competition across global and regional markets.
Shape Your Report to Specific Countries or Regions & Enjoy 30% Off!
Key Player Analysis
- HIMENVIRO
- KC Cottrell India
- Alstom
- ELEX
- GEA Group
- ANDRITZ GROUP
- Babcock & Wilcox
- Isgec Heavy Engineering
- FLSmidth
- Enviropol Engineers
Recent Developments
- In February 2025, Andritz Group acquired LDX Solutions, a specialist in emissions-reduction technology, to enhance its pollution-control offerings, particularly in the chemical and petrochemical sectors.
- In June 2024, Babcock & Wilcox announced securing over $18 million in contracts to design and supply both wet and dry electrostatic precipitator rebuilds for utility and industrial facilities in the U.S. and Europe.
- In February 2024, Valmet Oyj received an order to deliver electrostatic precipitators (ESPs) for the recovery boiler at Nordic Paper AB’s Bäckhammar mill in Sweden, with the project scheduled for completion by the end of 2025.
Report Coverage
The research report offers an in-depth analysis based on Product, Design, Voltage, End-Use Industry and Geography. It details leading market players, providing an overview of their business, product offerings, investments, revenue streams, and key applications. Additionally, the report includes insights into the competitive environment, SWOT analysis, current market trends, as well as the primary drivers and constraints. Furthermore, it discusses various factors that have driven market expansion in recent years. The report also explores market dynamics, regulatory scenarios, and technological advancements that are shaping the industry. It assesses the impact of external factors and global economic changes on market growth. Lastly, it provides strategic recommendations for new entrants and established companies to navigate the complexities of the market.
Future Outlook
- Demand for high-capacity ESPs will rise as new petrochemical complexes come online.
- Adoption of digital monitoring and predictive maintenance will grow across major plants.
- Retrofitting of old filtration units will increase as emission limits become stricter.
- Wet ESP installations will expand in sulfuric acid and VOC-heavy chemical production lines.
- Energy-efficient electrode and voltage control technologies will gain wider use.
- Service-based revenue models will rise as companies seek low-downtime maintenance.
- Asia-Pacific will maintain leadership due to ongoing refinery and petrochemical investments.
- Europe and North America will focus on modernization projects aligned with decarbonization goals.
- Manufacturers will offer corrosion-resistant materials to improve lifecycle performance.
- Competition among global and regional ESP suppliers will intensify with turnkey and automated solutions.


