Market Overview:
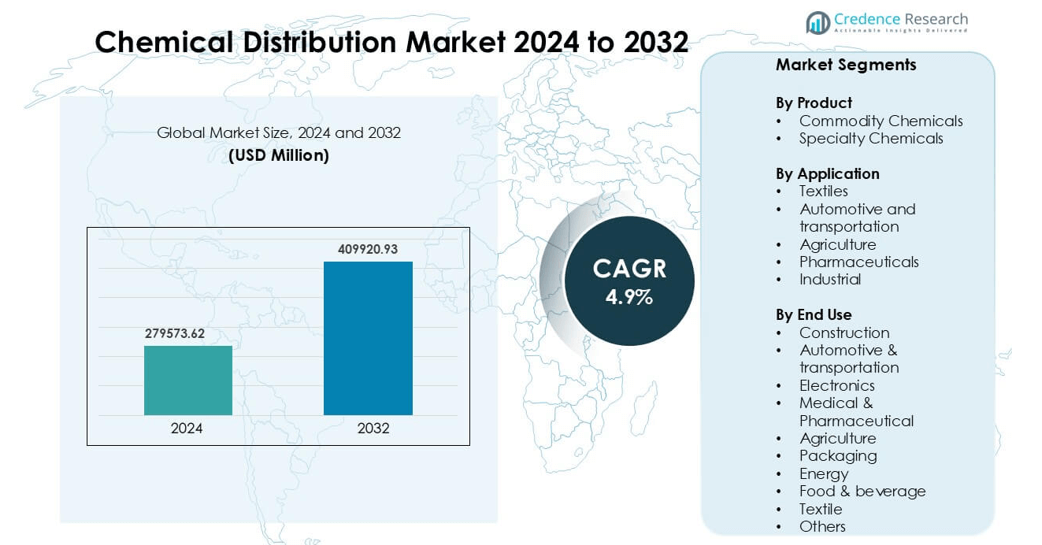
Chemical Distribution Market was valued at USD 279573.62 million in 2024 and is anticipated to reach USD 409920.93 million by 2032, growing at a CAGR of 4.9 % during the forecast period.
| REPORT ATTRIBUTE |
DETAILS |
| Historical Period |
2020-2023 |
| Base Year |
2024 |
| Forecast Period |
2025-2032 |
| Chemical Distribution Market Size 2024 |
USD 279573.62 million |
| Chemical Distribution Market, CAGR |
4.9% |
| Chemical Distribution Market Size 2032 |
USD 409920.93 million |
The global chemical distribution market is dominated by key players such as Brenntag AG, Univar Solutions Inc., Azelis, Barentz, Safic-Alcan, Helm AG, Ter Group, ICC Industries, Quimidroga, and Jebsen & Jessen Pte. Ltd. These companies lead through extensive global networks, diversified product portfolios, and strong partnerships with chemical manufacturers. Brenntag AG and Univar Solutions Inc. hold significant market influence due to their broad geographic presence and advanced digital distribution platforms. Asia-Pacific emerges as the leading regional market, accounting for approximately 43% of the global share, driven by rapid industrialization, expanding manufacturing sectors, and increasing demand for specialty chemicals across China, India, and Southeast Asia.
Market Insights
- The global chemical distribution market was valued at USD 279573.62 million in 2024 and is projected to reach USD 409920.93 million by 2032, growing at a CAGR of around 4.9% during the forecast period.
- Market growth is driven by rising demand for specialty chemicals across industries such as pharmaceuticals, construction, and electronics, supported by increasing industrialization in emerging economies.
- Key trends include digital transformation, sustainability-focused distribution, and expansion of e-commerce platforms that enhance supply chain visibility and efficiency.
- The market is moderately consolidated, with major players like Brenntag AG, Univar Solutions Inc., and Azelis leading through acquisitions, global reach, and strong supplier networks.
- Asia-Pacific dominates the market with approximately 43% regional share, while specialty chemicals hold the largest segment share, driven by rapid industrial expansion and growing adoption of high-performance, eco-friendly chemical products.
Access crucial information at unmatched prices!
Request your sample report today & start making informed decisions powered by Credence Research Inc.!
Download Sample
Market Segmentation Analysis:
By Product
The chemical distribution market is segmented into commodity chemicals and specialty chemicals. Specialty chemicals dominate the segment, accounting for the largest market share due to their growing demand across industries such as pharmaceuticals, construction, and electronics. These chemicals are valued for their performance-oriented properties and tailored formulations that enhance manufacturing efficiency. Increasing R&D investments and rising applications in advanced materials, coatings, and agrochemicals further strengthen the specialty chemicals segment. Meanwhile, commodity chemicals maintain steady growth, driven by their essential role in bulk manufacturing and industrial processes.
- For instance, Azelis operates over 70 application laboratories worldwide, delivering tailored specialty chemical formulations and technical support to customers across more than 65 geographies.
By Application
Among the major applications textiles, automotive and transportation, agriculture, pharmaceuticals, and industrial the industrial segment holds the dominant market share. The segment’s growth is driven by the high demand for chemicals used in manufacturing, processing, and maintenance across heavy industries. Industrial applications rely on both specialty and commodity chemicals for processes such as water treatment, lubrication, and metal cleaning. Additionally, rapid industrialization in emerging economies and increasing investments in infrastructure and manufacturing activities continue to drive the expansion of this segment.
- For instance, Brenntag AG serves approximately 195,000 customers in sectors including coatings, oil & gas, pharmaceuticals and industrial water treatment.
By End Use
Within end-use industries construction, automotive & transportation, electronics, medical & pharmaceutical, agriculture, packaging, energy, food & beverage, textile, and others—the construction sector leads the market. This dominance stems from the extensive use of chemicals in coatings, adhesives, sealants, and concrete additives. The sector benefits from rising urbanization, infrastructure development, and renovation activities globally. Demand for eco-friendly and high-performance materials also supports market growth. Additionally, specialty chemicals that enhance durability and energy efficiency of buildings are key drivers fueling the expansion of the construction segment.
Key Growth Drivers
Rising Demand for Specialty Chemicals
The growing need for specialty chemicals across industries such as pharmaceuticals, construction, and electronics is a major driver of the chemical distribution market. These chemicals offer advanced properties and application-specific benefits that enhance performance, efficiency, and sustainability. Increasing adoption of customized formulations in end-use sectors supports higher margins and long-term partnerships between producers and distributors. Additionally, the shift toward high-value products in coatings, adhesives, and agrochemicals strengthens market expansion. Distributors are focusing on technical expertise and tailored supply solutions to meet the evolving demands of specialized sectors, further propelling market growth.
- For instance, Brenntag AG’s specialty division recorded an operating gross profit of EUR 1,479.6 million in its Specialties segment, reflecting its deep involvement in high-value specialty chemical distribution domains.
Expansion of End-Use Industries
The rapid growth of key end-use sectors, including construction, automotive, and energy, significantly contributes to the expansion of the chemical distribution market. Urbanization, infrastructure development, and industrial modernization in emerging economies are fueling demand for construction and performance chemicals. Similarly, advancements in electric vehicles and renewable energy applications are increasing the need for specialty materials and lubricants. Distributors are capitalizing on this momentum by expanding their product portfolios and logistics networks to ensure timely and efficient delivery. This industrial growth, coupled with the globalization of supply chains, continues to reinforce the market’s upward trajectory.
- For instance, Univar Solutions Inc. announced the acquisition of Valley Solvents & Chemicals Company to enhance its North American distribution network and custom solvent-blending capabilities in the energy and industrial markets.
Globalization and Supply Chain Optimization
The increasing globalization of trade and the rising complexity of chemical supply chains are key drivers shaping the distribution market. Distributors play a critical role in bridging the gap between chemical producers and end-users by providing value-added services such as inventory management, regulatory compliance, and technical support. The demand for efficient logistics, safe handling, and just-in-time delivery has increased, pushing companies to adopt digital platforms and integrated supply chain solutions. This trend not only enhances transparency and operational efficiency but also enables distributors to respond swiftly to market fluctuations and customer needs, strengthening their competitive advent
Key Trends & Opportunities
Digital Transformation and E-Commerce Integration
Digitalization is reshaping the chemical distribution landscape by improving supply chain transparency, customer engagement, and operational efficiency. Distributors are investing in digital platforms that enable online ordering, inventory tracking, and predictive demand forecasting. The integration of e-commerce solutions allows smaller customers to access a broader range of products conveniently, expanding distributors’ market reach. Data analytics and automation further enhance decision-making, helping companies optimize pricing and logistics. As the industry adopts digital tools, opportunities emerge for enhanced collaboration, reduced operational costs, and improved responsiveness to shifting customer requirements, making digital transformation a critical growth enabler.
- For instance, Brenntag AG launched its “Brenntag Connect” e-commerce platform across mature markets and partnered with CheMondis to make its portfolio digitally available enabling digital transactions via a platform listing over 50,000 products.
Rising Focus on Sustainability and Green Chemistry
Sustainability has become a defining trend in the chemical distribution market as stakeholders prioritize environmentally responsible products and practices. Distributors are increasingly aligning with manufacturers to supply bio-based, recyclable, and low-emission chemicals that comply with global environmental standards. This shift is driven by regulatory pressures and growing customer awareness of eco-friendly alternatives. Companies adopting circular economy principles and sustainable packaging solutions are gaining a competitive edge. The opportunity lies in expanding portfolios of green chemicals and developing partnerships with renewable material producers, enabling distributors to position themselves as strategic contributors to a low-carbon future.
- For instance, Brenntag AG opened its first CO₂-emission–free chemical distribution site in Traun, Austria, saving around 120 tons of CO₂ per year and generating approximately 220,000 kWh of electricity annually via a 220 kWp photovoltaic system.
Key Challenges
Stringent Regulatory Compliance
Compliance with complex and evolving environmental, safety, and trade regulations presents a significant challenge for chemical distributors. Global frameworks such as REACH, GHS, and various regional standards require meticulous documentation, labeling, and transportation protocols. Managing these requirements across multiple jurisdictions increases administrative costs and operational burdens. Smaller distributors, in particular, face difficulties in maintaining compliance due to limited resources and technical expertise. Failure to adhere to regulations can lead to legal penalties and reputational damage. Therefore, continuous investment in compliance systems, employee training, and digital tracking tools is essential to mitigate this challenge.
Volatility in Raw Material Prices and Supply Chain Disruptions
Fluctuating raw material prices and recurring supply chain disruptions significantly affect the profitability of chemical distributors. Market uncertainties caused by geopolitical tensions, transportation bottlenecks, and energy cost fluctuations create instability in product availability and pricing. These challenges are further intensified by global dependencies on key chemical-producing regions. Distributors must manage inventory strategically and maintain strong supplier relationships to minimize risks. Diversifying sourcing options, investing in resilient logistics infrastructure, and leveraging data-driven forecasting are critical strategies to navigate these disruptions and ensure consistent supply to end users.
Regional Analysis
North America
North America holds a significant share of the global chemical distribution market, accounting for approximately 25–30% of total revenue. The region’s strong industrial base, advanced logistics infrastructure, and high demand from pharmaceuticals, construction, and automotive sectors drive growth. The United States leads the market due to its large-scale manufacturing and innovation in specialty chemicals. Distributors in North America focus on sustainability, digital transformation, and strategic partnerships with global suppliers. Additionally, growing investments in renewable energy and bio-based chemicals support market expansion, enhancing the region’s role as a key player in global chemical distribution.
Europe
Europe represents around 20–25% of the global chemical distribution market, driven by its mature industrial network and stringent environmental regulations. Countries such as Germany, France, and the Netherlands dominate due to their strong chemical production and advanced logistics systems. The region’s focus on green chemistry, circular economy initiatives, and compliance with REACH standards promotes sustainable distribution practices. Specialty chemicals account for a major share, supported by robust demand from automotive, healthcare, and electronics industries. Continuous innovation, coupled with digitalization in supply chain management, positions Europe as a leader in value-added and environmentally responsible chemical distribution.
Asia-Pacific
Asia-Pacific leads the global chemical distribution market, capturing approximately 40–45% of total market share. Rapid industrialization, urbanization, and expanding manufacturing activities across China, India, and Southeast Asia drive this dominance. The region’s growing demand for specialty and commodity chemicals in construction, agriculture, and consumer goods sectors strengthens market growth. Local distributors benefit from proximity to large chemical producers and expanding trade networks. Additionally, government support for industrial development and foreign investment enhances market competitiveness. Asia-Pacific’s large customer base and continuous infrastructure advancements ensure it remains the fastest-growing and most dynamic regional market.
Latin America
Latin America accounts for around 8–10% of the global chemical distribution market, driven by demand from agriculture, construction, and energy industries. Brazil and Mexico are the leading markets, supported by strong agricultural output and growing manufacturing sectors. The region’s distributors are increasingly focusing on improving supply chain efficiency and expanding specialty chemical portfolios. Economic reforms and trade liberalization are attracting foreign investment, boosting growth potential. However, infrastructure limitations and regulatory complexities pose challenges. Despite these, Latin America offers significant opportunities for expansion, particularly through strategic partnerships and the development of localized distribution networks.
Middle East & Africa
The Middle East & Africa (MEA) region holds a 5–7% share of the global chemical distribution market, with growth primarily driven by the energy, construction, and industrial sectors. The Middle East benefits from its vast petrochemical base, supplying both commodity and specialty chemicals to global markets. Africa’s emerging economies, such as South Africa and Nigeria, are witnessing rising demand due to infrastructure development and urbanization. Distributors in the region are investing in logistics infrastructure and regional storage hubs to improve supply efficiency. Ongoing diversification efforts and industrial expansion continue to create promising opportunities in the MEA market.
Market Segmentations:
By Product
- Commodity Chemicals
- Specialty Chemicals
By Application
- Textiles
- Automotive and transportation
- Agriculture
- Pharmaceuticals
- Industrial
By End Use
- Construction
- Automotive & transportation
- Electronics
- Medical & Pharmaceutical
- Agriculture
- Packaging
- Energy
- Food & beverage
- Textile
- Others
By Geography
- North America
- Europe
- Germany
- France
- U.K.
- Italy
- Spain
- Rest of Europe
- Asia Pacific
- China
- Japan
- India
- South Korea
- South-east Asia
- Rest of Asia Pacific
- Latin America
- Brazil
- Argentina
- Rest of Latin America
- Middle East & Africa
- GCC Countries
- South Africa
- Rest of the Middle East and Africa
Competitive Landscape
The chemical distribution market is highly competitive, characterized by the presence of global leaders and regional players offering diverse portfolios of specialty and commodity chemicals. Major companies such as Brenntag AG, Univar Solutions Inc., Azelis, Barentz, and Safic-Alcan dominate the market through extensive distribution networks, strategic acquisitions, and strong supplier partnerships. These players focus on expanding geographic reach, enhancing digital capabilities, and offering value-added services such as formulation support, regulatory compliance, and customized packaging. Regional distributors like Ter Group, Helm AG, ICC Industries, Quimidroga, and Jebsen & Jessen strengthen their positions by targeting niche markets and fostering local relationships. The competitive landscape is increasingly shaped by sustainability initiatives, digital supply chain integration, and portfolio diversification into high-growth sectors like pharmaceuticals, food, and personal care. Strategic mergers and acquisitions remain a key growth strategy, enabling distributors to enhance product access, strengthen customer bases, and maintain a competitive edge in a rapidly evolving global market.
Shape Your Report to Specific Countries or Regions & Enjoy 30% Off!
Key Player Analysis
- Brenntag AG
- Azelis
- Univar Solutions Inc.
- Barentz
- Safic-Alcan
- Helm AG
- Ter Group
- ICC Industries, Inc.
- Quimidroga
- Jebsen & Jessen Pte. Ltd.
Recent Developments
- In Aug 2025, Univar Solutions Inc. Expanded BASF distribution for polyurethane, coatings, and adhesives in North America.
- In June 2025, Brenntag AG Opened a CO₂-emission-free distribution site in Traun, Austria.
- In May 2025 Univar Solutions Inc. Became preferred distributor for Tedia’s high-purity solvents in U.S. and Canada
Report Coverage
The research report offers an in-depth analysis based on Product, Application, End-Use and Geography. It details leading market players, providing an overview of their business, product offerings, investments, revenue streams, and key applications. Additionally, the report includes insights into the competitive environment, SWOT analysis, current market trends, as well as the primary drivers and constraints. Furthermore, it discusses various factors that have driven market expansion in recent years. The report also explores market dynamics, regulatory scenarios, and technological advancements that are shaping the industry. It assesses the impact of external factors and global economic changes on market growth. Lastly, it provides strategic recommendations for new entrants and established companies to navigate the complexities of the market.
Future Outlook
- The chemical distribution market will continue expanding due to increasing demand for specialty and performance chemicals across diverse industries.
- Distributors will adopt advanced digital tools to enhance transparency, efficiency, and real-time supply chain management.
- Sustainability initiatives will drive a shift toward bio-based, recyclable, and low-emission chemical products.
- Strategic mergers and acquisitions will intensify as companies seek to strengthen regional presence and product portfolios.
- Asia-Pacific will remain the fastest-growing region, supported by industrialization and manufacturing expansion.
- E-commerce and digital marketplaces will become primary channels for chemical sales and customer engagement.
- Distributors will focus more on regulatory compliance, safety standards, and environmental certifications.
- Customized and value-added services such as technical support and formulation assistance will gain prominence.
- Investments in logistics infrastructure and regional warehousing will improve delivery speed and reliability.
- Collaboration between producers and distributors will increase to ensure sustainable and flexible global supply chains.


