Market overview
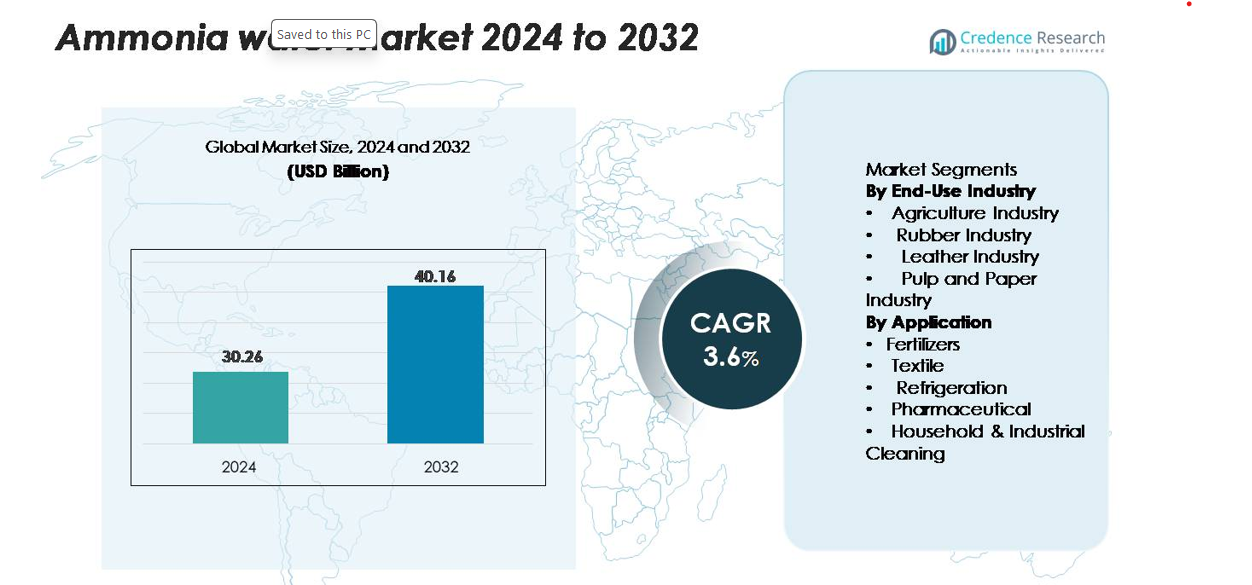
The Ammonia Water market was valued at USD 30.26 billion in 2024 and is projected to reach USD 40.16 billion by 2032, growing at a CAGR of 3.6% during the forecast period.
| REPORT ATTRIBUTE |
DETAILS |
| Historical Period |
2020-2023 |
| Base Year |
2024 |
| Forecast Period |
2025-2032 |
| Ammonia Water Market Size 2024 |
USD 30.26 billion |
| Ammonia Water Market, CAGR |
3.6% |
| Ammonia Water Market Size 2032 |
USD 40.16 billion |
The global ammonia‑water arena features prominent players including Yara International ASA (Norway), CF Industries Holdings, Inc. (US), BASF SE (Germany) and Nutrien Ltd. (Canada). These firms leverage large‑scale production assets, global distribution networks and strong R&D investments to maintain competitive advantage. Regionally, the Asia Pacific region dominated with approximately 52.5% of the market share in 2024, bolstered by extensive agricultural activity and rising industrial demand. Their combined strategies and regional strength shape market dynamics and set benchmarks for other competitors.
Market Insights
- The global ammonia water market size was valued at USD 30.26 billion in 2024 and is projected to reach USD 40.16 billion by 2032 at a CAGR of 3.6%.
- The agriculture end‑use industry dominates the market with a share of around 40%‑45%, driven by extensive use in nitrogen‑based fertilizers.
- Key trends include technological innovations expanding use into industrial cleaning and refrigeration, and growth opportunities in emerging markets such as Asia‑Pacific where the region holds over 60% of revenue share.
- Competitive analysis shows major players leveraging global distribution networks, while regional producers compete on price and supply responsiveness, creating moderate market concentration.
- Market restraints include volatility in ammonia raw‑material prices and strict handling/safety regulations that raise operational costs and challenge smaller producers.
Access crucial information at unmatched prices!
Request your sample report today & start making informed decisions powered by Credence Research Inc.!
Download Sample
Market Segmentation Analysis:
By End-Use Industry
The agriculture industry dominates the ammonia water market, holding the largest share of 42% in 2024. Strong demand is driven by its extensive use in nitrogen-based fertilizers, improving crop yields and soil fertility. The pulp and paper sector follows, leveraging ammonia water for pulping and bleaching processes, enhancing production efficiency. Rubber and leather industries utilize ammonia water for chemical processing and treatment, supporting durability and product quality. Overall, growth in agriculture and industrial processing, coupled with increasing mechanization and modern farming practices, underpins steady market expansion across these end-use sectors.
- For instance, Nutrien Ltd. operates fertilizer production assets capable of supplying more than 7 million tonnes of ammonia annually, and a defined portion of this volume is converted into aqueous ammonia for downstream agricultural blending plants.
By Application
Fertilizers represent the dominant application, accounting for 45% of the market in 2024, fueled by global agricultural intensification and rising food demand. Household and industrial cleaning follows as a growing segment, driven by ammonia water’s disinfectant and degreasing properties. The pharmaceutical and refrigeration sectors also contribute to demand, using ammonia water in cooling systems and chemical synthesis. Textile applications, including dyeing and finishing, further support consumption. Expanding industrialization, stringent quality standards, and increasing adoption in diverse sectors collectively reinforce the market’s application-driven growth trajectory.
- For instance, Yara International ASA operates its ammonia-to-fertilizer complex in Porsgrunn, Norway, where the ammonia unit is designed for 530,000 tonnes per year and a defined share is converted into aqueous ammonia for downstream nitrate fertilizer production, as documented in Yara’s official plant specifications.
Key Growth Drivers
Rising Demand in Agriculture Sector
The agriculture sector remains the primary growth driver for the ammonia water market, propelled by the increasing need for nitrogen-rich fertilizers. Ammonia water improves crop yields and soil fertility, supporting food security amid growing global populations. Mechanized farming, government subsidies, and adoption of advanced agronomic practices further amplify demand. Countries with intensive agriculture, particularly in Asia-Pacific, drive large-scale consumption. Additionally, the trend toward high-efficiency fertilizers and precision farming encourages the use of ammonia water as a cost-effective and versatile nitrogen source. Expansion in global agricultural output and continuous improvements in fertilizer formulations sustain steady market growth.
- For instance, the Indian government distributed over 250 million (25 crore) soil health cards across all cycles to support optimized nitrogen use, as documented by the Press Information Bureau (PIB) under the Ministry of Agriculture & Farmers Welfare. Countries in the Asia-Pacific region are major users of this approach due to intensive cultivation practices and high fertilizer demand.
Industrial and Household Applications Expansion
Industrial and household sectors contribute significantly to market growth. In industrial cleaning, ammonia water is widely used as a degreaser and disinfectant, offering cost efficiency and effectiveness. The pharmaceutical, refrigeration, and textile industries also leverage its chemical properties for production processes, cooling systems, and textile finishing. Urbanization, rising disposable income, and industrialization in emerging markets boost consumption. Moreover, increasing awareness of hygiene and sanitation standards in households and industries supports sustained demand. Manufacturers are innovating formulations tailored to specific industrial and domestic applications, reinforcing market penetration and growth.
- For instance, 3M confirms in the technical data sheet for its Neutral Quat Disinfectant Cleaner (specifically Concentrate 23) that the ready-to-use formulation contains approximately 660 ppm (parts per million) quaternary ammonium compounds. This concentration achieves verified microbial reduction within 10 minutes of surface contact for most bacteria, fungi, and viruses, including MRSA, VRE, and influenza.
Environmental Regulations and Sustainable Practices
Strict environmental regulations and the push for sustainable chemical usage drive ammonia water adoption. Its relatively low carbon footprint compared to alternative chemical solutions appeals to industries seeking eco-friendly processes. Governments encourage cleaner production methods in agriculture, manufacturing, and cleaning applications, which increases the preference for ammonia water. Biodegradability and efficiency in chemical reactions further enhance its acceptance. Companies invest in R&D to develop high-purity, low-emission ammonia water products, aligning with regulatory compliance. Rising sustainability awareness among consumers and industries reinforces its use in fertilizers, cleaning agents, and industrial processes, contributing to long-term market expansion.
Key Trends & Opportunities
Growth of Online Distribution Channels
E-commerce platforms and digital marketplaces create new opportunities for ammonia water distribution. Online channels offer fast delivery, bulk supply options, and accessibility for industrial and agricultural customers. Companies leverage digital marketing, subscription models, and doorstep delivery to expand their reach. This trend reduces reliance on traditional retail networks, enabling faster regional expansion. Small and medium-sized enterprises benefit from simplified procurement, while global manufacturers enter emerging markets with online sales. Enhanced transparency through product reviews and certifications further supports customer trust and adoption.
- For instance, Fisher Scientific lists aqueous ammonia grades up to 14 mol/L in its online catalog, and each shipment includes digital Safety Data Sheets and batch-traceability records for laboratory and plant users.
Technological Innovations in Application
Technological advancements are opening new applications for ammonia water across industries. Innovations in refrigeration systems, cleaning formulations, and pharmaceutical synthesis improve efficiency, safety, and cost-effectiveness. For instance, ammonia water-based degreasers with higher concentration ratios reduce waste and energy consumption. Similarly, modern fertilizer blends enhance nutrient delivery and reduce environmental impact. Research into hybrid chemical processes creates potential in textile, pulp, and paper industries. These developments provide competitive advantages to manufacturers and encourage wider adoption across end-use sectors, boosting market growth and profitability.
Expansion into Emerging Markets
Emerging markets present significant growth opportunities for ammonia water, driven by industrialization, urbanization, and agricultural modernization. Asia-Pacific and Latin America show increasing demand for fertilizers, industrial cleaning agents, and refrigeration solutions. Infrastructure development, government incentives, and investment in modern agriculture accelerate market penetration. Companies are establishing local production facilities, distribution networks, and partnerships to capitalize on regional demand. Rising awareness of quality and safety standards in industrial and domestic applications further fuels adoption. Expansion into these regions offers long-term revenue potential and supports market diversification.
Key Challenges
Volatility in Raw Material Prices
Ammonia water production relies on raw materials like ammonia and water, which are subject to price fluctuations due to supply-demand imbalances, geopolitical tensions, and energy costs. Sudden increases in ammonia prices raise production costs, affecting profitability and pricing strategies for manufacturers. Additionally, transportation and storage challenges for ammonia can exacerbate cost pressures. Industries dependent on ammonia water, such as agriculture and manufacturing, may face supply chain disruptions, limiting adoption. Price volatility requires companies to adopt risk mitigation strategies, including long-term contracts and alternative sourcing, but remains a persistent challenge affecting market stability.
Safety and Handling Concerns
Ammonia water is corrosive and requires careful handling, storage, and transportation. Safety regulations and compliance standards impose operational constraints on manufacturers, distributors, and end-users. Accidental exposure can cause health hazards, including respiratory issues and skin irritation, limiting usage in certain environments. Stringent safety protocols increase operational costs and require specialized training for workers. Smaller enterprises may find compliance challenging, which can restrict market penetration. Despite its industrial and agricultural benefits, the risks associated with ammonia water handling remain a key challenge for widespread adoption and long-term market growth.
Regional Analysis
North America
North America holds approximately 26 % of the global ammonia‑water market share in 2024. The region benefits from extensive agricultural lands, mature industrial cleaning and refrigeration sectors, and strict environmental regulations that promote cleaner chemical solutions. Strong investment in infrastructure and modern farming methods elevates ammonia water demand across applications. The United States leads the region, with Canada contributing through feedstock and fertilizer production. Innovation in chemical processing and household cleaning also fuels moderate growth.
Europe
Europe accounts for around 24 % of the global market share for ammonia water. The region’s growth draws support from stringent regulations on chemical emissions and strong demand in agriculture, pulp & paper, and industrial cleaning sectors. Countries such as Germany, France and the UK lead adoption of efficient ammonia‑based solutions. The push for sustainability under frameworks like the European Green Deal accelerates use of lower impact chemical processes. Mature markets mean growth is steady rather than explosive.
Asia‑Pacific
The Asia‑Pacific region commands roughly 35 % of the global ammonia‑water market share. Rapid growth stems from expanding agriculture, industrialisation and large‑scale infrastructure development in countries such as China, India, and Southeast Asia. High population growth, rising food demand and modernisation of factories boost ammonia water use in fertilizers, textile, leather, and cleaning applications. Emerging economies in the region are scaling capacity rapidly, creating strong near‑term opportunities.
Latin America
Latin America represents about 8 % of global ammonia water consumption. Growth in the region is driven by expanding agriculture in Brazil and Argentina, evolving industrial cleaning practices and increasing use in pulp and paper operations. Investment in modern farming and chemical processing provides momentum. However, slower infrastructure build‑out and regulatory complexity temper growth compared with Asia‑Pacific and Europe.
Middle East & Africa
The Middle East & Africa region holds around 7 % of the global ammonia‑water market share. Demand arises from agricultural expansion in arid regions, investments in large‑scale industrial plants and the need for efficient refrigeration and cleaning solutions in hot climates. Governments in the Middle East focus on diversifying their economies, which supports industrial chemical uptake. Still, infrastructural constraints and supply‑chain logistics present headwinds for rapid growth.
Market Segmentation
By End-Use Industry
- Agriculture Industry
- Rubber Industry
- Leather Industry
- Pulp and Paper Industry
By Application
- Fertilizers
- Textile
- Refrigeration
- Pharmaceutical
- Household & Industrial Cleaning
By Geography
- North America
- Europe
- Germany
- France
- U.K.
- Italy
- Spain
- Rest of Europe
- Asia Pacific
- China
- Japan
- India
- South Korea
- South-east Asia
- Rest of Asia Pacific
- Latin America
- Brazil
- Argentina
- Rest of Latin America
- Middle East & Africa
- GCC Countries
- South Africa
- Rest of the Middle East and Africa
Competitive Landscape
The competitive landscape for the ammonia‑water market reflects consolidation among large, global chemical players as well as fragmentation at regional levels. Key incumbents such as Yara International ASA, CF Industries Holdings, Inc., Nutrien Ltd. and BASF SE control a significant share of manufacturing capacity, leveraging scale, global distribution networks and broad product portfolios. These firms allocate resources to R&D, such as lower‑emission and high‑efficiency ammonia‑water derivatives, to differentiate from regional and midsize competitors. Recent strategic initiatives include partnerships, acquisitions and capacity expansions aimed at strengthening geographic reach and product differentiation. The presence of many regional and local producers ensures persistent competition on pricing, supply‑chain responsiveness and niche applications—keeping margins under pressure and driving greater emphasis on operational efficiency and technological advancement.
Shape Your Report to Specific Countries or Regions & Enjoy 30% Off!
Key Player Analysis
- BASF SE (Ludwigshafen, Germany)
- China National Petroleum Corporation (Beijing, China)
- Nutrien Ltd. (Saskatoon, Canada)
- Yara International ASA (Oslo, Norway)
- Koch Fertilizer, LLC (Kansas, the U.S.)
- EuroChem Group (Zug, Switzerland)
- Qatar Petroleum (Doha, Qatar)
- CF Industries Holdings, Inc. (Illinois, the U.S.)
- Praxair Technology, Inc. (Connecticut, the U.S.)
- SABIC (Riyadh, Saudi Arabia)
Recent Developments
- In 2025, CF Industries formed a joint venture with JERA and Mitsui for the construction of a zero-carbon ammonia facility at its Blue Point Complex in Louisiana worth US$ 4 Bn. The plant will utilize autothermal reforming (ATR) plus CO₂ dehydration and compression to capture about 2.3 million metric tons of CO₂ a year, with an annual capture capacity provided through Occidental’s 1PointFive unit. The plant is expected to be commissioned in 2029, and has a nameplate capacity of about 1.4 million metric tons, which would make it the largest facility of its kind in the world. CF Industries holds a 40% share of the venture; JERA has 35% and Mitsui 25% ownership.
- In 2025, BASF committed to making renewable ammonia in Central Europe, and was the first renewable ammonia producer recording two certified grades ‘renewable ammonia’ and ‘renewable ammonia solution 24.5%’. The renewable ammonia is created at its Ludwigshafen site using hydrogen from renewable sources and is part of a mass-balance system. The products were certified by ISCC+, meaning that it is a drop in product to traditional ammonia, with each having a substantially lower product carbon footprint (PCF). This opportunity fits into BASF’s net-zero CO₂ target by 2050 and shift towards making a sustainable Monomers portfolio.
- In March 2024, Yara partnered with GHC SAOC, a subsidiary of Acme Cleantech. Acme will supply Yara with ammonia produced with reduced CO2 emissions through this partnership. The agreement covers the delivery of 100,000 tons of renewable ammonia per year.
Report Coverage
The research report offers an in-depth analysis based on End- use industry, Application and Geography. It details leading market players, providing an overview of their business, product offerings, investments, revenue streams, and key applications. Additionally, the report includes insights into the competitive environment, SWOT analysis, current market trends, as well as the primary drivers and constraints. Furthermore, it discusses various factors that have driven market expansion in recent years. The report also explores market dynamics, regulatory scenarios, and technological advancements that are shaping the industry. It assesses the impact of external factors and global economic changes on market growth. Lastly, it provides strategic recommendations for new entrants and established companies to navigate the complexities of the market.
Future Outlook
- The ammonia‑water market will witness steady growth as fertilizer demand climbs globally.
- Rising industrial cleaning and refrigeration applications will expand usage beyond agriculture.
- Growth in Asia‑Pacific and Latin American markets will boost regional share and consumption.
- Technological advances in low‑emission ammonia production will create new manufacturing opportunities.
- Increasing sustainability and regulatory pressures will favour ammonia‑water solutions that reduce environmental footprint.
- Expansion into emerging markets will provide growth fronts for producers targeting underserved regions.
- Growth in textile, pharmaceutical and household cleaning sectors will diversify application areas significantly.
- Volatility in raw material and energy costs may challenge production economics and affect pricing structures.
- Safety and handling regulations will continue to raise barriers for smaller manufacturers, affecting competition.
- Consolidation among leading players and increased investment in R&D will intensify competitive dynamics and innovation.


