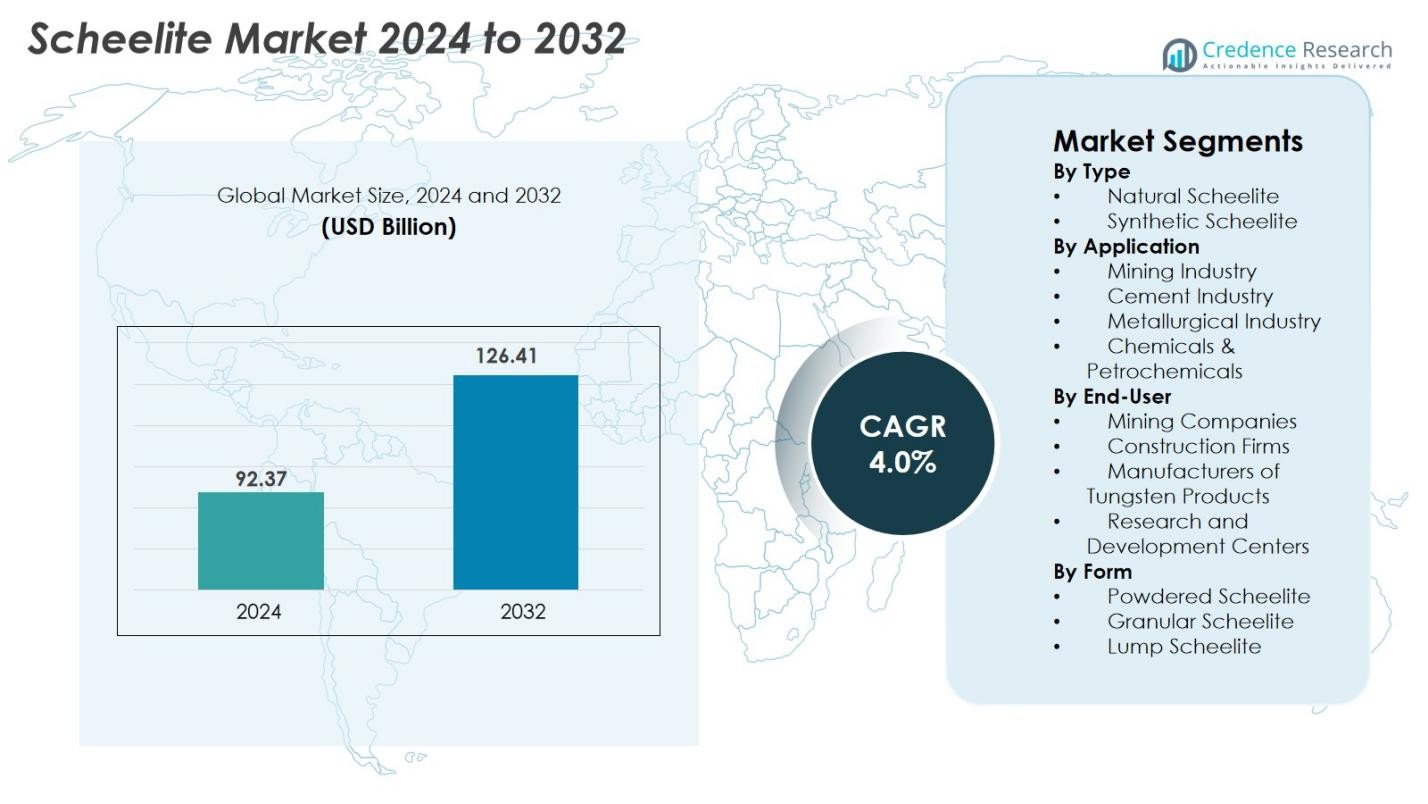
Home » Chemicals » Scheelite Market

Scheelite Market By Purity 98.0%, 99.0%, 99.5%, 99.9% By Application Tungsten Alloy, Tungsten Steel, Tungsten Chemicals, Others By End-Use Mining, Petroleum, Military, Electronics, Others)-Growth, Future Prospects & Competitive Analysis, 2016 – 2030

Price: $4999

Published: | Report ID: 18143 | Report Format : PDF

Key Highlights of the Report

The global scheelite market is segmented by purity, application, end-user, and region. 98.0% scheelites are the most popular based on purity, while tungsten alloy is the primary application segment. Mining is the most commonly used end-use, with Asia Pacific leading the market growth.

The global scheelite market has several drivers, including the increasing use of tungsten in numerous end-use sectors. The worldwide scheelite market is anticipated to expand steadily over the forecast period. Due to its hardness, resistance to wear, high melting point and density, and low vapor pressure, tungsten is one of the most sought-after and distinctive metals. However, the high cost of tungsten manufacturing and its price volatility, which can impact the profitability of scheelite mining operations, are two reasons that may limit the expansion of the scheelite market. The environmental issues connected to the mining and processing of scheelite might also be a barrier to market expansion.

Nonetheless, the global Scheelite market offers significant growth opportunities, including the manufacturing of X-ray tubes and scintillation detectors for use in medicine and science is driving up demand for Scheelite, which is anticipated to drive market expansion. Additionally, the growing investment in the mining industry, notably in nations like China, Russia, Canada, and Australia, which are among the top producers of scheelite, is supporting the expansion of the scheelite market. Adopting sustainable mining techniques and developing cutting-edge technology are also anticipated to open up new market opportunities.

Market Overview

The global scheelite market has witnessed steady growth in recent years and is expected to continue growing at a CAGR of 4.50% between 2023 and 2030. The market was valued at USD 83.9 Billion in 2022 and is expected to reach USD 114.18 Billion in 2030.

Design Element 2

Access crucial information at unmatched prices!

Request your free sample report today & start making informed decisions powered by Credence Research!

Download Free Sample
CTA Design Element 3

What Are the Main Drivers of The Global Scheelite Market?

The global scheelite market is driven by several factors, including the increasing use of tungsten in numerous end-use sectors. The worldwide scheelite market is anticipated to expand steadily over the forecast period. Due to its hardness, resistance to wear, high melting point and density, and low vapor pressure, tungsten is one of the most sought-after and distinctive metals.

What Are the Major Challenges Faced by The Global Scheelite Market?

The global Scheelite market also faces several challenges, including the high cost of tungsten manufacturing and its price volatility, which can impact the profitability of scheelite mining operations. These are two reasons that may limit the expansion of the scheelite market. The environmental issues connected to the mining and processing of scheelite might also be a barrier to market expansion.

What are the Growth Opportunities in the Global Scheelite Market?

The global Scheelite market offers significant growth opportunities, including the manufacturing of X-ray tubes and scintillation detectors for use in medicine and science is driving up demand for scheelite, which is anticipated to drive market expansion. Additionally, the growing investment in the mining industry, notably in nations like China, Russia, Canada, and Australia, which are among the top producers of scheelite, is supporting the expansion of the scheelite market. Adopting sustainable mining techniques and developing cutting-edge technology are also anticipated to open up new market opportunities.

Executive Summary

Overview of the Global Scheelite Market

Due to the increasing use of tungsten in numerous end-use sectors, the worldwide scheelite market is anticipated to expand steadily over the forecast period. Due to its hardness, resistance to wear, high melting point and density, and low vapor pressure, tungsten is one of the most sought-after and distinctive metals.

Market Definition

Calcium tungstate is the mineral scheelite. The primary ore of tungsten is a rare and expensive material. Scheelite can be found in various colors, including bright orange, golden yellow, yellow-brown, brownish green, dark brown, pinkish to reddish grey, orange, pale grey, white, and colorless. The main application of scheelite is as an ore of tungsten, a thick, hard, corrosion-resistant metal with a high melting point. Steel manufacture, electrical and electronic equipment, and aircraft are just a few industrial and technological uses for tungsten.

Scheelite Market

Market Insights

  • The global demand for scheelites was valued at USD 83.9 Billion in 2022 and is expected to reach USD 114.18 Billion in 2030, growing at a CAGR of 4.50% between 2023 and 2030.
  • 98.0% is the leading segment by purity, held over 43% share in value in 2022, and is expected to exhibit the fastest CAGR during the forecast period.
  • The tungsten alloy segment governs the demand for scheelites globally, holding a massive share of over 35% in 2020, and is expected to grow at a rapid CAGR.
  • The mining segment is expected to post the highest CAGR during the forecast period.
  • Asia Pacific is fueling the growth of the scheelite industry with over 43% share in 2022, while North America and Europe collectively account for just under 50% share in 2022. Europe held over 22% share in 2022.
  • The rapid industrialization and economic development of nations like China and India are driving market statistics in the region. These nations are positioned to drive most of the industry’s growth in Asia.
  • Due to its prominence as the world’s top producer, consumer, and exporter of tungsten, China is a significant market for scheelite. The growing demand and the absence of tungsten mines will probably impact the nation’s scheelite output and processing.

Segmentation by Purity

  • 98.0% is the leading segment by purity, held over 43% share in value in 2022,
  • The 99.5% segment is expected to exhibit the fastest CAGR during the forecast period.

Segmentation by Application

  • The tungsten alloy segment governs the demand for scheelites globally, holding a massive share of over 40% in 2022, and is also expected to grow at a rapid CAGR.
  • The tungsten steel segment contributes to the rest of the demand for scheelites.

Segmentation by End-Use

  • The mining segment is expected to post the highest CAGR during the forecast period.
  • The military segment is leading the market share with over 30% share in 2022.

Segmentation by Region

  • With a market share of more than 43% in 2022, Asia Pacific is the industry’s main driver of expansion.
  • In 2022, North America and Europe will account for just less than 50% of the market, with Europe owning over 22% of the market.
  • The remaining portion of the market for Scheelites comes from the rest of the world, which includes Latin America, the Middle East, and Africa.

The United States is one of the largest markets for scheelites in North America, with a significant market share. The North American market is anticipated to be driven by the U.S. and Canada’s economies. According to World Mining Data, the United States was one of the largest mining countries, contributing about 11.5% of all mining activity worldwide. Additionally, according to Select USA, the aerospace industry in the United States is one of the most competitive in the world and generated about USD 151 billion in revenue in 2018. The U.S. Geological Survey estimates that mines in the United States produced mineral commodities worth about $90.4 billion in 2021, an increase of $9.7 billion above the revised total of $80.7 billion in 2020.

China is also a major market for Scheelites in the Asia Pacific region, with a significant market share. Due to its position as the world’s largest producer, buyer, and exporter of tungsten, China represents a sizable market for scheelite. The rising tungsten demand and the scarcity of tungsten mines will undoubtedly impact the nation’s production and processing of scheelite.

The global scheelite market has several drivers, including the increasing use of tungsten in numerous end-use sectors. The worldwide scheelite market is anticipated to expand steadily over the forecast period. Due to its hardness, resistance to wear, high melting point and density, and low vapor pressure, tungsten is one of the most sought-after and distinctive metals.

However, the high cost of tungsten manufacturing and its price volatility, which can impact the profitability of scheelite mining operations, are two reasons that may limit the expansion of the scheelite market.

Rising Demand for Scheelite in the Mining Industry

Due to its longer tool life, lower cost, and higher productivity, tungsten carbide is replacing steel in the mining industry. Tungsten is mostly employed in bulk handling, mineral processing, longwall extraction, roof bolting, room & pillar extraction, and blast hole drilling. One of the most reliable and economical chemical materials that may be employed in production is tungsten carbide. The material is found in powder form and then molded through sintering. It is made up of equal parts, tungsten and carbon. Tungsten carbide, which has a high tolerance for heat and pressure and has long been employed in machinery with essential functions, is gradually making its way into the mining industry.

Instead of just employing a metallic body, tungsten carbides are used as attachments at the tip to lessen wear on the machine’s metallic body. The replacement of a tip is simpler than that of a down-the-hole drilling unit. Tungsten carbides are used in the mining industry as huge attachments or little button inserts.

Rising Application in Various End-use Industries

Due to its low evaporation rate, high plasticity, high melting point, and high electron emission ability, tungsten is extensively employed in the power and electronics industries. For instance, due to its high light rate and long service life, tungsten is frequently utilized in producing several bulb filaments, including those for incandescent lamps and halogen lamps. In addition, tungsten wire can produce electronic tubes with a direct hot cathode, a gate, and several electronic instruments. Due to its characteristics, tungsten is appropriate for TIG welding and the joining of other materials.

Shortage of Material

Obtaining raw materials like tungsten, which is required for power-management circuits and other microchips, is challenging for manufacturers. These problems directly affect how many final consumer electronics devices are available. The demand for tungsten has recently increased due to China’s decision to limit exports and purchase as much as possible. Industries that rely on it seem to have few options because of the shortage of tungsten readily available on the international market. As a result, the tungsten market may be slowed.

Huge Application of Tungsten

The hardest metal by far, tungsten has the greatest melting point of any substance known to man. Its hardness is also among the highest, and tungsten carbide’s hardness is nearly equal to a diamond’s. Additionally, tungsten, frequently used in alloys, electronics, and the chemical sector, has strong electrical and thermal conductivity and a low coefficient. Because tungsten is nearly as hard as gold, it can increase the steel’s hardness, strength, and wear resistance. It is a crucial alloying component that is widely employed in the production of all kinds of steel.

High-speed steel and tungsten cobalt magnetic steel are two types of common tungsten steel used in producing tools such as drills, milling cutters, wire drawing dies, die and molds, etc. The manufacture of petrol uses wrought compounds as lubricants and inorganic colors, such as tungsten sulfide, which also serves as a catalyst. Both calcium or magnesium tungsten and tin oxide are utilized in luminous powder. Because of its similar thermal expansion to borosilicate glass, it is utilized to manufacture metal seals and glass. High-purity tungsten jewelry is made from tungsten because of its low sensitivity. Furthermore, some devices employ tungsten, which was used in radioactive medicine.

Competitive Landscape

Key Players

The global Scheelite market is highly competitive, with several key players. Some of the major players in the market and their market share are as follows:

  • American Elements
  • Sanher Tungsten Vietnam Co., Ltd.
  • Maruti Enterprise
  • Arth Metallurgicals Pvt.Ltd
  • United Wolfram
  • Anchor Chemicals Industries
  • Sun Industries
  • Others

These companies focus on product innovation, expanding their distribution channels, and mergers and acquisitions to stay ahead in the market. The major players in the global Scheelite market constantly strive to stay ahead by introducing new products and innovations.

In June 2021, BMW Group announced plans to collect used drill and milling bits at its facilities in Germany and Austria for recycling. It established a closed-loop material cycle for tungsten. The new milling and drilling tools would be made using the secondary tungsten created in this manner.

Shape Your Report to Specific Countries or Regions & Enjoy 30% Off!

Summary of Key Findings

  • Growing demand for Scheelites in the mining industry driving market growth
  • Market segmented by purity, application, end-user, and region.
  • 98.0% purity scheelites are the most popular
  • Tungsten alloy is the primary user segment.
  • Mining is the most commonly used end user, with Asia Pacific leading the market growth.

Future Outlook

  • Positive outlook for the global Scheelite market with significant growth potential in the Asia Pacific region
  • The rapid industrialization and economic development of nations like China and India are driving market statistics in the region. These nations are positioned to drive most of the industry’s growth in Asia.
  • Due to its prominence as the world’s top producer, consumer, and exporter of tungsten, China is a significant market for scheelite.

Segmentation

  • By Purity
    • 98.0%
    • 99.0%
    • 99.5%
    • 99.9%
  • By Application
    • Tungsten Alloy
    • Tungsten Steel
    • Tungsten Chemicals
    • Others
  • By End-Use
    • Mining
    • Petroleum
    • Military
    • Electronics
    • Others
  • By Region
  • North America
    • The US.
    • Canada
    • Mexico
  • Europe
    • Germany
    • France
    • The U.K.
    • Italy
    • Spain
    • Rest of Europe
  • Asia Pacific
    • China
    • Japan
    • India
    • South Korea
    • South-east Asia
    • Rest of Asia Pacific
  • Latin America
    • Brazil
    • Argentina
    • Rest of Latin America
  • Middle East & Africa
    • GCC Countries
    • South Africa
    • Rest of the Middle East and Africa

1. Preface
1.1. Report Description
1.1.1. Purpose of the Report
1.1.2. Target Audience
1.1.3. USP and Key Offerings
1.2. Research Scope
1.3. Research Methodology
1.3.1. Phase I – Secondary Research
1.3.2. Phase II – Data Modelling
1.3.2.1. Company Share Analysis Model
1.3.2.2. Revenue Based Modelling
1.3.3. Phase III – Primary Research
1.3.4. Research Limitations
1.3.5. Assumptions
1.4. Market Introduction
1.5. Market Research Scope

2. Executive Summary
2.1. Market Snapshot: Global Scheelite Market
2.2. Global Scheelite Market, By Purity
2.3. Global Scheelite Market, By Application
2.4. Global Scheelite Market, By End-Use
2.5. Global Scheelite Market, By Region

3. Market Dynamics & Factors Analysis
3.1. Introduction
3.1.1. Global Scheelite Market Value, 2017-2030, (US$ Bn)
3.1.2. Y-o-Y Growth Trend Analysis
3.2. Market Dynamics
3.2.1. Market Drivers
3.2.1.1. Driver 1
3.2.1.2. Driver 2
3.2.1.3. Driver 3
3.2.2. Market Restraints
3.2.2.1. Restraint 1
3.2.2.2. Restraint 2
3.2.3. Market Opportunities
3.2.3.1. Opportunity 1
3.2.3.2. Opportunity 2
3.2.4. Major Industry Challenges
3.2.4.1. Challenge 1
3.2.4.2. Challenge 2
3.3. Growth and Development Patterns
3.4. Investment Feasibility Analysis
3.5. Market Opportunity Analysis
3.5.1. By Purity
3.5.2. Application
3.5.3. End-Use
3.5.4. Geography

4. Premium Insights
4.1. STAR (Situation, Task, Action, Results) Analysis
4.2. Porter’s Five Forces Analysis
4.2.1. Threat of New Entrants
4.2.2. Bargaining Power of Buyers/Consumers
4.2.3. Bargaining Power of Suppliers
4.2.4. Threat of Substitute Types
4.2.5. Intensity of Competitive Rivalry
4.3. Key Market Trends
4.3.1. Demand Side Trends
4.3.2. Supply Side Trends
4.4. Value Chain Analysis
4.5. By Purity Analysis
4.6. Analysis and Recommendations
4.7. Marketing Strategy Analysis
4.7.1. Direct Marketing
4.7.2. Indirect Marketing
4.7.3. Marketing Channel Development Trend

5. Market Positioning of Key Players, 2022
5.1. Company market share of key players, 2022
5.2. Competitive Benchmarking
5.3. Market Positioning of Key Vendors
5.4. Geographical Presence Analysis
5.5. Major Strategies Adopted by Key Players
5.5.1. Key Strategies Analysis
5.5.2. Mergers and Acquisitions
5.5.3. Partnerships
5.5.4. Product Launch
5.5.5. Geographical Expansion
5.5.6. Others

6. Economic Impact Analysis
6.1. Recession Impact
6.1.1. North America
6.1.2. Europe
6.1.3. Asia Pacific
6.1.4. Latin America
6.1.5. Middle East and Africa
6.2. Ukraine-Russia War Impact
6.2.1. North America
6.2.2. Europe
6.2.3. Asia Pacific
6.2.4. Latin America
6.2.5. Middle East and Africa
6.3. COVID-19 Impact Analysis
6.3.1. North America
6.3.2. Europe
6.3.3. Asia Pacific
6.3.4. Latin America
6.3.5. Middle East and Africa

7. Global Scheelite Market, By Purity
7.1. Global Scheelite Market Overview, By Purity
7.1.1. Global Scheelite Market Revenue Share, By Purity, 2022 Vs 2030 (in %)
7.2. 98.0%
7.2.1. Global Scheelite Market, By Region, 2017-2030 (US$ Bn)
7.3. 99.0%
7.3.1. Global Scheelite Market, By Region, 2017-2030 (US$ Bn)
7.4. 99.5%
7.4.1. Global Scheelite Market, By Region, 2017-2030 (US$ Bn)
7.5. 99.9%
7.5.1. Global Scheelite Market, By Region, 2017-2030 (US$ Bn)

8. Global Scheelite Market, By Application
8.1. Global Scheelite Market Overview, by Application
8.1.1. Global Scheelite Market, By Application, 2022 vs 2030 (in %)
8.2. Tungsten Alloy
8.2.1. Global Scheelite Market, By Region, 2017-2030 (US$ Bn)
8.3. Tungsten Steel
8.3.1. Global Scheelite Market, By Region, 2017-2030 (US$ Bn)
8.4. Tungsten Chemicals
8.4.1. Global Scheelite Market, By Region, 2017-2030 (US$ Bn)
8.5. Others
8.5.1. Global Scheelite Market, By Region, 2017-2030 (US$ Bn)

9. Global Scheelite Market, by End-Use, 2017-2030 (US$ Bn)
9.1. Global Scheelite Market Overview, by End-Use
9.1.1. Global Scheelite Market, By End-Use, 2022 vs 2030 (in%)
9.2. Mining
9.2.1. Global Scheelite Market, By Region, 2017-2030 (US$ Bn)
9.3. Petroleum
9.3.1. Global Scheelite Market, By Region, 2017-2030 (US$ Bn)
9.4. Military
9.4.1. Global Scheelite Market, By Region, 2017-2030 (US$ Bn)
9.5. Electronics
9.5.1. Global Scheelite Market, By Region, 2017-2030 (US$ Bn)
9.6. Others
9.6.1. Global Scheelite Market, By Region, 2017-2030 (US$ Bn)

10. Global Scheelite Market, By Region
10.1. Global Scheelite Market Overview, by Region
10.1.1. Global Scheelite Market, By Region, 2022 vs 2030 (in%)
10.2. By Purity
10.2.1. Global Scheelite Market, By Purity, 2017-2030 (US$ Bn)
10.3. Application
10.3.1. Global Scheelite Market, By Application, 2017-2030 (US$ Bn)
10.4. End-Use
10.4.1. Global Scheelite Market, By End-Use, 2017-2030 (US$ Bn)

11. North America Scheelite Market Analysis
11.1. North America Scheelite Market, by Purity, 2017-2030(US$ Bn)
11.1.1. Overview
11.1.2. SRC Analysis
11.2. North America Scheelite Market, by Application, 2017-2030(US$ Bn)
11.2.1. Overview
11.2.2. SRC Analysis
11.3. North America Scheelite Market, by End-Use, 2017-2030(US$ Bn)
11.3.1. Overview
11.3.2. SRC Analysis
11.4. North America Scheelite Market, by Country, 2017-2030 (US$ Bn)
11.4.1. North America Scheelite Market, by Country, 2022 Vs 2030 (in%)
11.4.2. U.S.
11.4.2.1. U.S. Scheelite Market Estimates and Forecast, 2017-2030 (US$ Bn)
11.4.2.2. U.S. Scheelite, By Purity, 2017-2030 (US$ Bn)
11.4.2.3. U.S. Scheelite, By Application, 2017-2030 (US$ Bn)
11.4.2.4. U.S. Scheelite, By End-Use, 2017-2030 (US$ Bn)
11.4.3. Canada
11.4.3.1. Canada Scheelite Market Estimates and Forecast, 2017-2030 (US$ Bn)
11.4.3.2. Canada Scheelite, By Purity, 2017-2030 (US$ Bn)
11.4.3.3. Canada Scheelite, By Application, 2017-2030 (US$ Bn)
11.4.3.4. Canada Scheelite, By End-Use, 2017-2030 (US$ Bn)
11.4.4. Mexico
11.4.4.1. Mexico Scheelite Market Estimates and Forecast, 2017-2030 (US$ Bn)
11.4.4.2. Mexico Scheelite, By Purity, 2017-2030 (US$ Bn)
11.4.4.3. Mexico Scheelite, By Application, 2017-2030 (US$ Bn)
11.4.4.4. Mexico Scheelite, By End-Use, 2017-2030 (US$ Bn)

12. Europe Scheelite Market Analysis
12.1. Europe Scheelite Market, By Purity, 2017-2030(US$ Bn)
12.1.1. Overview
12.1.2. SRC Analysis
12.2. Europe Scheelite Market, by Application, 2017-2030(US$ Bn)
12.2.1. Overview
12.2.2. SRC Analysis
12.3. Europe Scheelite Market, By End-Use, 2017-2030(US$ Bn)
12.3.1. Overview
12.3.2. SRC Analysis
12.4. Europe Scheelite Market, by Country, 2017-2030 (US$ Bn)
12.4.1. Europe Scheelite Market, by Country, 2022 Vs 2030 (in%)
12.4.2. Germany
12.4.2.1. Germany Scheelite Market Estimates and Forecast, 2017-2030 (US$ Bn)
12.4.2.2. Germany Scheelite, By Purity, 2017-2030 (US$ Bn)
12.4.2.3. Germany Scheelite, By Application, 2017-2030 (US$ Bn)
12.4.2.4. Germany Scheelite, By End-Use, 2017-2030 (US$ Bn)
12.4.3. France
12.4.3.1. France Scheelite Market Estimates and Forecast, 2017-2030 (US$ Bn)
12.4.3.2. France Scheelite, By Purity, 2017-2030 (US$ Bn)
12.4.3.3. France Scheelite, By Application, 2017-2030 (US$ Bn)
12.4.3.4. France Scheelite, By End-Use, 2017-2030 (US$ Bn)
12.4.4. UK
12.4.4.1. UK Scheelite Market Estimates and Forecast, 2017-2030 (US$ Bn)
12.4.4.2. UK Scheelite, By Purity, 2017-2030 (US$ Bn)
12.4.4.3. UK Scheelite, By Application, 2017-2030 (US$ Bn)
12.4.4.4. UK Scheelite, By End-Use, 2017-2030 (US$ Bn)
12.4.5. Italy
12.4.5.1. Italy Scheelite Market Estimates and Forecast, 2017-2030 (US$ Bn)
12.4.5.2. Italy Scheelite, By Purity, 2017-2030 (US$ Bn)
12.4.5.3. Italy Scheelite, By Application, 2017-2030 (US$ Bn)
12.4.5.4. Italy Scheelite, By End-Use, 2017-2030 (US$ Bn)
12.4.6. Spain
12.4.6.1. Spain Scheelite Market Estimates and Forecast, 2017-2030 (US$ Bn)
12.4.6.2. Spain Scheelite, By Purity, 2017-2030 (US$ Bn)
12.4.6.3. Spain Scheelite, By Application, 2017-2030 (US$ Bn)
12.4.6.4. Spain Scheelite, By End-Use, 2017-2030 (US$ Bn)
12.4.7. Rest of Europe
12.4.7.1. Rest of Europe Scheelite Market Estimates and Forecast, 2017-2030 (US$ Bn)
12.4.7.2. Rest of Europe Scheelite, By Purity, 2017-2030 (US$ Bn)
12.4.7.3. Rest of Europe Scheelite, By Application, 2017-2030 (US$ Bn)
12.4.7.4. Rest of Europe Scheelite, By End-Use, 2017-2030 (US$ Bn)

13. Asia Pacific Scheelite Market Analysis
13.1. Asia Pacific Scheelite Market, By Purity, 2017-2030(US$ Bn)
13.1.1. Overview
13.1.2. SRC Analysis
13.2. Asia Pacific Scheelite Market, by Application, 2017-2030(US$ Bn)
13.2.1. Overview
13.2.2. SRC Analysis
13.3. Asia Pacific Scheelite Market, By End-Use, 2017-2030(US$ Bn)
13.3.1. Overview
13.3.2. SRC Analysis
13.4. Asia Pacific Scheelite Market, by Country, 2017-2030 (US$ Bn)
13.4.1. Asia Pacific Scheelite Market, by Country, 2022 Vs 2030 (in%)
13.4.2. China
13.4.2.1. China Scheelite Market Estimates and Forecast, 2017-2030 (US$ Bn)
13.4.2.2. China Scheelite, By Purity, 2017-2030 (US$ Bn)
13.4.2.3. China Scheelite, By Application, 2017-2030 (US$ Bn)
13.4.2.4. China Scheelite, By End-Use, 2017-2030 (US$ Bn)
13.4.3. Japan
13.4.3.1. Japan Scheelite Market Estimates and Forecast, 2017-2030 (US$ Bn)
13.4.3.2. Japan Scheelite, By Purity, 2017-2030 (US$ Bn)
13.4.3.3. Japan Scheelite, By Application, 2017-2030 (US$ Bn)
13.4.3.4. Japan Scheelite, By End-Use, 2017-2030 (US$ Bn)
13.4.4. India
13.4.4.1. India Scheelite Market Estimates and Forecast, 2017-2030 (US$ Bn)
13.4.4.2. India Scheelite, By Purity, 2017-2030 (US$ Bn)
13.4.4.3. India Scheelite, By Application, 2017-2030 (US$ Bn)
13.4.4.4. India Scheelite, By End-Use, 2017-2030 (US$ Bn)
13.4.5. South Korea
13.4.5.1. South Korea Scheelite Market Estimates and Forecast, 2017-2030 (US$ Bn)
13.4.5.2. South Korea Scheelite, By Purity, 2017-2030 (US$ Bn)
13.4.5.3. South Korea Scheelite, By Application, 2017-2030 (US$ Bn)
13.4.5.4. South Korea Scheelite, By End-Use, 2017-2030 (US$ Bn)
13.4.6. South-East Asia
13.4.6.1. South-East Asia Scheelite Market Estimates and Forecast, 2017-2030 (US$ Bn)
13.4.6.2. South-East Asia Scheelite, By Purity, 2017-2030 (US$ Bn)
13.4.6.3. South-East Asia Scheelite, By Application, 2017-2030 (US$ Bn)
13.4.6.4. South-East Asia Scheelite, By End-Use, 2017-2030 (US$ Bn)
13.4.7. Rest of Asia Pacific
13.4.7.1. Rest of Asia Pacific Scheelite Market Estimates and Forecast, 2017-2030 (US$ Bn)
13.4.7.2. Rest of Asia Pacific Scheelite, By Purity, 2017-2030 (US$ Bn)
13.4.7.3. Rest of Asia Pacific Scheelite, By Application, 2017-2030 (US$ Bn)
13.4.7.4. Rest of Asia Pacific Scheelite, By End-Use, 2017-2030 (US$ Bn)

14. Latin America Scheelite Market Analysis
14.1. Latin America Scheelite Market, By Purity, 2017-2030(US$ Bn)
14.1.1. Overview
14.1.2. SRC Analysis
14.2. Latin America Scheelite Market, by Application, 2017-2030(US$ Bn)
14.2.1. Overview
14.2.2. SRC Analysis
14.3. Latin America Scheelite Market, By End-Use, 2017-2030(US$ Bn)
14.3.1. Overview
14.3.2. SRC Analysis
14.4. Latin America Scheelite Market, by Country, 2017-2030 (US$ Bn)
14.4.1. Latin America Scheelite Market, by Country, 2022 Vs 2030 (in%)
14.4.2. Brazil
14.4.2.1. Brazil Scheelite Market Estimates and Forecast, 2017-2030 (US$ Bn)
14.4.2.2. Brazil Scheelite, By Purity, 2017-2030 (US$ Bn)
14.4.2.3. Brazil Scheelite, By Application, 2017-2030 (US$ Bn)
14.4.2.4. Brazil Scheelite, By End-Use, 2017-2030 (US$ Bn)
14.4.3. Argentina
14.4.3.1. Argentina Scheelite Market Estimates and Forecast, 2017-2030 (US$ Bn)
14.4.3.2. Argentina Scheelite, By Purity, 2017-2030 (US$ Bn)
14.4.3.3. Argentina Scheelite, By Application, 2017-2030 (US$ Bn)
14.4.3.4. Argentina Scheelite, By End-Use, 2017-2030 (US$ Bn)
14.4.4. Rest of Latin America
14.4.4.1. Rest of Latin America Scheelite Market Estimates and Forecast, 2017-2030 (US$ Bn)
14.4.4.2. Rest of Latin America Scheelite, By Purity, 2017-2030 (US$ Bn)
14.4.4.3. Rest of Latin America Scheelite, By Application, 2017-2030 (US$ Bn)
14.4.4.4. Rest of Latin America Scheelite, By End-Use, 2017-2030 (US$ Bn)

15. Middle East and Africa Scheelite Market Analysis
15.1. Middle East and Africa Scheelite Market, By Purity, 2017-2030(US$ Bn)
15.1.1. Overview
15.1.2. SRC Analysis
15.2. Middle East and Africa Scheelite Market, by Application, 2017-2030(US$ Bn)
15.2.1. Overview
15.2.2. SRC Analysis
15.3. Middle East and Africa Scheelite Market, By End-Use, 2017-2030(US$ Bn)
15.3.1. Overview
15.3.2. SRC Analysis
15.4. Middle East and Africa Scheelite Market, by Country, 2017-2030 (US$ Bn)
15.4.1. Middle East and Africa Scheelite Market, by Country, 2022 Vs 2030 (in%)
15.4.2. GCC Countries
15.4.2.1. GCC Countries Scheelite Market Estimates and Forecast, 2017-2030 (US$ Bn)
15.4.2.2. GCC Countries Scheelite, By Purity, 2017-2030 (US$ Bn)
15.4.2.3. GCC Countries Scheelite, By Application, 2017-2030 (US$ Bn)
15.4.2.4. GCC Countries Scheelite, By End-Use, 2017-2030 (US$ Bn)
15.4.3. South Africa
15.4.3.1. South Africa Scheelite Market Estimates and Forecast, 2017-2030 (US$ Bn)
15.4.3.2. South Africa Scheelite, By Purity, 2017-2030 (US$ Bn)
15.4.3.3. South Africa Scheelite, By Application, 2017-2030 (US$ Bn)
15.4.3.4. South Africa Scheelite, By End-Use, 2017-2030 (US$ Bn)
15.4.4. Rest of Middle East and Africa
15.4.4.1. Rest of Middle East and Africa Scheelite Market Estimates and Forecast, 2017-2030 (US$ Bn)
15.4.4.2. Rest of Middle East and Africa Scheelite, By Purity, 2017-2030 (US$ Bn)
15.4.4.3. Rest of Middle East and Africa Scheelite, By Application, 2017-2030 (US$ Bn)
15.4.4.4. Rest of Middle East and Africa Scheelite, By End-Use, 2017-2030 (US$ Bn)

16. Company Profiles
16.1. American Elements
16.1.1. Company Overview
16.1.2. Products/Services Portfolio
16.1.3. Geographical Presence
16.1.4. Financial Summary
16.1.4.1. Market Revenue and Net Profit (2019-2022)
16.1.4.2. Business Segment Revenue Analysis
16.1.4.3. Geographical Revenue Analysis
16.2. Sanher Tungsten Vietnam Co.,Ltd.
16.3. Maruti Enterprise
16.4. Arth Metallurgicals Pvt.Ltd
16.5. United Wolfram
16.6. Anchor Chemicals Industries
16.7. Sun Industries

List of Figures
FIG. 1 Global Scheelite Market: Research Methodology
FIG. 2 Market Size Estimation – Top Down & Bottom up Approach
FIG. 3 Global Scheelite Market Segmentation
FIG. 4 Global Scheelite Market, By Purity, 2022 (US$ Bn)
FIG. 5 Global Scheelite Market, by Application, 2022 (US$ Bn)
FIG. 6 Global Scheelite Market, By End-Use, 2022 (US$ Bn)
FIG. 7 Global Scheelite Market, by Geography, 2022 (US$ Bn)
FIG. 8 Attractive Investment Proposition, By Purity, 2022
FIG. 9 Attractive Investment Proposition, by Application, 2022
FIG. 10 Attractive Investment Proposition, By End-Use, 2022
FIG. 11 Attractive Investment Proposition, by Geography, 2022
FIG. 12 Global Market Share Analysis of Key Scheelite Market Manufacturers, 2022
FIG. 13 Global Market Positioning of Key Scheelite Market Manufacturers, 2022
FIG. 14 Global Scheelite Market Value Contribution, By Purity, 2022 & 2030 (Value %)
FIG. 15 Global Scheelite Market, by 98.0%, Value, 2017-2030 (US$ Bn)
FIG. 16 Global Scheelite Market, by 99.0%, Value, 2017-2030 (US$ Bn)
FIG. 17 Global Scheelite Market, by 99.5%, Value, 2017-2030 (US$ Bn)
FIG. 18 Global Scheelite Market, by 99.9%, Value, 2017-2030 (US$ Bn)
FIG. 19 Global Scheelite Market Value Contribution, By Application, 2022 & 2030 (Value %)
FIG. 20 Global Scheelite Market, by Tungsten Alloy, Value, 2017-2030 (US$ Bn)
FIG. 21 Global Scheelite Market, by Tungsten Steel, 2017-2030 (US$ Bn)
FIG. 22 Global Scheelite Market, by Tungsten Chemicals, 2017-2030 (US$ Bn)
FIG. 23 Global Scheelite Market, by Others, 2017-2030 (US$ Bn)
FIG. 24 Global Scheelite Market Value Contribution, By End-Use, 2022 & 2030 (Value %)
FIG. 25 Global Scheelite Market, by Mining, Value, 2017-2030 (US$ Bn)
FIG. 26 Global Scheelite Market, by Petroleum, 2017-2030 (US$ Bn)
FIG. 27 Global Scheelite Market, by Military, 2017-2030 (US$ Bn)
FIG. 28 Global Scheelite Market, by Electronics, 2017-2030 (US$ Bn)
FIG. 29 Global Scheelite Market, by Others, 2017-2030 (US$ Bn)
FIG. 30 North America Scheelite Market, 2017-2030 (US$ Bn)
FIG. 31 U.S. Scheelite Market, 2017-2030 (US$ Bn)
FIG. 32 Canada Scheelite Market, 2017-2030 (US$ Bn)
FIG. 33 Europe Scheelite Market, 2017-2030 (US$ Bn)
FIG. 34 Germany Scheelite Market, 2017-2030 (US$ Bn)
FIG. 35 France Scheelite Market, 2017-2030 (US$ Bn)
FIG. 36 U.K. Scheelite Market, 2017-2030 (US$ Bn)
FIG. 37 Italy Scheelite Market, 2017-2030 (US$ Bn)
FIG. 38 Spain Scheelite Market, 2017-2030 (US$ Bn)
FIG. 39 Rest of Europe Scheelite Market, 2017-2030 (US$ Bn)
FIG. 40 Asia Pacific Scheelite Market, 2017-2030 (US$ Bn)
FIG. 41 China Scheelite Market, 2017-2030 (US$ Bn)
FIG. 42 Japan Scheelite Market, 2017-2030 (US$ Bn)
FIG. 43 India Scheelite Market, 2017-2030 (US$ Bn)
FIG. 44 South Korea Scheelite Market, 2017-2030 (US$ Bn)
FIG. 45 South-East Asia Scheelite Market, 2017-2030 (US$ Bn)
FIG. 46 Rest of Asia Pacific Scheelite Market, 2017-2030 (US$ Bn)
FIG. 47 Latin America Scheelite Market, 2017-2030 (US$ Bn)
FIG. 48 Brazil Scheelite Market, 2017-2030 (US$ Bn)
FIG. 49 Mexico Scheelite Market, 2017-2030 (US$ Bn)
FIG. 50 Rest of Latin America Scheelite Market, 2017-2030 (US$ Bn)
FIG. 51 Middle East & Africa Scheelite Market, 2017-2030 (US$ Bn)
FIG. 52 GCC Countries Scheelite Market, 2017-2030 (US$ Bn)
FIG. 53 South Africa Scheelite Market, 2017-2030 (US$ Bn)
FIG. 54 Rest of Middle East and Africa Scheelite Market, 2017-2030 (US$ Bn)

List of Tables
TABLE 1 Market Snapshot: Global Scheelite Market
TABLE 2 Global Scheelite Market: Market Drivers Impact Analysis
TABLE 3 Global Scheelite Market: Market Restraints Impact Analysis
TABLE 4 Global Scheelite Market, by Competitive Benchmarking, 2022
TABLE 5 Global Scheelite Market, by Geographical Presence Analysis, 2022
TABLE 6 Global Scheelite Market, by Key Strategies Analysis, 2022
TABLE 7 Global Scheelite Market, by 98.0%, By Region, 2017-2022 (US$ Bn)
TABLE 8 Global Scheelite Market, by 98.0%, By Region, 2023-2030 (US$ Bn)
TABLE 9 Global Scheelite Market, by 99.0%, By Region, 2017-2022 (US$ Bn)
TABLE 10 Global Scheelite Market, by 99.0%, By Region, 2023-2030 (US$ Bn)
TABLE 11 Global Scheelite Market, by 99.5%, By Region, 2017-2022 (US$ Bn)
TABLE 12 Global Scheelite Market, by 99.5%, By Region, 2023-2030 (US$ Bn)
TABLE 13 Global Scheelite Market, by 99.9%, By Region, 2017-2022 (US$ Bn)
TABLE 14 Global Scheelite Market, by 99.9%, By Region, 2023-2030 (US$ Bn)
TABLE 15 Global Scheelite Market, by Tungsten Alloy, By Region, 2017-2022 (US$ Bn)
TABLE 16 Global Scheelite Market, by Tungsten Alloy, By Region, 2023-2030 (US$ Bn)
TABLE 17 Global Scheelite Market, by Tungsten Steel, By Region, 2017-2022 (US$ Bn)
TABLE 18 Global Scheelite Market, by Tungsten Steel, By Region, 2023-2030 (US$ Bn)
TABLE 19 Global Scheelite Market, by Tungsten Chemicals, By Region, 2017-2022 (US$ Bn)
TABLE 20 Global Scheelite Market, by Tungsten Chemicals, By Region, 2023-2030 (US$ Bn)
TABLE 21 Global Scheelite Market, by Others, By Region, 2017-2022 (US$ Bn)
TABLE 22 Global Scheelite Market, by Others, By Region, 2023-2030 (US$ Bn)
TABLE 23 Global Scheelite Market, by Mining, By Region, 2017-2022 (US$ Bn)
TABLE 24 Global Scheelite Market, by Mining, By Region, 2023-2030 (US$ Bn)
TABLE 25 Global Scheelite Market, by Petroleums, By Region, 2017-2022 (US$ Bn)
TABLE 26 Global Scheelite Market, by Petroleums, By Region, 2023-2030 (US$ Bn)
TABLE 27 Global Scheelite Market, by Military, By Region, 2017-2022 (US$ Bn)
TABLE 28 Global Scheelite Market, by Military, By Region, 2023-2030 (US$ Bn)
TABLE 29 Global Scheelite Market, by Electronics, By Region, 2017-2022 (US$ Bn)
TABLE 30 Global Scheelite Market, by Electronics, By Region, 2023-2030 (US$ Bn)
TABLE 31 Global Scheelite Market, by Others, By Region, 2017-2022 (US$ Bn)
TABLE 32 Global Scheelite Market, by Others, By Region, 2023-2030 (US$ Bn)
TABLE 33 Global Scheelite Market, By Purity, 2017-2022 (US$ Bn)
TABLE 34 Global Scheelite Market, By Purity, 2023-2030 (US$ Bn)
TABLE 35 Global Scheelite Market, by Application, 2017-2022 (US$ Bn)
TABLE 36 Global Scheelite Market, by Application, 2023-2030 (US$ Bn)
TABLE 37 Global Scheelite Market, By End-Use, 2017-2022 (US$ Bn)
TABLE 38 Global Scheelite Market, By End-Use, 2023-2030 (US$ Bn)
TABLE 39 Global Scheelite Market, by Region, 2017-2022 (US$ Bn)
TABLE 40 Global Scheelite Market, by Region, 2023-2030 (US$ Bn)
TABLE 41 North America Scheelite Market, By Purity, 2017-2022 (US$ Bn)
TABLE 42 North America Scheelite Market, By Purity, 2023-2030 (US$ Bn)
TABLE 43 North America Scheelite Market, by Application, 2017-2022 (US$ Bn)
TABLE 44 North America Scheelite Market, by Application, 2023-2030 (US$ Bn)
TABLE 45 North America Scheelite Market, By End-Use, 2017-2022 (US$ Bn)
TABLE 46 North America Scheelite Market, By End-Use, 2023-2030 (US$ Bn)
TABLE 47 North America Scheelite Market, by Country, 2017-2022 (US$ Bn)
TABLE 48 North America Scheelite Market, by Country, 2023-2030 (US$ Bn)
TABLE 49 United States Scheelite Market, By Purity, 2017-2022 (US$ Bn)
TABLE 50 United States Scheelite Market, By Purity, 2023-2030 (US$ Bn)
TABLE 51 United States Scheelite Market, by Application, 2017-2022 (US$ Bn)
TABLE 52 United States Scheelite Market, by Application, 2023-2030 (US$ Bn)
TABLE 53 United States Scheelite Market, By End-Use, 2017-2022 (US$ Bn)
TABLE 54 United States Scheelite Market, By End-Use, 2023-2030 (US$ Bn)
TABLE 55 Canada Scheelite Market, By Purity, 2017-2022 (US$ Bn)
TABLE 56 Canada Scheelite Market, By Purity, 2023-2030 (US$ Bn)
TABLE 57 Canada Scheelite Market, by Application, 2017-2022 (US$ Bn)
TABLE 58 Canada Scheelite Market, by Application, 2023-2030 (US$ Bn)
TABLE 59 Canada Scheelite Market, By End-Use, 2017-2022 (US$ Bn)
TABLE 60 Canada Scheelite Market, By End-Use, 2023-2030 (US$ Bn)
TABLE 61 Mexico Scheelite Market, By Purity, 2017-2022 (US$ Bn)
TABLE 62 Mexico Scheelite Market, By Purity, 2023-2030 (US$ Bn)
TABLE 63 Mexico Scheelite Market, by Application, 2017-2022 (US$ Bn)
TABLE 64 Mexico Scheelite Market, by Application, 2023-2030 (US$ Bn)
TABLE 65 Mexico Scheelite Market, By End-Use, 2017-2022 (US$ Bn)
TABLE 66 Mexico Scheelite Market, By End-Use, 2023-2030 (US$ Bn)
TABLE 67 Europe Scheelite Market, By Purity, 2017-2022 (US$ Bn)
TABLE 68 Europe Scheelite Market, By Purity, 2023-2030 (US$ Bn)
TABLE 69 Europe Scheelite Market, by Application, 2017-2022 (US$ Bn)
TABLE 70 Europe Scheelite Market, by Application, 2023-2030 (US$ Bn)
TABLE 71 Europe Scheelite Market, By End-Use, 2017-2022 (US$ Bn)
TABLE 72 Europe Scheelite Market, By End-Use, 2023-2030 (US$ Bn)
TABLE 73 Europe Scheelite Market, by Country, 2017-2022 (US$ Bn)
TABLE 74 Europe Scheelite Market, by Country, 2023-2030 (US$ Bn)
TABLE 75 Germany Scheelite Market, By Purity, 2017-2022 (US$ Bn)
TABLE 76 Germany Scheelite Market, By Purity, 2023-2030 (US$ Bn)
TABLE 77 Germany Scheelite Market, by Application, 2017-2022 (US$ Bn)
TABLE 78 Germany Scheelite Market, by Application, 2023-2030 (US$ Bn)
TABLE 79 Germany Scheelite Market, By End-Use, 2017-2022 (US$ Bn)
TABLE 80 Germany Scheelite Market, By End-Use, 2023-2030 (US$ Bn)
TABLE 81 France Scheelite Market, By Purity, 2017-2022 (US$ Bn)
TABLE 82 France Scheelite Market, By Purity, 2023-2030 (US$ Bn)
TABLE 83 France Scheelite Market, by Application, 2017-2022 (US$ Bn)
TABLE 84 France Scheelite Market, by Application, 2023-2030 (US$ Bn)
TABLE 85 France Scheelite Market, By End-Use, 2017-2022 (US$ Bn)
TABLE 86 France Scheelite Market, By End-Use, 2023-2030 (US$ Bn)
TABLE 87 United Kingdom Scheelite Market, By Purity, 2017-2022 (US$ Bn)
TABLE 88 United Kingdom Scheelite Market, By Purity, 2023-2030 (US$ Bn)
TABLE 89 United Kingdom Scheelite Market, by Application, 2017-2022 (US$ Bn)
TABLE 90 United Kingdom Scheelite Market, by Application, 2023-2030 (US$ Bn)
TABLE 91 United Kingdom Scheelite Market, By End-Use, 2017-2022 (US$ Bn)
TABLE 92 United Kingdom Scheelite Market, By End-Use, 2023-2030 (US$ Bn)
TABLE 93 Italy Scheelite Market, By Purity, 2017-2022 (US$ Bn)
TABLE 94 Italy Scheelite Market, By Purity, 2023-2030 (US$ Bn)
TABLE 95 Italy Scheelite Market, by Application, 2017-2022 (US$ Bn)
TABLE 96 Italy Scheelite Market, by Application, 2023-2030 (US$ Bn)
TABLE 97 Italy Scheelite Market, By End-Use, 2017-2022 (US$ Bn)
TABLE 98 Italy Scheelite Market, By End-Use, 2023-2030 (US$ Bn)
TABLE 99 Spain Scheelite Market, By Purity, 2017-2022 (US$ Bn)
TABLE 100 Spain Scheelite Market, By Purity, 2023-2030 (US$ Bn)
TABLE 101 Spain Scheelite Market, by Application, 2017-2022 (US$ Bn)
TABLE 102 Spain Scheelite Market, by Application, 2023-2030 (US$ Bn)
TABLE 103 Spain Scheelite Market, By End-Use, 2017-2022 (US$ Bn)
TABLE 104 Spain Scheelite Market, By End-Use, 2023-2030 (US$ Bn)
TABLE 105 Rest of Europe Scheelite Market, By Purity, 2017-2022 (US$ Bn)
TABLE 106 Rest of Europe Scheelite Market, By Purity, 2023-2030 (US$ Bn)
TABLE 107 Rest of Europe Scheelite Market, by Application, 2017-2022 (US$ Bn)
TABLE 108 Rest of Europe Scheelite Market, by Application, 2023-2030 (US$ Bn)
TABLE 109 Rest of Europe Scheelite Market, By End-Use, 2017-2022 (US$ Bn)
TABLE 110 Rest of Europe Scheelite Market, By End-Use, 2023-2030 (US$ Bn)
TABLE 111 Asia Pacific Scheelite Market, By Purity, 2017-2022 (US$ Bn)
TABLE 112 Asia Pacific Scheelite Market, By Purity, 2023-2030 (US$ Bn)
TABLE 113 Asia Pacific Scheelite Market, by Application, 2017-2022 (US$ Bn)
TABLE 114 Asia Pacific Scheelite Market, by Application, 2023-2030 (US$ Bn)
TABLE 115 Asia Pacific Scheelite Market, By End-Use, 2017-2022 (US$ Bn)
TABLE 116 Asia Pacific Scheelite Market, By End-Use, 2023-2030 (US$ Bn)
TABLE 117 China Scheelite Market, By Purity, 2017-2022 (US$ Bn)
TABLE 118 China Scheelite Market, By Purity, 2023-2030 (US$ Bn)
TABLE 119 China Scheelite Market, by Application, 2017-2022 (US$ Bn)
TABLE 120 China Scheelite Market, by Application, 2023-2030 (US$ Bn)
TABLE 121 China Scheelite Market, By End-Use, 2017-2022 (US$ Bn)
TABLE 122 China Scheelite Market, By End-Use, 2023-2030 (US$ Bn)
TABLE 123 Japan Scheelite Market, By Purity, 2017-2022 (US$ Bn)
TABLE 124 Japan Scheelite Market, By Purity, 2023-2030 (US$ Bn)
TABLE 125 Japan Scheelite Market, by Application, 2017-2022 (US$ Bn)
TABLE 126 Japan Scheelite Market, by Application, 2023-2030 (US$ Bn)
TABLE 127 Japan Scheelite Market, By End-Use, 2017-2022 (US$ Bn)
TABLE 128 Japan Scheelite Market, By End-Use, 2023-2030 (US$ Bn)
TABLE 129 India Scheelite Market, By Purity, 2017-2022 (US$ Bn)
TABLE 130 India Scheelite Market, By Purity, 2023-2030 (US$ Bn)
TABLE 131 India Scheelite Market, by Application, 2017-2022 (US$ Bn)
TABLE 132 India Scheelite Market, by Application, 2023-2030 (US$ Bn)
TABLE 133 India Scheelite Market, By End-Use, 2017-2022 (US$ Bn)
TABLE 134 India Scheelite Market, By End-Use, 2023-2030 (US$ Bn)
TABLE 135 South Korea Scheelite Market, By Purity, 2017-2022 (US$ Bn)
TABLE 136 South Korea Scheelite Market, By Purity, 2023-2030 (US$ Bn)
TABLE 137 South Korea Scheelite Market, by Application, 2017-2022 (US$ Bn)
TABLE 138 South Korea Scheelite Market, by Application, 2023-2030 (US$ Bn)
TABLE 139 South Korea Scheelite Market, By End-Use, 2017-2022 (US$ Bn)
TABLE 140 South Korea Scheelite Market, By End-Use, 2023-2030 (US$ Bn)
TABLE 141 South-East Asia Scheelite Market, By Purity, 2017-2022 (US$ Bn)
TABLE 142 South-East Asia Scheelite Market, By Purity, 2023-2030 (US$ Bn)
TABLE 143 South-East Asia Scheelite Market, by Application, 2017-2022 (US$ Bn)
TABLE 144 South-East Asia Scheelite Market, by Application, 2023-2030 (US$ Bn)
TABLE 145 South-East Asia Scheelite Market, By End-Use, 2017-2022 (US$ Bn)
TABLE 146 South-East Asia Scheelite Market, By End-Use, 2023-2030 (US$ Bn)
TABLE 147 Rest of Asia Pacific Scheelite Market, By Purity, 2017-2022 (US$ Bn)
TABLE 148 Rest of Asia Pacific Scheelite Market, By Purity, 2023-2030 (US$ Bn)
TABLE 149 Rest of Asia Pacific Scheelite Market, by Application, 2017-2022 (US$ Bn)
TABLE 150 Rest of Asia Pacific Scheelite Market, by Application, 2023-2030 (US$ Bn)
TABLE 151 Rest of Asia Pacific Scheelite Market, By End-Use, 2017-2022 (US$ Bn)
TABLE 152 Rest of Asia Pacific Scheelite Market, By End-Use, 2023-2030 (US$ Bn)
TABLE 153 Latin America Scheelite Market, By Purity, 2017-2022 (US$ Bn)
TABLE 154 Latin America Scheelite Market, By Purity, 2023-2030 (US$ Bn)
TABLE 155 Latin America Scheelite Market, by Application, 2017-2022 (US$ Bn)
TABLE 156 Latin America Scheelite Market, by Application, 2023-2030 (US$ Bn)
TABLE 157 Latin America Scheelite Market, By End-Use, 2017-2022 (US$ Bn)
TABLE 158 Latin America Scheelite Market, By End-Use, 2023-2030 (US$ Bn)
TABLE 159 Brazil Scheelite Market, By Purity, 2017-2022 (US$ Bn)
TABLE 160 Brazil Scheelite Market, By Purity, 2023-2030 (US$ Bn)
TABLE 161 Brazil Scheelite Market, by Application, 2017-2022 (US$ Bn)
TABLE 162 Brazil Scheelite Market, by Application, 2023-2030 (US$ Bn)
TABLE 163 Brazil Scheelite Market, By End-Use, 2017-2022 (US$ Bn)
TABLE 164 Brazil Scheelite Market, By End-Use, 2023-2030 (US$ Bn)
TABLE 165 Argentina Scheelite Market, By Purity, 2017-2022 (US$ Bn)
TABLE 166 Argentina Scheelite Market, By Purity, 2023-2030 (US$ Bn)
TABLE 167 Argentina Scheelite Market, by Application, 2017-2022 (US$ Bn)
TABLE 168 Argentina Scheelite Market, by Application, 2023-2030 (US$ Bn)
TABLE 169 Argentina Scheelite Market, By End-Use, 2017-2022 (US$ Bn)
TABLE 170 Argentina Scheelite Market, By End-Use, 2023-2030 (US$ Bn)
TABLE 171 Rest of Latin America Scheelite Market, By Purity, 2017-2022 (US$ Bn)
TABLE 172 Rest of Latin America Scheelite Market, By Purity, 2023-2030 (US$ Bn)
TABLE 173 Rest of Latin America Scheelite Market, by Application, 2017-2022 (US$ Bn)
TABLE 174 Rest of Latin America Scheelite Market, by Application, 2023-2030 (US$ Bn)
TABLE 175 Rest of Latin America Scheelite Market, By End-Use, 2017-2022 (US$ Bn)
TABLE 176 Rest of Latin America Scheelite Market, By End-Use, 2023-2030 (US$ Bn)
TABLE 177 Middle East and Africa Scheelite Market, By Purity, 2017-2022 (US$ Bn)
TABLE 178 Middle East and Africa Scheelite Market, By Purity, 2023-2030 (US$ Bn)
TABLE 179 Middle East and Africa Scheelite Market, by Application, 2017-2022 (US$ Bn)
TABLE 180 Middle East and Africa Scheelite Market, by Application, 2023-2030 (US$ Bn)
TABLE 181 Middle East and Africa Scheelite Market, By End-Use, 2017-2022 (US$ Bn)
TABLE 182 Middle East and Africa Scheelite Market, By End-Use, 2023-2030 (US$ Bn)
TABLE 183 GCC Countries Scheelite Market, By Purity, 2017-2022 (US$ Bn)
TABLE 184 GCC Countries Scheelite Market, By Purity, 2023-2030 (US$ Bn)
TABLE 185 GCC Countries Scheelite Market, by Application, 2017-2022 (US$ Bn)
TABLE 186 GCC Countries Scheelite Market, by Application, 2023-2030 (US$ Bn)
TABLE 187 GCC Countries Scheelite Market, By End-Use, 2017-2022 (US$ Bn)
TABLE 188 GCC Countries Scheelite Market, By End-Use, 2023-2030 (US$ Bn)
TABLE 189 South Africa Scheelite Market, By Purity, 2017-2022 (US$ Bn)
TABLE 190 South Africa Scheelite Market, By Purity, 2023-2030 (US$ Bn)
TABLE 191 South Africa Scheelite Market, by Application, 2017-2022 (US$ Bn)
TABLE 192 South Africa Scheelite Market, by Application, 2023-2030 (US$ Bn)
TABLE 193 South Africa Scheelite Market, By End-Use, 2017-2022 (US$ Bn)
TABLE 194 South Africa Scheelite Market, By End-Use, 2023-2030 (US$ Bn)
TABLE 195 Rest of Middle East and Africa Scheelite Market, By Purity, 2017-2022 (US$ Bn)
TABLE 196 Rest of Middle East and Africa Scheelite Market, By Purity, 2023-2030 (US$ Bn)
TABLE 197 Rest of Middle East and Africa Scheelite Market, by Application, 2017-2022 (US$ Bn)
TABLE 198 Rest of Middle East and Africa Scheelite Market, by Application, 2023-2030 (US$ Bn)
TABLE 199 Rest of Middle East and Africa Scheelite Market, By End-Use, 2017-2022 (US$ Bn)
TABLE 200 Rest of Middle East and Africa Scheelite Market, By End-Use, 2023-2030 (US$ Bn)

Frequently Asked Questions

What is the current size of the global Scheelite market?

The global Scheelite market was valued at USD 83.9 Billion in 2022.

What is the expected growth rate of the Scheelite market between 2023 and 2030?

The Scheelite market is expected to grow at a CAGR of 4.50% between 2023 and 2030, reaching USD 119.31 Billion in 2030.

Which segment is leading the market share in terms of purity?

98.0% is the leading segment by purity, holding over 43% share in value in 2022

Which application segment governs the demand for Scheelites in the world?

The tungsten alloy segment governs the demand for scheelites globally, holding a massive share of over 40% in 2022, and is also expected to grow at a rapid CAGR.

Which segment is expected to post the highest CAGR during the forecast period?

The mining segment is expected to post the highest CAGR during the forecast period.

Which region is fueling the growth of the Scheelite industry?

Asia Pacific is fueling the growth of the scheelite industry with over 43% share in 2022.

Who are the major players in the global Scheelite market?

The top players include American Elements, Sanher Tungsten Vietnam Co., Ltd., Maruti Enterprise, and Arth Metallurgicals Pvt.Ltd, United Wolfram, Anchor Chemicals Industries, and Sun Industries.

What are the major market drivers of the Scheelite industry?

The increasing use of tungsten in numerous end-use sectors is the major market driver.

What are the major market restraints of the Scheelite industry?

The major market restraints are the high cost of tungsten manufacturing and its price volatility, which can impact the profitability of scheelite mining operations.

What are the major market opportunities of the Scheelite industry?

Growing investment in the mining industry, notably in nations like China, Russia, Canada, and Australia, which are among the top producers of scheelite, is supporting the expansion are the major opportunities in the Scheelite industry.

Isostearic Acid Market

Published:
Report ID: 7580

South Africa Graphene Market

Published:
Report ID: 36617

Specialty Nitrile Butadiene Rubber Market

Published:
Report ID: 36614

Roofing Chemicals Market

Published:
Report ID: 36599

Radiation Curable Coatings Market

Published:
Report ID: 36596

1,4 Butanediol Market

Published:
Report ID: 36581

Palm Kernel Fatty Acids Market

Published:
Report ID: 36574

Crop Protection Chemicals Market

Published:
Report ID: 36441

Cosmetic Ingredients Market

Published:
Report ID: 3703

Hydrocolloids Market

Published:
Report ID: 36265

Ion Exchange Resins Market

Published:
Report ID: 36220

Herbal Extract Market

Published:
Report ID: 36211

Purchase Options

$2999
Delivery Format: Excel.
$4999
Designed for the individual purchaser.
$6999
Users located at a single corporate site or regional office.
$7999
Allowed for unlimited sharing globally within one company.
Smallform of Sample request

Have a question?

User Profile

Don’t settle for less – trust Mitul to help you find the best solution.

Report delivery within 24 to 48 hours

– Other Info –

What people say?-

User Review

I am very impressed with the information in this report. The author clearly did their research when they came up with this product and it has already given me a lot of ideas.

Jana Schmidt
CEDAR CX Technologies

– Connect with us –

Phone

+91 6232 49 3207


support

24/7 Research Support


sales@credenceresearch.com

– Research Methodology –

Going beyond the basics: advanced techniques in research methodology

– Trusted By –

Pepshi, LG, Nestle
Motorola, Honeywell, Johnson and johnson
LG Chem, SIEMENS, Pfizer
Unilever, Samsonite, QIAGEN