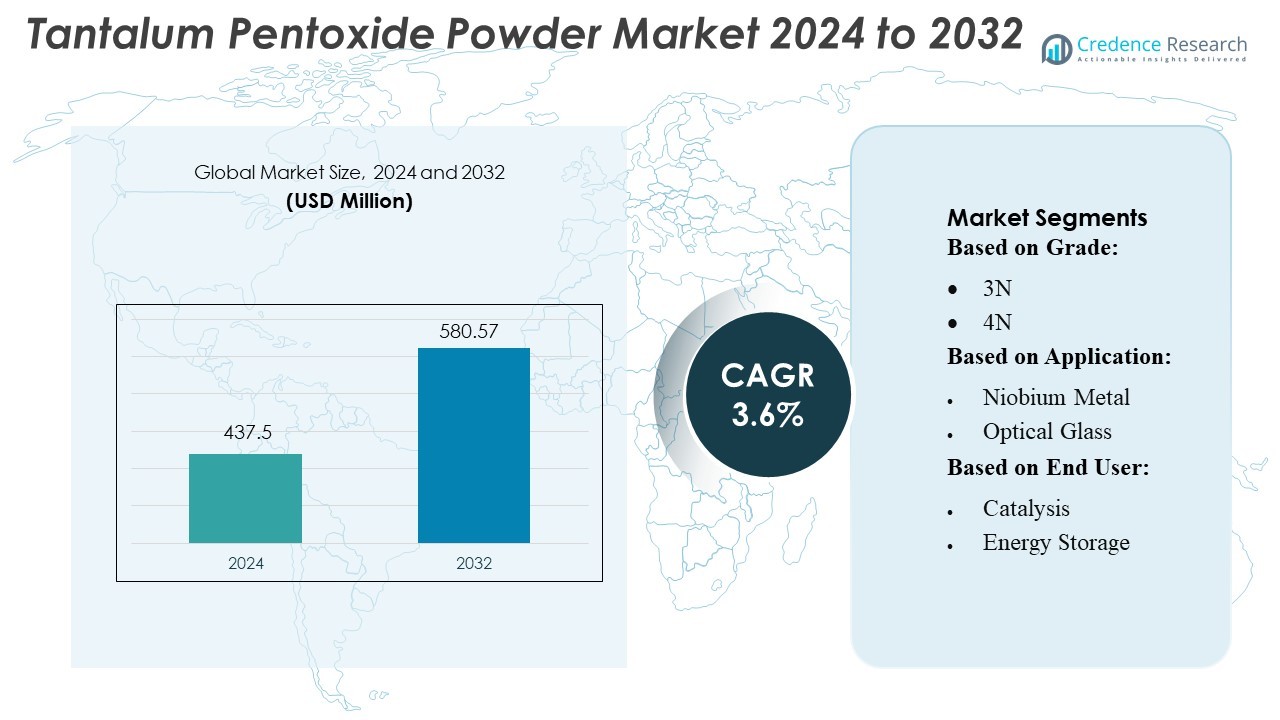
Home » Advanced Materials » Tantalum Pentoxide Powder Market

Tantalum Pentoxide Powder Market By Type (Single Crystal, Electronic Ceramics, Optical Lens) By Application (Application A, Application B, Others)-Growth, Future Prospects & Competitive Analysis, 2016 – 2030

Report ID: 19117 | Report Format : Excel, PDF

Key Highlights of the Report

The global tantalum pentoxide powder market is segmented by type, application, and region. The electronic ceramics type segment is the most popular, while the single crystal is the primary type segment. Application A is the application segment, with Asia-Pacific leading the market growth.

The global tantalum pentoxide powder market has been driven by several factors, including the rising demand in electronics devices manufacturing such as smartphones, tablets, laptops, and automotive electronics & growing need for clean and efficient energy sources. However, the market also faces significant challenges, including environmental degradation and social issues, such as human rights violations and child labor & competition from alternative materials, including ceramics, polymers, and other metal oxides.

Nonetheless, the global tantalum pentoxide powder market offers significant growth opportunities, such as tremendous advancements in technology create new opportunities for the utilization of tantalum pentoxide powder & move towards renewable energy sources, such as wind and solar power.

Access crucial information at unmatched prices!

Request your sample report today & start making informed decisions powered by Credence Research Inc.!

Download Sample

Market Overview

The global Tantalum pentoxide powder market has witnessed steady growth in recent years and is expected to grow at a CAGR of 6.50% between 2023 and 2030. The market was valued at USD 0.39 billion in 2022 and is expected to reach USD 0.606054753 billion in 2030.

What Are the Main Drivers Of The Global Tantalum pentoxide powder Market?

The global Tantalum pentoxide powder market is driven by several factors, including the growing demand in electronics manufacturing & increasing adoption in the energy sector.

What Are the Major Challenges Faced by The Global Tantalum pentoxide powder Market?

The global Tantalum pentoxide powder market also faces several challenges, including the supply chain complexity including supply disruptions, political instability, and regulatory changes & fluctuations in prices.

What Are the Growth Opportunities in The Global Tantalum pentoxide powder Market?

The global Tantalum pentoxide powder market offers significant growth opportunities, such as the continuous advancements in technology & move towards renewable energy sources, such as wind and solar power.

Executive Summary

Overview of the Global Tantalum pentoxide powder market

The global Tantalum pentoxide powder market has been steadily growing in recent years, driven by various factors such as advancement of technology & global accessibility. The market is characterized by a wide range of equipment, designs, and sizes, catering to diverse consumer preferences.

Market Definition

The tantalum pentoxide powder market refers to the global industry involved in the production, distribution, and consumption of the fine powder form of tantalum pentoxide (Ta2O5). The high-purity compound tantalum pentoxide powder, commonly referred to as tantalum oxide powder, is widely utilized in a variety of applications, such as catalysts, electronic parts, capacitors, and optical coatings. Tantalum pentoxide powder is purchased, processed, and used by manufacturers, suppliers, distributors, and end-users within the market. The market for tantalum pentoxide powder is expanding and becoming more dynamic due to elements like demand from the electronics sector, technical breakthroughs, and material features.

Market Insights

  • The global demand for Tantalum pentoxide powder was valued at USD 0.39 Billion in 2022 and is expected to reach USD 0.606054753 Billion in 2030, growing at a CAGR of 6.50% between 2023 and 2030.
  • Electronic Ceramics type is the leading segment and held around three-fifth of the share in terms of value in 2022, while the single crystal segment is likely to exhibit the fastest CAGR during the forecast period.
  • Application A is expected to post the highest CAGR during the forecast period & leading the market share with more than 30% share in 2022.
  • Asia-pacific is fueling the growth of the Tantalum pentoxide powder industry with nearly two-fifth share in 2022, while Europe and North America collectively accounted for just nearly under 55% share in 2022. Asia-pacific held over 29% share in 2022.
  • Growing demand in electronics manufacturing & rising adoption in the energy sector are the major drivers of the market. At the same disruptions in the supply chain, affecting the availability and pricing of tantalum pentoxide powder & volatility in price due to its limited availability and the global supply-demand dynamics are the main restraints.
  • Continuous advancements in technology create new opportunities for the utilization of tantalum pentoxide powder & transition towards renewable energy sources, such as solar and wind power, as the major opportunity in the market.

Segmentation by type

  • Electronic Ceramics type is the leading segment and held around three-fifth of the share in value in 2022.
  • The single crystal will likely exhibit the fastest CAGR during the forecast period.

Segmentation by Application

  • Application A segment governs the demand for the tantalum pentoxide powder industry in the world, holding a massive share, and is also expected to grow at a rapid CAGR.
  • The Application B segment contributes to the rest of the demand for tantalum pentoxide powder industry.

Segmentation by Region

  • Asia-pacific was fueling the growth of the Tantalum pentoxide powder industry with a nearly two-fifths share in 2022.
  • Europe and North America collectively account for nearly under 55% share in 2022, with Asia-pacific holding over 29% share in the same year.
  • The rest of the world, including Latin America, The Middle East, and Africa, contributes the remainder to the demand for Tantalum pentoxide powders.

The rising demand in electronics devices manufacturing, such as smartphones, tablets, laptops, and automotive electronics & growing need for clean and efficient energy sources are driving the market. However, the market is restrained by the disruptions in the supply chain, affecting the availability & pricing of tantalum pentoxide powder & volatility in price due to its limited availability and the global supply-demand dynamics.

Spain has a robust electronics manufacturing industry that produces a range of electronic products, including smartphones, tablets, and automotive electronics. A crucial ingredient in the manufacture of tantalum capacitors, crucial parts of various electrical gadgets, is tantalum pentoxide powder. The industry for tantalum pentoxide powder is expanding in Spain as a result of the expanding demand for electronics on the European market and in Spain. With investments in technical innovation and advancement, it has a well-developed research and development environment. As a result, the sector can create new uses and enhance tantalum pentoxide powder’s functionality.

Canada is known to have significant tantalum resources, particularly in regions such as Quebec and Northwest Territories. The tantalum pentoxide powder industry in Canada benefits from the availability of indigenous tantalum resources since it guarantees a steady and dependable supply of raw materials for manufacture. Its mining industry is developed and well-known on a global scale. Tantalum ore can be extracted effectively and sustainably because of the nation’s competence in mining and extraction methods. For the manufacturing of tantalum pentoxide powder, this promotes the creation of a reliable supply chain.

Tantalum Pentoxide Powder Market

Growing demand in electronics manufacturing

With rising use of smartphones, tablets, computers, and other consumer gadgets, electronic devices have become a crucial aspect of daily life. The effective operation of these devices depends on tantalum capacitors. Tantalum capacitors are appropriate for use in applications that call for dependable energy storage, power management, and filtering because of their high capacitance and consistent performance. The need for tantalum pentoxide powder is driven by the global increase in the demand for electronic gadgets and tantalum capacitors. Technology progress has led to the development of electrical devices that are more compact, lighter, and more potent. There is a demand for miniaturized components with high energy storage capabilities as devices get smaller.

Increasing adoption in the energy sector

Tantalum pentoxide powder is also used in the production of solid oxide fuel cells (SOFCs), which have applications in the energy sector for power generation. The demand for tantalum pentoxide powder has increased as a result of the rising demand for clean and efficient energy sources and the expanding deployment of SOFCs. Power generation with SOFCs is extremely effective and safe for the environment. Through an electrochemical process, they immediately transform chemical energy into electrical energy with comparatively low greenhouse gas emissions. In order to replace or supplement conventional fossil fuel-based power production techniques, innovative technologies like SOFCs are becoming more and more necessary as the world turns its attention to clean and sustainable energy.

Environmental degradation and social concerns

Tantalum mining, especially in the DRC, has been linked to societal problems like child labor and human rights abuses, as well as environmental damage. As a result, customers and regulatory organizations are calling for increased openness and adherence to ethical sourcing procedures, which has increased scrutiny on the tantalum pentoxide powder supply chain. For industry participants, meeting these standards might be difficult and may have an influence on the sector’s overall growth.

Moreover, Regulatory bodies & governments around the world have implemented measures to address the issue of conflict minerals, including tantalum sourced from conflict-affected regions. For instance, firms must report the use of conflict minerals in their goods and show due diligence in their supply chains under the US’s Dodd-Frank Wall Street Reform and Consumer Protection Act.

Transition towards renewable energy sectors

By their very nature, renewable energy sources like wind and solar electricity are intermittent, meaning that the amount of energy they provide changes with the weather. Energy storage technologies are essential for reducing this unpredictability and maintaining a steady and dependable power supply. Solid oxide fuel cells (SOFCs) and electrolytic capacitors, two essential parts of energy storage systems, are made using tantalum pentoxide powder. A dependable backup power supply is made possible by SOFCs’ efficient conversion of extra renewable energy into electrical energy that is stored. On the other hand, electrolytic capacitors are employed in energy storage applications to swiftly store and release energy. The growing adoption of energy storage systems to support renewable energy integration creates a favorable market for tantalum pentoxide powder.

Competitive Landscape

Key Players

The global Tantalum pentoxide powder market is highly competitive, with the presence of several key players. Some of the major players in the market and their market share are as follows:

  • Global Advanced Metals
  • AMG
  • Materion
  • Taniobis (JX Nippon Mining and Metals)
  • Mitsui Kinzoku
  • Taki Chemical
  • MAIL
  • Solikamsk Magnesium Works
  • Ningxia Orient Tantalum
  • Jiujiang Tanbre
  • KING-TAN Tantalum
  • FandX Electro-Materials
  • Ximei Group

These companies focus on product innovation, expanding their applications, mergers, and acquisitions to stay ahead in the market.

The major players in the global Tantalum pentoxide powder market constantly strive to stay ahead by introducing new products and innovations.

Shape Your Report to Specific Countries or Regions & Enjoy 30% Off!

Summary of Key Findings

  • The rising demand in electronics devices manufacturing such as smartphones, tablets, laptops, and automotive electronics & growing need for clean and efficient energy are driving market growth
  • Market segmented by type, application, and region.
  • The electronic Ceramics type is the most popular, with the Single Crystal type as the primary type segment.
  • Application A is the most common application segment.
  • North America is leading market growth; the market is highly competitive with key players including Kasamba, Psychic Source, California Psychics, Purple Garden, Mysticsense and others.

Future Outlook

  • Positive outlook for the global tantalum pentoxide powder market with significant growth potential in the Asia-Pacific region
  • rising demand in electronics devices manufacturing such as smartphones, tablets, laptops, and automotive electronics & growing need for clean and efficient energy sources driving growth
  • Challenges like environmental degradation and social issues, such as human rights violations and child labor & competition from alternative materials, including ceramics, polymers, and other metal oxides.

Segmentation

  • By Type
    • Single Crystal
    • Electronic Ceramics
    • Optical Lens
  • By Application
    • Application A
    • Application B
    • Others
  • By Region
  • North America
    • The US.
    • Canada
    • Mexico
  • Europe
    • Germany
    • France
    • The U.K.
    • Italy
    • Spain
    • Rest of Europe
  • Asia Pacific
    • China
    • Japan
    • India
    • South Korea
    • South-east Asia
    • Rest of Asia Pacific
  • Latin America
    • Brazil
    • Argentina
    • Rest of Latin America
  • Middle East & Africa
    • GCC Countries
    • South Africa
    • Rest of the Middle East and Africa

1. Preface
1.1. Report Description
1.1.1. Purpose of the Report
1.1.2. Target Audience
1.1.3. USP and Key Offerings
1.2. Research Scope
1.3. Research Methodology
1.3.1. Phase I – Secondary Research
1.3.2. Phase II – Data Modelling
1.3.2.1. Company Share Analysis Model
1.3.2.2. Revenue Based Modelling
1.3.3. Phase III – Primary Research
1.3.4. Research Limitations
1.3.5. Assumptions
1.4. Market Introduction
1.5. Market Research Scope

2. Executive Summary
2.1. Market Snapshot: Global Tantalum Pentoxide Powder Market
2.2. Global Tantalum Pentoxide Powder Market, By Type
2.3. Global Tantalum Pentoxide Powder Market, By Application
2.4. Global Tantalum Pentoxide Powder Market, By Region

3. Market Dynamics & Factors Analysis
3.1. Introduction
3.1.1. Global Tantalum Pentoxide Powder Market Value, 2017-2030, (US$ Bn)
3.1.2. Y-o-Y Growth Trend Analysis
3.2. Market Dynamics
3.2.1. Market Drivers
3.2.1.1. Driver 1
3.2.1.2. Driver 2
3.2.1.3. Driver 3
3.2.2. Market Restraints
3.2.2.1. Restraint 1
3.2.2.2. Restraint 2
3.2.3. Market Opportunities
3.2.3.1. Opportunity 1
3.2.3.2. Opportunity 2
3.2.4. Major Industry Challenges
3.2.4.1. Challenge 1
3.2.4.2. Challenge 2
3.3. Growth and Development Patterns
3.4. Investment Feasibility Analysis
3.5. Market Opportunity Analysis
3.5.1. Type
3.5.2. Application
3.5.3. Geography

4. Premium Insights
4.1. STAR (Situation, Task, Action, Results) Analysis
4.2. Porter’s Five Forces Analysis
4.2.1. Threat of New Entrants
4.2.2. Bargaining Power of Buyers/Consumers
4.2.3. Bargaining Power of Suppliers
4.2.4. Threat of Substitute Types
4.2.5. Intensity of Competitive Rivalry
4.3. Key Market Trends
4.3.1. Demand Side Trends
4.3.2. Supply Side Trends
4.4. Value Chain Analysis
4.5. Technology Analysis
4.6. Analysis and Recommendations
4.7. Marketing Strategy Analysis
4.7.1. Direct Marketing
4.7.2. Indirect Marketing
4.7.3. Marketing Channel Development Trend

5. Market Positioning of Key Players, 2022
5.1. Company market share of key players, 2022
5.2. Competitive Benchmarking
5.3. Market Positioning of Key Vendors
5.4. Geographical Presence Analysis
5.5. Major Strategies Adopted by Key Players
5.5.1. Key Strategies Analysis
5.5.2. Mergers and Acquisitions
5.5.3. Partnerships
5.5.4. Product Launch
5.5.5. Geographical Expansion
5.5.6. Others

6. Economic Impact Analysis
6.1. Recession Impact
6.1.1. North America
6.1.2. Europe
6.1.3. Asia Pacific
6.1.4. Latin America
6.1.5. Middle East and Africa
6.2. Ukraine-Russia War Impact
6.2.1. North America
6.2.2. Europe
6.2.3. Asia Pacific
6.2.4. Latin America
6.2.5. Middle East and Africa
6.3. COVID-19 Impact Analysis
6.3.1. North America
6.3.2. Europe
6.3.3. Asia Pacific
6.3.4. Latin America
6.3.5. Middle East and Africa

7. Global Tantalum Pentoxide Powder Market, By Type
7.1. Global Tantalum Pentoxide Powder Market Overview, by Type
7.1.1. Global Tantalum Pentoxide Powder Market Revenue Share, By Type, 2022 Vs 2030 (in %)
7.2. Electronic Ceramics
7.2.1. Global Tantalum Pentoxide Powder Market, By Region, 2017-2030 (US$ Bn)
7.3. Single Crystal
7.3.1. Global Tantalum Pentoxide Powder Market, By Region, 2017-2030 (US$ Bn)
7.4. Optical Lens
7.4.1. Global Tantalum Pentoxide Powder Market, By Region, 2017-2030 (US$ Bn)

8. Global Tantalum Pentoxide Powder Market, By Application
8.1. Global Tantalum Pentoxide Powder Market Overview, by Application
8.1.1. Global Tantalum Pentoxide Powder Market, By Application, 2022 vs 2030 (in %)
8.2. Application A
8.2.1. Global Tantalum Pentoxide Powder Market, By Region, 2017-2030 (US$ Bn)
8.3. Application B
8.3.1. Global Tantalum Pentoxide Powder Market, By Region, 2017-2030 (US$ Bn)
8.4. Other
8.4.1. Global Tantalum Pentoxide Powder Market, By Region, 2017-2030 (US$ Bn)

9. Global Tantalum Pentoxide Powder Market, By Region
9.1. Global Tantalum Pentoxide Powder Market Overview, by Region
9.1.1. Global Tantalum Pentoxide Powder Market, By Region, 2022 vs 2030 (in%)
9.2. Type
9.2.1. Global Tantalum Pentoxide Powder Market, By Type, 2017-2030 (US$ Bn)
9.3. Application
9.3.1. Global Tantalum Pentoxide Powder Market, By Application, 2017-2030 (US$ Bn)

10. North America Tantalum Pentoxide Powder Market Analysis
10.1. North America Tantalum Pentoxide Powder Market, by Type, 2017-2030(US$ Bn)
10.1.1. Overview
10.1.2. SRC Analysis
10.2. North America Tantalum Pentoxide Powder Market, by Application, 2017-2030(US$ Bn)
10.2.1. Overview
10.2.2. SRC Analysis
10.3. North America Tantalum Pentoxide Powder Market, by Country, 2017-2030 (US$ Bn)
10.3.1. North America Tantalum Pentoxide Powder Market, by Country, 2022 Vs 2030 (in%)
10.3.2. U.S.
10.3.2.1. U.S. Tantalum Pentoxide Powder Market Estimates and Forecast, 2017-2030 (US$ Bn)
10.3.2.2. U.S. Tantalum Pentoxide Powder, By Type, 2017-2030 (US$ Bn)
10.3.2.3. U.S. Tantalum Pentoxide Powder, By Application, 2017-2030 (US$ Bn)
10.3.3. Canada
10.3.3.1. Canada Tantalum Pentoxide Powder Market Estimates and Forecast, 2017-2030 (US$ Bn)
10.3.3.2. Canada Tantalum Pentoxide Powder, By Type, 2017-2030 (US$ Bn)
10.3.3.3. Canada Tantalum Pentoxide Powder, By Application, 2017-2030 (US$ Bn)
10.3.4. Mexico
10.3.4.1. Mexico Tantalum Pentoxide Powder Market Estimates and Forecast, 2017-2030 (US$ Bn)
10.3.4.2. Mexico Tantalum Pentoxide Powder, By Type, 2017-2030 (US$ Bn)
10.3.4.3. Mexico Tantalum Pentoxide Powder, By Application, 2017-2030 (US$ Bn)

11. Europe Tantalum Pentoxide Powder Market Analysis
11.1. Europe Tantalum Pentoxide Powder Market, by Type, 2017-2030(US$ Bn)
11.1.1. Overview
11.1.2. SRC Analysis
11.2. Europe Tantalum Pentoxide Powder Market, by Application, 2017-2030(US$ Bn)
11.2.1. Overview
11.2.2. SRC Analysis
11.3. Europe Tantalum Pentoxide Powder Market, by Country, 2017-2030 (US$ Bn)
11.3.1. Europe Tantalum Pentoxide Powder Market, by Country, 2022 Vs 2030 (in%)
11.3.2. Germany
11.3.2.1. Germany Tantalum Pentoxide Powder Market Estimates and Forecast, 2017-2030 (US$ Bn)
11.3.2.2. Germany Tantalum Pentoxide Powder, By Type, 2017-2030 (US$ Bn)
11.3.2.3. Germany Tantalum Pentoxide Powder, By Application, 2017-2030 (US$ Bn)
11.3.3. France
11.3.3.1. France Tantalum Pentoxide Powder Market Estimates and Forecast, 2017-2030 (US$ Bn)
11.3.3.2. France Tantalum Pentoxide Powder, By Type, 2017-2030 (US$ Bn)
11.3.3.3. France Tantalum Pentoxide Powder, By Application, 2017-2030 (US$ Bn)
11.3.4. UK
11.3.4.1. UK Tantalum Pentoxide Powder Market Estimates and Forecast, 2017-2030 (US$ Bn)
11.3.4.2. UK Tantalum Pentoxide Powder, By Type, 2017-2030 (US$ Bn)
11.3.4.3. UK Tantalum Pentoxide Powder, By Application, 2017-2030 (US$ Bn)
11.3.5. Italy
11.3.5.1. Italy Tantalum Pentoxide Powder Market Estimates and Forecast, 2017-2030 (US$ Bn)
11.3.5.2. Italy Tantalum Pentoxide Powder, By Type, 2017-2030 (US$ Bn)
11.3.5.3. Italy Tantalum Pentoxide Powder, By Application, 2017-2030 (US$ Bn)
11.3.6. Spain
11.3.6.1. Spain Tantalum Pentoxide Powder Market Estimates and Forecast, 2017-2030 (US$ Bn)
11.3.6.2. Spain Tantalum Pentoxide Powder, By Type, 2017-2030 (US$ Bn)
11.3.6.3. Spain Tantalum Pentoxide Powder, By Application, 2017-2030 (US$ Bn)
11.3.7. Rest of Europe
11.3.7.1. Rest of Europe Tantalum Pentoxide Powder Market Estimates and Forecast, 2017-2030 (US$ Bn)
11.3.7.2. Rest of Europe Tantalum Pentoxide Powder, By Type, 2017-2030 (US$ Bn)
11.3.7.3. Rest of Europe Tantalum Pentoxide Powder, By Application, 2017-2030 (US$ Bn)

12. Asia Pacific Tantalum Pentoxide Powder Market Analysis
12.1. Asia Pacific Tantalum Pentoxide Powder Market, by Type, 2017-2030(US$ Bn)
12.1.1. Overview
12.1.2. SRC Analysis
12.2. Asia Pacific Tantalum Pentoxide Powder Market, by Application, 2017-2030(US$ Bn)
12.2.1. Overview
12.2.2. SRC Analysis
12.3. Asia Pacific Tantalum Pentoxide Powder Market, by Country, 2017-2030 (US$ Bn)
12.3.1. Asia Pacific Tantalum Pentoxide Powder Market, by Country, 2022 Vs 2030 (in%)
12.3.2. China
12.3.2.1. China Tantalum Pentoxide Powder Market Estimates and Forecast, 2017-2030 (US$ Bn)
12.3.2.2. China Tantalum Pentoxide Powder, By Type, 2017-2030 (US$ Bn)
12.3.2.3. China Tantalum Pentoxide Powder, By Application, 2017-2030 (US$ Bn)
12.3.3. Japan
12.3.3.1. Japan Tantalum Pentoxide Powder Market Estimates and Forecast, 2017-2030 (US$ Bn)
12.3.3.2. Japan Tantalum Pentoxide Powder, By Type, 2017-2030 (US$ Bn)
12.3.3.3. Japan Tantalum Pentoxide Powder, By Application, 2017-2030 (US$ Bn)
12.3.4. India
12.3.4.1. India Tantalum Pentoxide Powder Market Estimates and Forecast, 2017-2030 (US$ Bn)
12.3.4.2. India Tantalum Pentoxide Powder, By Type, 2017-2030 (US$ Bn)
12.3.4.3. India Tantalum Pentoxide Powder, By Application, 2017-2030 (US$ Bn)
12.3.5. South Korea
12.3.5.1. South Korea Tantalum Pentoxide Powder Market Estimates and Forecast, 2017-2030 (US$ Bn)
12.3.5.2. South Korea Tantalum Pentoxide Powder, By Type, 2017-2030 (US$ Bn)
12.3.5.3. South Korea Tantalum Pentoxide Powder, By Application, 2017-2030 (US$ Bn)
12.3.6. South-East Asia
12.3.6.1. South-East Asia Tantalum Pentoxide Powder Market Estimates and Forecast, 2017-2030 (US$ Bn)
12.3.6.2. South-East Asia Tantalum Pentoxide Powder, By Type, 2017-2030 (US$ Bn)
12.3.6.3. South-East Asia Tantalum Pentoxide Powder, By Application, 2017-2030 (US$ Bn)
12.3.7. Rest of Asia Pacific
12.3.7.1. Rest of Asia Pacific Tantalum Pentoxide Powder Market Estimates and Forecast, 2017-2030 (US$ Bn)
12.3.7.2. Rest of Asia Pacific Tantalum Pentoxide Powder, By Type, 2017-2030 (US$ Bn)
12.3.7.3. Rest of Asia Pacific Tantalum Pentoxide Powder, By Application, 2017-2030 (US$ Bn)

13. Latin America Tantalum Pentoxide Powder Market Analysis
13.1. Latin America Tantalum Pentoxide Powder Market, by Type, 2017-2030(US$ Bn)
13.1.1. Overview
13.1.2. SRC Analysis
13.2. Latin America Tantalum Pentoxide Powder Market, by Application, 2017-2030(US$ Bn)
13.2.1. Overview
13.2.2. SRC Analysis
13.3. Latin America Tantalum Pentoxide Powder Market, by Country, 2017-2030 (US$ Bn)
13.3.1. Latin America Tantalum Pentoxide Powder Market, by Country, 2022 Vs 2030 (in%)
13.3.2. Brazil
13.3.2.1. Brazil Tantalum Pentoxide Powder Market Estimates and Forecast, 2017-2030 (US$ Bn)
13.3.2.2. Brazil Tantalum Pentoxide Powder, By Type, 2017-2030 (US$ Bn)
13.3.2.3. Brazil Tantalum Pentoxide Powder, By Application, 2017-2030 (US$ Bn)
13.3.3. Argentina
13.3.3.1. Argentina Tantalum Pentoxide Powder Market Estimates and Forecast, 2017-2030 (US$ Bn)
13.3.3.2. Argentina Tantalum Pentoxide Powder, By Type, 2017-2030 (US$ Bn)
13.3.3.3. Argentina Tantalum Pentoxide Powder, By Application, 2017-2030 (US$ Bn)
13.3.4. Rest of Latin America
13.3.4.1. Rest of Latin America Tantalum Pentoxide Powder Market Estimates and Forecast, 2017-2030 (US$ Bn)
13.3.4.2. Rest of Latin America Tantalum Pentoxide Powder, By Type, 2017-2030 (US$ Bn)
13.3.4.3. Rest of Latin America Tantalum Pentoxide Powder, By Application, 2017-2030 (US$ Bn)

14. Middle East and Africa Tantalum Pentoxide Powder Market Analysis
14.1. Middle East and Africa Tantalum Pentoxide Powder Market, by Type, 2017-2030(US$ Bn)
14.1.1. Overview
14.1.2. SRC Analysis
14.2. Middle East and Africa Tantalum Pentoxide Powder Market, by Application, 2017-2030(US$ Bn)
14.2.1. Overview
14.2.2. SRC Analysis
14.3. Middle East and Africa Tantalum Pentoxide Powder Market, by Country, 2017-2030 (US$ Bn)
14.3.1. Middle East and Africa Tantalum Pentoxide Powder Market, by Country, 2022 Vs 2030 (in%)
14.3.2. GCC Countries
14.3.2.1. GCC Countries Tantalum Pentoxide Powder Market Estimates and Forecast, 2017-2030 (US$ Bn)
14.3.2.2. GCC Countries Tantalum Pentoxide Powder, By Type, 2017-2030 (US$ Bn)
14.3.2.3. GCC Countries Tantalum Pentoxide Powder, By Application, 2017-2030 (US$ Bn)
14.3.3. South Africa
14.3.3.1. South Africa Tantalum Pentoxide Powder Market Estimates and Forecast, 2017-2030 (US$ Bn)
14.3.3.2. South Africa Tantalum Pentoxide Powder, By Type, 2017-2030 (US$ Bn)
14.3.3.3. South Africa Tantalum Pentoxide Powder, By Application, 2017-2030 (US$ Bn)
14.3.4. Rest of Middle East and Africa
14.3.4.1. Rest of Middle East and Africa Tantalum Pentoxide Powder Market Estimates and Forecast, 2017-2030 (US$ Bn)
14.3.4.2. Rest of Middle East and Africa Tantalum Pentoxide Powder, By Type, 2017-2030 (US$ Bn)
14.3.4.3. Rest of Middle East and Africa Tantalum Pentoxide Powder, By Application, 2017-2030 (US$ Bn)

15. Company Profiles
15.1. Global Advanced Metals
15.1.1. Company Overview
15.1.2. Product /Services Portfolio
15.1.3. Geographical Presence
15.1.4. Financial Summary
15.1.4.1. Market Revenue and Net Profit (2019-2022)
15.1.4.2. Business Segment Revenue Analysis
15.1.4.3. Geographical Revenue Analysis
15.2. AMG
15.3. Materion
15.4. Taniobis (JX Nippon Mining and Metals)
15.5. Mitsui Kinzoku
15.6. Taki Chemical
15.7. MPIL
15.8. Solikamsk Magnesium Works
15.9. Ningxia Orient Tantalum
15.10. Jiujiang Tanbre
15.11. KING-TAN Tantalum
15.12. FandX Electro-Materials
15.13. Ximei Group

List of Figures
FIG. 1 Global Tantalum Pentoxide Powder Market: Research Methodology
FIG. 2 Market Size Estimation – Top Down & Bottom up Approach
FIG. 3 Global Tantalum Pentoxide Powder Market Segmentation
FIG. 4 Global Tantalum Pentoxide Powder Market, by Type, 2022 (US$ Bn)
FIG. 5 Global Tantalum Pentoxide Powder Market, by Application, 2022 (US$ Bn)
FIG. 6 Global Tantalum Pentoxide Powder Market, by Geography, 2022 (US$ Bn)
FIG. 7 Attractive Investment Proposition, by Type, 2022
FIG. 8 Attractive Investment Proposition, by Application, 2022
FIG. 9 Attractive Investment Proposition, by Geography, 2022
FIG. 10 Global Market Share Analysis of Key Tantalum Pentoxide Powder Market Manufacturers, 2022
FIG. 11 Global Market Positioning of Key Tantalum Pentoxide Powder Market Manufacturers, 2022
FIG. 12 Global Tantalum Pentoxide Powder Market Value Contribution, By Type, 2022 & 2030 (Value %)
FIG. 13 Global Tantalum Pentoxide Powder Market, by Electronic Ceramics, Value, 2017-2030 (US$ Bn)
FIG. 14 Global Tantalum Pentoxide Powder Market, by Single Crystal, Value, 2017-2030 (US$ Bn)
FIG. 15 Global Tantalum Pentoxide Powder Market, by Optical Lens, Value, 2017-2030 (US$ Bn)
FIG. 16 Global Tantalum Pentoxide Powder Market Value Contribution, By Application, 2022 & 2030 (Value %)
FIG. 17 Global Tantalum Pentoxide Powder Market, by Application A, Value, 2017-2030 (US$ Bn)
FIG. 18 Global Tantalum Pentoxide Powder Market, by Application B, 2017-2030 (US$ Bn)
FIG. 19 Global Tantalum Pentoxide Powder Market, by Other, 2017-2030 (US$ Bn)
FIG. 20 North America Tantalum Pentoxide Powder Market, 2017-2030 (US$ Bn)
FIG. 21 U.S. Tantalum Pentoxide Powder Market, 2017-2030 (US$ Bn)
FIG. 22 Canada Tantalum Pentoxide Powder Market, 2017-2030 (US$ Bn)
FIG. 23 Europe Tantalum Pentoxide Powder Market, 2017-2030 (US$ Bn)
FIG. 24 Germany Tantalum Pentoxide Powder Market, 2017-2030 (US$ Bn)
FIG. 25 France Tantalum Pentoxide Powder Market, 2017-2030 (US$ Bn)
FIG. 26 U.K. Tantalum Pentoxide Powder Market, 2017-2030 (US$ Bn)
FIG. 27 Italy Tantalum Pentoxide Powder Market, 2017-2030 (US$ Bn)
FIG. 28 Spain Tantalum Pentoxide Powder Market, 2017-2030 (US$ Bn)
FIG. 29 Rest of Europe Tantalum Pentoxide Powder Market, 2017-2030 (US$ Bn)
FIG. 30 Asia Pacific Tantalum Pentoxide Powder Market, 2017-2030 (US$ Bn)
FIG. 31 China Tantalum Pentoxide Powder Market, 2017-2030 (US$ Bn)
FIG. 32 Japan Tantalum Pentoxide Powder Market, 2017-2030 (US$ Bn)
FIG. 33 India Tantalum Pentoxide Powder Market, 2017-2030 (US$ Bn)
FIG. 34 South Korea Tantalum Pentoxide Powder Market, 2017-2030 (US$ Bn)
FIG. 35 South-East Asia Tantalum Pentoxide Powder Market, 2017-2030 (US$ Bn)
FIG. 36 Rest of Asia Pacific Tantalum Pentoxide Powder Market, 2017-2030 (US$ Bn)
FIG. 37 Latin America Tantalum Pentoxide Powder Market, 2017-2030 (US$ Bn)
FIG. 38 Brazil Tantalum Pentoxide Powder Market, 2017-2030 (US$ Bn)
FIG. 39 Mexico Tantalum Pentoxide Powder Market, 2017-2030 (US$ Bn)
FIG. 40 Rest of Latin America Tantalum Pentoxide Powder Market, 2017-2030 (US$ Bn)
FIG. 41 Middle East & Africa Tantalum Pentoxide Powder Market, 2017-2030 (US$ Bn)
FIG. 42 GCC Countries Tantalum Pentoxide Powder Market, 2017-2030 (US$ Bn)
FIG. 43 South Africa Tantalum Pentoxide Powder Market, 2017-2030 (US$ Bn)
FIG. 44 Rest of Middle East and Africa Tantalum Pentoxide Powder Market, 2017-2030 (US$ Bn)

List of Tables
TABLE 1 Market Snapshot: Global Tantalum Pentoxide Powder Market
TABLE 2 Global Tantalum Pentoxide Powder Market: Market Drivers Impact Analysis
TABLE 3 Global Tantalum Pentoxide Powder Market: Market Restraints Impact Analysis
TABLE 4 Global Tantalum Pentoxide Powder Market, by Competitive Benchmarking, 2022
TABLE 5 Global Tantalum Pentoxide Powder Market, by Geographical Presence Analysis, 2022
TABLE 6 Global Tantalum Pentoxide Powder Market, by Key Strategies Analysis, 2022
TABLE 7 Global Tantalum Pentoxide Powder Market, by Electronic Ceramics, By Region, 2017-2022 (US$ Bn)
TABLE 8 Global Tantalum Pentoxide Powder Market, by Electronic Ceramics, By Region, 2023-2030 (US$ Bn)
TABLE 9 Global Tantalum Pentoxide Powder Market, by Single Crystal, By Region, 2017-2022 (US$ Bn)
TABLE 10 Global Tantalum Pentoxide Powder Market, by Single Crystal, By Region, 2023-2030 (US$ Bn)
TABLE 11 Global Tantalum Pentoxide Powder Market, by Optical Lens, By Region, 2017-2022 (US$ Bn)
TABLE 12 Global Tantalum Pentoxide Powder Market, by Optical Lens, By Region, 2023-2030 (US$ Bn)
TABLE 13 Global Tantalum Pentoxide Powder Market, by Application A, By Region, 2017-2022 (US$ Bn)
TABLE 14 Global Tantalum Pentoxide Powder Market, by Application A, By Region, 2023-2030 (US$ Bn)
TABLE 15 Global Tantalum Pentoxide Powder Market, by Application B, By Region, 2017-2022 (US$ Bn)
TABLE 16 Global Tantalum Pentoxide Powder Market, by Application B, By Region, 2023-2030 (US$ Bn)
TABLE 17 Global Tantalum Pentoxide Powder Market, by Other, By Region, 2017-2022 (US$ Bn)
TABLE 18 Global Tantalum Pentoxide Powder Market, by Other, By Region, 2023-2030 (US$ Bn)
TABLE 19 Global Tantalum Pentoxide Powder Market, by Type, 2017-2022 (US$ Bn)
TABLE 20 Global Tantalum Pentoxide Powder Market, by Type, 2023-2030 (US$ Bn)
TABLE 21 Global Tantalum Pentoxide Powder Market, by Application, 2017-2022 (US$ Bn)
TABLE 22 Global Tantalum Pentoxide Powder Market, by Application, 2023-2030 (US$ Bn)
TABLE 23 Global Tantalum Pentoxide Powder Market, by Region, 2017-2022 (US$ Bn)
TABLE 24 Global Tantalum Pentoxide Powder Market, by Region, 2023-2030 (US$ Bn)
TABLE 25 North America Tantalum Pentoxide Powder Market, by Type, 2017-2022 (US$ Bn)
TABLE 26 North America Tantalum Pentoxide Powder Market, by Type, 2023-2030 (US$ Bn)
TABLE 27 North America Tantalum Pentoxide Powder Market, by Application, 2017-2022 (US$ Bn)
TABLE 28 North America Tantalum Pentoxide Powder Market, by Application, 2023-2030 (US$ Bn)
TABLE 29 North America Tantalum Pentoxide Powder Market, by Country, 2017-2022 (US$ Bn)
TABLE 30 North America Tantalum Pentoxide Powder Market, by Country, 2023-2030 (US$ Bn)
TABLE 31 United States Tantalum Pentoxide Powder Market, by Type, 2017-2022 (US$ Bn)
TABLE 32 United States Tantalum Pentoxide Powder Market, by Type, 2023-2030 (US$ Bn)
TABLE 33 United States Tantalum Pentoxide Powder Market, by Application, 2017-2022 (US$ Bn)
TABLE 34 United States Tantalum Pentoxide Powder Market, by Application, 2023-2030 (US$ Bn)
TABLE 35 Canada Tantalum Pentoxide Powder Market, by Type, 2017-2022 (US$ Bn)
TABLE 36 Canada Tantalum Pentoxide Powder Market, by Type, 2023-2030 (US$ Bn)
TABLE 37 Canada Tantalum Pentoxide Powder Market, by Application, 2017-2022 (US$ Bn)
TABLE 38 Canada Tantalum Pentoxide Powder Market, by Application, 2023-2030 (US$ Bn)
TABLE 39 Mexico Tantalum Pentoxide Powder Market, by Type, 2017-2022 (US$ Bn)
TABLE 40 Mexico Tantalum Pentoxide Powder Market, by Type, 2023-2030 (US$ Bn)
TABLE 41 Mexico Tantalum Pentoxide Powder Market, by Application, 2017-2022 (US$ Bn)
TABLE 42 Mexico Tantalum Pentoxide Powder Market, by Application, 2023-2030 (US$ Bn)
TABLE 43 Europe Tantalum Pentoxide Powder Market, by Type, 2017-2022 (US$ Bn)
TABLE 44 Europe Tantalum Pentoxide Powder Market, by Type, 2023-2030 (US$ Bn)
TABLE 45 Europe Tantalum Pentoxide Powder Market, by Application, 2017-2022 (US$ Bn)
TABLE 46 Europe Tantalum Pentoxide Powder Market, by Application, 2023-2030 (US$ Bn)
TABLE 47 Europe Tantalum Pentoxide Powder Market, by Country, 2017-2022 (US$ Bn)
TABLE 48 Europe Tantalum Pentoxide Powder Market, by Country, 2023-2030 (US$ Bn)
TABLE 49 Germany Tantalum Pentoxide Powder Market, by Type, 2017-2022 (US$ Bn)
TABLE 50 Germany Tantalum Pentoxide Powder Market, by Type, 2023-2030 (US$ Bn)
TABLE 51 Germany Tantalum Pentoxide Powder Market, by Application, 2017-2022 (US$ Bn)
TABLE 52 Germany Tantalum Pentoxide Powder Market, by Application, 2023-2030 (US$ Bn)
TABLE 53 France Tantalum Pentoxide Powder Market, by Type, 2017-2022 (US$ Bn)
TABLE 54 France Tantalum Pentoxide Powder Market, by Type, 2023-2030 (US$ Bn)
TABLE 55 France Tantalum Pentoxide Powder Market, by Application, 2017-2022 (US$ Bn)
TABLE 56 France Tantalum Pentoxide Powder Market, by Application, 2023-2030 (US$ Bn)
TABLE 57 United Kingdom Tantalum Pentoxide Powder Market, by Type, 2017-2022 (US$ Bn)
TABLE 58 United Kingdom Tantalum Pentoxide Powder Market, by Type, 2023-2030 (US$ Bn)
TABLE 59 United Kingdom Tantalum Pentoxide Powder Market, by Application, 2017-2022 (US$ Bn)
TABLE 60 United Kingdom Tantalum Pentoxide Powder Market, by Application, 2023-2030 (US$ Bn)
TABLE 61 Italy Tantalum Pentoxide Powder Market, by Type, 2017-2022 (US$ Bn)
TABLE 62 Italy Tantalum Pentoxide Powder Market, by Type, 2023-2030 (US$ Bn)
TABLE 63 Italy Tantalum Pentoxide Powder Market, by Application, 2017-2022 (US$ Bn)
TABLE 64 Italy Tantalum Pentoxide Powder Market, by Application, 2023-2030 (US$ Bn)
TABLE 65 Spain Tantalum Pentoxide Powder Market, by Type, 2017-2022 (US$ Bn)
TABLE 66 Spain Tantalum Pentoxide Powder Market, by Type, 2023-2030 (US$ Bn)
TABLE 67 Spain Tantalum Pentoxide Powder Market, by Application, 2017-2022 (US$ Bn)
TABLE 68 Spain Tantalum Pentoxide Powder Market, by Application, 2023-2030 (US$ Bn)
TABLE 69 Rest of Europe Tantalum Pentoxide Powder Market, by Type, 2017-2022 (US$ Bn)
TABLE 70 Rest of Europe Tantalum Pentoxide Powder Market, by Type, 2023-2030 (US$ Bn)
TABLE 71 Rest of Europe Tantalum Pentoxide Powder Market, by Application, 2017-2022 (US$ Bn)
TABLE 72 Rest of Europe Tantalum Pentoxide Powder Market, by Application, 2023-2030 (US$ Bn)
TABLE 73 Asia Pacific Tantalum Pentoxide Powder Market, by Type, 2017-2022 (US$ Bn)
TABLE 74 Asia Pacific Tantalum Pentoxide Powder Market, by Type, 2023-2030 (US$ Bn)
TABLE 75 Asia Pacific Tantalum Pentoxide Powder Market, by Application, 2017-2022 (US$ Bn)
TABLE 76 Asia Pacific Tantalum Pentoxide Powder Market, by Application, 2023-2030 (US$ Bn)
TABLE 77 Asia Pacific Tantalum Pentoxide Powder Market, by Country, 2017-2022 (US$ Bn)
TABLE 78 Asia Pacific Tantalum Pentoxide Powder Market, by Country, 2023-2030 (US$ Bn)
TABLE 79 China Tantalum Pentoxide Powder Market, by Type, 2017-2022 (US$ Bn)
TABLE 80 China Tantalum Pentoxide Powder Market, by Type, 2023-2030 (US$ Bn)
TABLE 81 China Tantalum Pentoxide Powder Market, by Application, 2017-2022 (US$ Bn)
TABLE 82 China Tantalum Pentoxide Powder Market, by Application, 2023-2030 (US$ Bn)
TABLE 83 Japan Tantalum Pentoxide Powder Market, by Type, 2017-2022 (US$ Bn)
TABLE 84 Japan Tantalum Pentoxide Powder Market, by Type, 2023-2030 (US$ Bn)
TABLE 85 Japan Tantalum Pentoxide Powder Market, by Application, 2017-2022 (US$ Bn)
TABLE 86 Japan Tantalum Pentoxide Powder Market, by Application, 2023-2030 (US$ Bn)
TABLE 87 India Tantalum Pentoxide Powder Market, by Type, 2017-2022 (US$ Bn)
TABLE 88 India Tantalum Pentoxide Powder Market, by Type, 2023-2030 (US$ Bn)
TABLE 89 India Tantalum Pentoxide Powder Market, by Application, 2017-2022 (US$ Bn)
TABLE 90 India Tantalum Pentoxide Powder Market, by Application, 2023-2030 (US$ Bn)
TABLE 91 South Korea Tantalum Pentoxide Powder Market, by Type, 2017-2022 (US$ Bn)
TABLE 92 South Korea Tantalum Pentoxide Powder Market, by Type, 2023-2030 (US$ Bn)
TABLE 93 South Korea Tantalum Pentoxide Powder Market, by Application, 2017-2022 (US$ Bn)
TABLE 94 South Korea Tantalum Pentoxide Powder Market, by Application, 2023-2030 (US$ Bn)
TABLE 95 South-East Asia Tantalum Pentoxide Powder Market, by Type, 2017-2022 (US$ Bn)
TABLE 96 South-East Asia Tantalum Pentoxide Powder Market, by Type, 2023-2030 (US$ Bn)
TABLE 97 South-East Asia Tantalum Pentoxide Powder Market, by Application, 2017-2022 (US$ Bn)
TABLE 98 South-East Asia Tantalum Pentoxide Powder Market, by Application, 2023-2030 (US$ Bn)
TABLE 99 Rest of Asia Pacific Tantalum Pentoxide Powder Market, by Type, 2017-2022 (US$ Bn)
TABLE 100 Rest of Asia Pacific Tantalum Pentoxide Powder Market, by Type, 2023-2030 (US$ Bn)
TABLE 101 Rest of Asia Pacific Tantalum Pentoxide Powder Market, by Application, 2017-2022 (US$ Bn)
TABLE 102 Rest of Asia Pacific Tantalum Pentoxide Powder Market, by Application, 2023-2030 (US$ Bn)
TABLE 103 Latin America Tantalum Pentoxide Powder Market, by Type, 2017-2022 (US$ Bn)
TABLE 104 Latin America Tantalum Pentoxide Powder Market, by Type, 2023-2030 (US$ Bn)
TABLE 105 Latin America Tantalum Pentoxide Powder Market, by Application, 2017-2022 (US$ Bn)
TABLE 106 Latin America Tantalum Pentoxide Powder Market, by Application, 2023-2030 (US$ Bn)
TABLE 107 Latin America Tantalum Pentoxide Powder Market, by Country, 2017-2022 (US$ Bn)
TABLE 108 Latin America Tantalum Pentoxide Powder Market, by Country, 2023-2030 (US$ Bn)
TABLE 109 Brazil Tantalum Pentoxide Powder Market, by Type, 2017-2022 (US$ Bn)
TABLE 110 Brazil Tantalum Pentoxide Powder Market, by Type, 2023-2030 (US$ Bn)
TABLE 111 Brazil Tantalum Pentoxide Powder Market, by Application, 2017-2022 (US$ Bn)
TABLE 112 Brazil Tantalum Pentoxide Powder Market, by Application, 2023-2030 (US$ Bn)
TABLE 113 Argentina Tantalum Pentoxide Powder Market, by Type, 2017-2022 (US$ Bn)
TABLE 114 Argentina Tantalum Pentoxide Powder Market, by Type, 2023-2030 (US$ Bn)
TABLE 115 Argentina Tantalum Pentoxide Powder Market, by Application, 2017-2022 (US$ Bn)
TABLE 116 Argentina Tantalum Pentoxide Powder Market, by Application, 2023-2030 (US$ Bn)
TABLE 117 Rest of Latin America Tantalum Pentoxide Powder Market, by Type, 2017-2022 (US$ Bn)
TABLE 118 Rest of Latin America Tantalum Pentoxide Powder Market, by Type, 2023-2030 (US$ Bn)
TABLE 119 Rest of Latin America Tantalum Pentoxide Powder Market, by Application, 2017-2022 (US$ Bn)
TABLE 120 Rest of Latin America Tantalum Pentoxide Powder Market, by Application, 2023-2030 (US$ Bn)
TABLE 121 Middle East and Africa Tantalum Pentoxide Powder Market, by Type, 2017-2022 (US$ Bn)
TABLE 122 Middle East and Africa Tantalum Pentoxide Powder Market, by Type, 2023-2030 (US$ Bn)
TABLE 123 Middle East and Africa Tantalum Pentoxide Powder Market, by Application, 2017-2022 (US$ Bn)
TABLE 124 Middle East and Africa Tantalum Pentoxide Powder Market, by Application, 2023-2030 (US$ Bn)
TABLE 125 Middle East and Africa Tantalum Pentoxide Powder Market, by Country, 2017-2022 (US$ Bn)
TABLE 126 Middle East and Africa Tantalum Pentoxide Powder Market, by Country, 2023-2030 (US$ Bn)
TABLE 127 GCC Countries Tantalum Pentoxide Powder Market, by Type, 2017-2022 (US$ Bn)
TABLE 128 GCC Countries Tantalum Pentoxide Powder Market, by Type, 2023-2030 (US$ Bn)
TABLE 129 GCC Countries Tantalum Pentoxide Powder Market, by Application, 2017-2022 (US$ Bn)
TABLE 130 GCC Countries Tantalum Pentoxide Powder Market, by Application, 2023-2030 (US$ Bn)
TABLE 131 South Africa Tantalum Pentoxide Powder Market, by Type, 2017-2022 (US$ Bn)
TABLE 132 South Africa Tantalum Pentoxide Powder Market, by Type, 2023-2030 (US$ Bn)
TABLE 133 South Africa Tantalum Pentoxide Powder Market, by Application, 2017-2022 (US$ Bn)
TABLE 134 South Africa Tantalum Pentoxide Powder Market, by Application, 2023-2030 (US$ Bn)
TABLE 135 Rest of Middle East and Africa Tantalum Pentoxide Powder Market, by Type, 2017-2022 (US$ Bn)
TABLE 136 Rest of Middle East and Africa Tantalum Pentoxide Powder Market, by Type, 2023-2030 (US$ Bn)
TABLE 137 Rest of Middle East and Africa Tantalum Pentoxide Powder Market, by Application, 2017-2022 (US$ Bn)
TABLE 138 Rest of Middle East and Africa Tantalum Pentoxide Powder Market, by Application, 2023-2030 (US$ Bn)

Request Free Sample

Ready to Transform Data into Decisions?

Request Your Sample Report and Start Your Journey of Informed Choices


Providing the strategic compass for industry titans.

cr-clients-logos

Frequently Asked Questions

What is the current size of the global tantalum pentoxide powder market?

The global Tantalum pentoxide powder market was valued at USD 0.39 Billion in 2022.

What is the expected growth rate of the Tantalum pentoxide powder market between 2023 and 2030?

The Tantalum pentoxide powder market is expected to grow at a CAGR of 6.50% between 2023 and 2030, reaching USD 0.606054753 Billion in 2030.

Which type segment is leading the market share in terms of product type?

Electronic Ceramics is the leading segment by type, holding around three-fifth of the share in value in 2022.

Which Application governs the demand for Tantalum pentoxide powders in the world?

The Application A govern the demand for Tantalum pentoxide powders worldwide, holding a massive share of nearly 25% in 2022.

Which segment is expected to post the highest CAGR during the forecast period?

Single Crystal segment is expected to post the highest CAGR during the forecast period.

Which region is fueling the growth of the Tantalum pentoxide powder industry?

Asia-pacific is fueling the growth of the Tantalum pentoxide powder industry, with nearly two-fifth share in 2022.

Who are the major players in the global Tantalum pentoxide powder market?

The top players include Global Advanced Metals, AMG, Materion, Taniobis (JX Nippon Mining and Metals), Mitsui Kinzoku, Taki Chemical and others.

What is the major market driver of the tantalum pentoxide powder industry?

The rising demand in electronics devices manufacturing such as smartphones, tablets, laptops, and automotive electronics & growing need for clean and efficient energy sources are the major market drivers.

What are the major market restraints of the tantalum pentoxide powder industry?

Disruptions in the supply chain affecting the availability and pricing of tantalum pentoxide powder & volatility in price due to its limited availability and the global supply-demand dynamics restraints of the tantalum pentoxide powder industry.

What are the major market opportunities of the tantalum pentoxide powder industry?

Continuous advancements in technology create new opportunities for the utilization of tantalum pentoxide powder & transition towards renewable energy sources, such as wind and solar power, are opportunities for the tantalum pentoxide powder industry.

About Author

Ganesh Chandwade

Ganesh Chandwade

Senior Industry Consultant

Ganesh is a senior industry consultant specializing in heavy industries and advanced materials.

View Profile

Related Reports

Vitiligo Treatment Market

Vitiligo Treatment Market size was valued at USD 393.4 million in 2018 to USD 495.4 million in 2024 and is anticipated to reach USD 692.7 million by 2032, at a CAGR of 4.31% during the forecast period.

Mechanical Electrical and Plumbing Services Market

The Mechanical, Electrical, and Plumbing (MEP) Services Market is valued at USD 1,080.63 million and is projected to grow at a CAGR of 7.95% over the forecast period, reaching approximately USD 1,931.5 million by 2032.

Machine Vision Market

The Machine vision market is projected to grow from USD 20.3 billion in 2024 to an estimated USD 52.5 billion by 2032, registering a compound annual growth rate (CAGR) of 12.6% during the forecast period.

Green Solvents in Electronics Market

Green Solvents in Electronics Market size was valued at USD 261.8million in 2018 to USD 406.5 million in 2024 and is anticipated to reach USD 817.4 million by 2032, at a CAGR of 9.25% during the forecast period.

Water Manufacturing Equipment Market

Water Manufacturing Equipment Market size was valued at USD 73.84 billion in 2024 and is anticipated to reach USD 113.32 billion by 2032, at a CAGR of 5.5% during the forecast period.

Waste Heat Recovery System Market

Waste Heat Recovery System Market size was valued at USD 75.56 billion in 2024 and is anticipated to reach USD 126.94 billion by 2032, at a CAGR of 6.7% during the forecast period.

Shallow Depth Surf Market

Shallow Depth Surf Market size was valued at USD 2971.4 million in 2024 and is anticipated to reach USD 4844.2 million by 2032, at a CAGR of 6.3% during the forecast period.

Shape Memory Alloys Market

Shape Memory Alloys Market size was valued at USD 15510 million in 2024 and is anticipated to reach USD 36053.7 million by 2032, at a CAGR of 11.12% during the forecast period.

Semiconductor Plant Construction Market

Semiconductor Plant Construction Market size was valued at USD 43.8 billion in 2024 and is anticipated to reach USD 102.92 billion by 2032, at a CAGR of 11.27% during the forecast period.

Licence Option

The report comes as a view-only PDF document, optimized for individual clients. This version is recommended for personal digital use and does not allow printing. Use restricted to one purchaser only.
$4999

To meet the needs of modern corporate teams, our report comes in two formats: a printable PDF and a data-rich Excel sheet. This package is optimized for internal analysis. Unlimited users allowed within one corporate location (e.g., regional office).
$6999

The report will be delivered in printable PDF format along with the report’s data Excel sheet. This license offers 100 Free Analyst hours where the client can utilize Credence Research Inc. research team. Permitted for unlimited global use by all users within the purchasing corporation, such as all employees of a single company.
$12999

Credence Staff 3

WILLIAM, North America

Support Staff at Credence Research

KEITH PHILLIPS, Europe

Lee - CR Sales Staff

LEE VALLANCE, Asia Pacific

Kieran Jameson

KIERAN JAMESON, Australia

Report delivery within 24 to 48 hours

User Review

Thank you for the data! The numbers are exactly what we asked for and what we need to build our business case.

Materials Scientist
(privacy requested)

User Review

The report was an excellent overview of the Industrial Burners market. This report does a great job of breaking everything down into manageable chunks.

Imre Hof
Management Assistant, Bekaert

cr-clients-logos

Request Sample