Market Overview
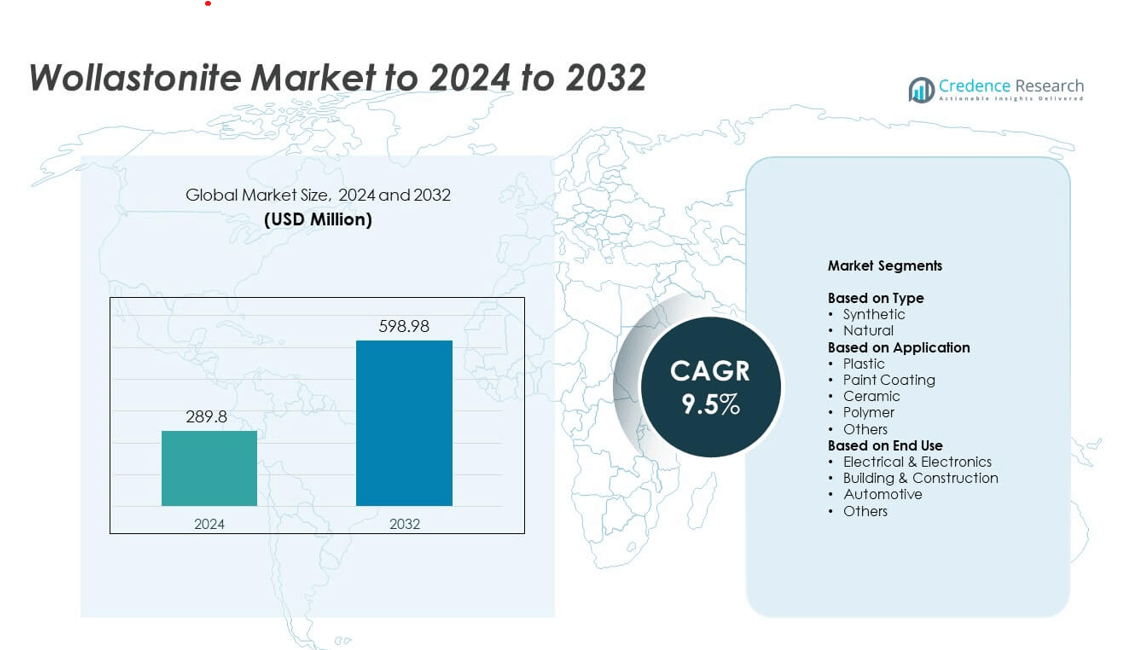
Wollastonite Market size was valued at USD 289.8 million in 2024 and is anticipated to reach USD 598.98 million by 2032, at a CAGR of 9.5% during the forecast period.
| REPORT ATTRIBUTE |
DETAILS |
| Historical Period |
2020-2023 |
| Base Year |
2024 |
| Forecast Period |
2025-2032 |
| Wollastonite Market Size 2024 |
USD 289.8 million |
| Wollastonite Market, CAGR |
9.5% |
| Wollastonite Market Size 2032 |
USD 598.98 million |
The Wollastonite Market features key players such as Canadian Wollastonite, Xinyu South Wollastonite Co Ltd, ACBM JSC Imerys S.A, R.T. Vanderbilt Holding Company Inc, Wolkem, Lishu Dadingshan Wollastonite Co. Ltd, Nordkalk Corporation, Omya, and Imerys, each competing through high-purity grades, stable supply, and advanced processing capabilities. North America leads the global market with about 34% share in 2024 due to strong demand from construction and polymer reinforcement applications. Europe follows with nearly 28% share, supported by automotive lightweighting and high-performance coatings, while Asia Pacific holds about 30% share driven by rapid industrialization, robust ceramic production, and expanding plastics manufacturing.
Market Insights
- The Wollastonite Market was valued at USD 289.8 million in 2024 and is projected to reach USD 598.98 million by 2032, growing at a CAGR of 9.5%.
• Demand rises due to strong use of natural wollastonite, holding about 87% share, driven by its role in polymer reinforcement, construction materials, and coatings.
• Key trends include higher adoption in lightweight automotive parts and increased use in durable coatings to improve scratch resistance and stability.
• Competition remains moderate as major producers expand processing capacity and focus on high-purity grades to meet industry performance needs.
• North America leads with 34% share, followed by Europe at 28% and Asia Pacific at 30%, while the plastic application segment dominates with nearly 42% share.
Access crucial information at unmatched prices!
Request your sample report today & start making informed decisions powered by Credence Research Inc.!
Download Sample
Market Segmentation Analysis:
By Type
Natural wollastonite dominates this segment with about 87% share in 2024 due to its wider availability, lower production cost, and strong suitability for industrial fillers. Manufacturers prefer natural grades because they offer consistent acicular morphology, high whiteness, and low impurity levels that improve product performance in plastics, ceramics, and coatings. Synthetic wollastonite grows at a slower pace because it requires energy-intensive processing, yet demand continues in applications needing controlled purity and customized particle structure. Broader use of natural wollastonite in construction and polymer reinforcement keeps this category leading global consumption.
- For instance, Xinyu South Wollastonite Co., Ltd. reports total in-situ wollastonite storage of over 25 million tons and an annual processing capacity of about 250,000 tons, underlining the scale and cost advantage of natural wollastonite supply.
By Application
Plastic applications lead this segment with nearly 42% share in 2024 driven by strong adoption in polypropylene and engineering polymers for enhanced strength, dimensional stability, and heat resistance. Producers rely on wollastonite to reduce warpage, improve mechanical performance, and replace higher-cost reinforcement materials. Paint coatings expand steadily as wollastonite boosts corrosion resistance and improves film durability, while ceramics maintain stable demand for fluxing and strength-enhancing functions. Wider use of plastic components in automotive and electronics production keeps plastic applications dominant across end markets.
- For instance, Global sales of wollastonite were estimated to be between 800,000 and 1,000,000 tons in 2023, with global production estimated at 830,000 tons.
By End Use
Building and construction dominate this segment with about 44% share in 2024 due to extensive use of wollastonite in cement boards, tiles, insulation materials, and polymer-modified construction products. Users select wollastonite because it enhances fire resistance, mechanical strength, and durability in structural and interior applications. Automotive demand rises as OEMs shift toward lightweight polymer parts reinforced with wollastonite, while electrical and electronics expand usage in heat-resistant components. Rapid urban development and rising infrastructure investment continue to support the leadership of the construction segment worldwide.
Key Growth Drivers
Rising Demand for Polymer Reinforcement
Demand for wollastonite rises as manufacturers seek stronger and more dimensionally stable polymer compounds. The mineral enhances tensile strength, improves heat resistance, and lowers shrinkage, making polypropylene and engineering plastics more durable for automotive and electrical components. Its acicular structure offers a cost-effective alternative to fiberglass, supporting lightweight product design. The shift toward advanced material performance keeps polymer reinforcement a primary growth driver in global markets.
- For instance, HPF Minerals specifies that its wollastonite products have a Mohs hardness of about 4.5, a density near 2.85 g/cm³, a linear thermal expansion of around 7×10⁻⁶ per Kelvin, and aspect ratios of roughly 3:1 for TREMIN 283 and 8:1 for TREMIN 939, properties used to boost stiffness and dimensional stability in reinforced plastics.
Expansion in Construction and Infrastructure
The construction sector drives strong demand because wollastonite improves fire resistance, mechanical stability, and durability in cement boards, tiles, coatings, and insulation materials. Growth in residential and commercial projects boosts the need for modified cement products and high-strength composites. Its consistent performance and compatibility with modern building materials support widescale adoption. Continued infrastructure development across emerging economies keeps the construction segment a major growth driver.
- For instance, Senbaoli Chemical reports that China’s total coating output reached 35.77 million tons in 2023, supporting heavy demand for functional fillers such as wollastonite in architectural and infrastructure coatings.
Growing Use in Automotive Lightweighting
Automakers use wollastonite-reinforced plastics to reduce vehicle weight while maintaining structural strength. The mineral supports better heat stability and dimensional control in under-the-hood components, replacing heavier metal parts. Regulatory pressure for lower emissions strengthens the demand for lightweight materials. Its compatibility with polypropylene compounds ensures broad use in interior and exterior automotive applications, positioning automotive lightweighting as a key driver.
Key Trends and Opportunities
Shift Toward Sustainable and Low-Carbon Materials
Growing interest in sustainable materials increases wollastonite adoption because the mineral provides a low-emission alternative to synthetic fillers. Manufacturers promote natural wollastonite for its low environmental footprint and long lifecycle benefits. Its ability to reduce polymer usage while improving product durability aligns with global sustainability goals. This trend opens new opportunities in green construction and eco-friendly packaging.
- For instance, Canadian Wollastonite’s agreement with UNDO Carbon covers the supply of 450,000 tonnes of wollastonite over three years.
Rising Integration in High-Performance Coatings
Wollastonite gains traction in advanced coatings due to its ability to enhance scratch resistance, corrosion protection, and film stability. Paint producers use it to improve mechanical strength and extend coating life across industrial and architectural applications. Demand increases in infrastructure, marine coatings, and protective paints. Expanding use of durable coating systems creates favorable growth opportunities for wollastonite suppliers.
- For instance, Quarzwerke’s TREMIN® 283-600 EST wollastonite is a surface-treated grade used in epoxy and other protective coatings where it acts as a functional filler to enhance physical properties and improve corrosion resistance.
Key Challenges
Volatility in Mining and Raw Material Quality
Inconsistent ore quality and limited accessibility in some regions create supply-chain pressure. Variations in mineral purity affect performance in polymers and coatings, increasing the need for additional processing and quality control. Regulatory limits on mining activities also slow production. These factors make raw material stability a significant challenge for producers and end-users.
Competition from Substitute Fillers
Fillers such as talc, kaolin, fiberglass, and calcium carbonate compete directly with wollastonite in plastics, coatings, and construction products. Many alternatives offer lower cost or higher availability, influencing material selection for large-volume applications. Increased adoption of engineered fillers can reduce wollastonite demand in key industries. This competitive pressure remains a major challenge for market expansion.
Regional Analysis
North America
North America leads the wollastonite market with about 34% share in 2024, supported by strong demand from construction, plastics, and automotive industries. The region benefits from established mining operations, consistent product quality, and advanced manufacturing standards. Growth in polymer reinforcement for automotive lightweighting strengthens market presence, while rising adoption of high-performance coatings adds further momentum. Increased investments in infrastructure renovation and sustainable material use sustain regional expansion. The United States remains the primary consumer due to its large industrial base and advanced composite materials sector.
Europe
Europe holds nearly 28% share in the wollastonite market in 2024, driven by strong demand for engineered plastics, ceramic components, and high-performance coatings. Strict regulations promoting lightweight automotive materials and environmentally sustainable fillers encourage wider adoption. The region’s construction sector uses wollastonite for fire-resistant boards, insulation, and tile reinforcement. Countries such as Germany, Italy, and Spain remain major consumption centers because of their strong ceramics and coatings industries. Expanding interest in eco-friendly industrial materials continues to support Europe’s solid positioning.
Asia Pacific
Asia Pacific dominates long-term growth momentum with about 30% market share in 2024, fueled by rapid industrialization, expanding construction activity, and strong polymer manufacturing. China and India drive high-volume consumption through rising infrastructure development and large-scale automotive production. Ceramics manufacturers in China and Japan use wollastonite extensively for fluxing and mechanical performance improvement. Growing electronics production also enhances demand for reinforced polymers. Increasing investment in local mining and processing capacity strengthens the region’s supply chain and supports ongoing expansion.
Latin America
Latin America accounts for nearly 5% share of the wollastonite market in 2024, supported by moderate demand from construction, ceramics, and polymer sectors. Countries such as Mexico and Brazil remain key users due to growing infrastructure projects and rising automotive component manufacturing. Regional coatings producers adopt wollastonite for improved film durability and corrosion resistance. Limited local mining capacity keeps dependence on imports, but gradual industrial growth supports steady market development. Adoption increases as manufacturers shift toward cost-efficient reinforcement materials.
Middle East and Africa
Middle East and Africa hold about 3% share of the global wollastonite market in 2024, driven mainly by demand from construction, ceramics, and industrial coatings. Infrastructure expansion across the Gulf countries boosts consumption in cement boards, tiles, and fire-resistant building materials. The region’s emerging automotive and electronics assembly industries offer gradual growth potential. However, limited local mineral production and high import dependence restrict wider adoption. Rising focus on durable construction materials supports stable but slow-paced market expansion.
Market Segmentations:
By Type
By Application
- Plastic
- Paint Coating
- Ceramic
- Polymer
- Others
By End Use
- Electrical & Electronics
- Building & Construction
- Automotive
- Others
By Geography
- North America
- Europe
- Germany
- France
- U.K.
- Italy
- Spain
- Rest of Europe
- Asia Pacific
- China
- Japan
- India
- South Korea
- South-east Asia
- Rest of Asia Pacific
- Latin America
- Brazil
- Argentina
- Rest of Latin America
- Middle East & Africa
- GCC Countries
- South Africa
- Rest of the Middle East and Africa
Competitive Landscape
The competitive landscape of the wollastonite market includes Canadian Wollastonite, Xinyu South Wollastonite Co Ltd, ACBM JSC Imerys S.A, R.T. Vanderbilt Holding Company Inc, Wolkem, Lishu Dadingshan Wollastonite Co. Ltd, Nordkalk Corporation, Omya, and Imerys. The market features strong competition driven by product quality, mineral purity, and processing capabilities. Companies focus on consistent particle morphology, reliable supply chains, and advanced milling technologies to improve performance in polymers, coatings, and construction materials. Producers invest in expanding mining capacity and upgrading beneficiation processes to meet rising global demand. Strategic partnerships with plastics, ceramics, and composite manufacturers support long-term growth, while sustainability commitments shape material sourcing and product development. The market remains moderately consolidated, with established players holding significant regional influence.
Shape Your Report to Specific Countries or Regions & Enjoy 30% Off!
Key Player Analysis
Recent Developments
- In 2025, Omya completed the acquisition of Distrupol, a distributor of thermoplastics in the UK, Ireland, and Nordic markets. Distrupol is now integrated into Omya Performance Polymer Distribution, enhancing Omya’s polymer distribution reach across Europe.
- In 2025, Imerys completed the acquisition of Chemviron’s European diatomite and perlite business. This move expands Imerys’ portfolio in specialty minerals, which aligns with its broader strategy in performance minerals and could strengthen synergies with its wollastonite operations.
- In 2025, R.T. Vanderbilt continues to offer an established range of natural VANSIL® wollastonite products with various degrees of fineness and aspect ratios to serve diversified industrial uses such as plastics, paints, ceramics, and agriculture.
Report Coverage
The research report offers an in-depth analysis based on Type, Application, End-Use and Geography. It details leading market players, providing an overview of their business, product offerings, investments, revenue streams, and key applications. Additionally, the report includes insights into the competitive environment, SWOT analysis, current market trends, as well as the primary drivers and constraints. Furthermore, it discusses various factors that have driven market expansion in recent years. The report also explores market dynamics, regulatory scenarios, and technological advancements that are shaping the industry. It assesses the impact of external factors and global economic changes on market growth. Lastly, it provides strategic recommendations for new entrants and established companies to navigate the complexities of the market.
Future Outlook
- The market will grow steadily as industries increase the use of wollastonite in reinforced polymers.
- Demand will rise in construction due to the need for stronger and more fire-resistant materials.
- Automotive manufacturers will expand usage to support lightweight component production.
- Coatings producers will adopt wollastonite more widely to improve durability and corrosion protection.
- Ceramics applications will expand as manufacturers seek better fluxing performance and mechanical strength.
- Sustainability efforts will support higher adoption of natural wollastonite across major industries.
- New processing technologies will improve mineral purity and enhance material performance.
- Regional mining capacity will grow to reduce supply-chain dependence on imports.
- Emerging economies will drive significant volume growth through infrastructure development.
- Competitive pressure from substitutes will influence pricing and encourage innovation in product grades.


