Home » Automotive & Transportation » Electric Vehicle Supply Chain Architecture Market

Electric Vehicle Supply Chain Architecture Market By Battery Type (Lithium-Ion Batteries, Nickel-Metal Hydride Batteries, Lead-Acid Batteries, Solid-State Batteries); By Vehicle Type (Battery Electric Vehicles (BEVs), Plug-In Hybrid Electric Vehicles (PHEVs), Hybrid Electric Vehicles (HEVs), Fuel Cell Electric Vehicles (FCEVs)); By Sales Channel (Original Equipment Manufacturer (OEM), Aftermarket) – Growth, Share, Opportunities & Competitive Analysis, 2024 – 2032

Report ID: 5379 | Report Format : Excel, PDF
REPORT ATTRIBUTE DETAILS
Historical Period 2020-2023
Base Year 2024
Forecast Period 2025-2032
Electric Vehicle Supply Chain Architecture Market Size 2024 USD 32,930.0 million
Electric Vehicle Supply Chain Architecture Market, CAGR 10.60%
Electric Vehicle Supply Chain Architecture Market Size 2032 USD 73,728.0 million

Market Overview

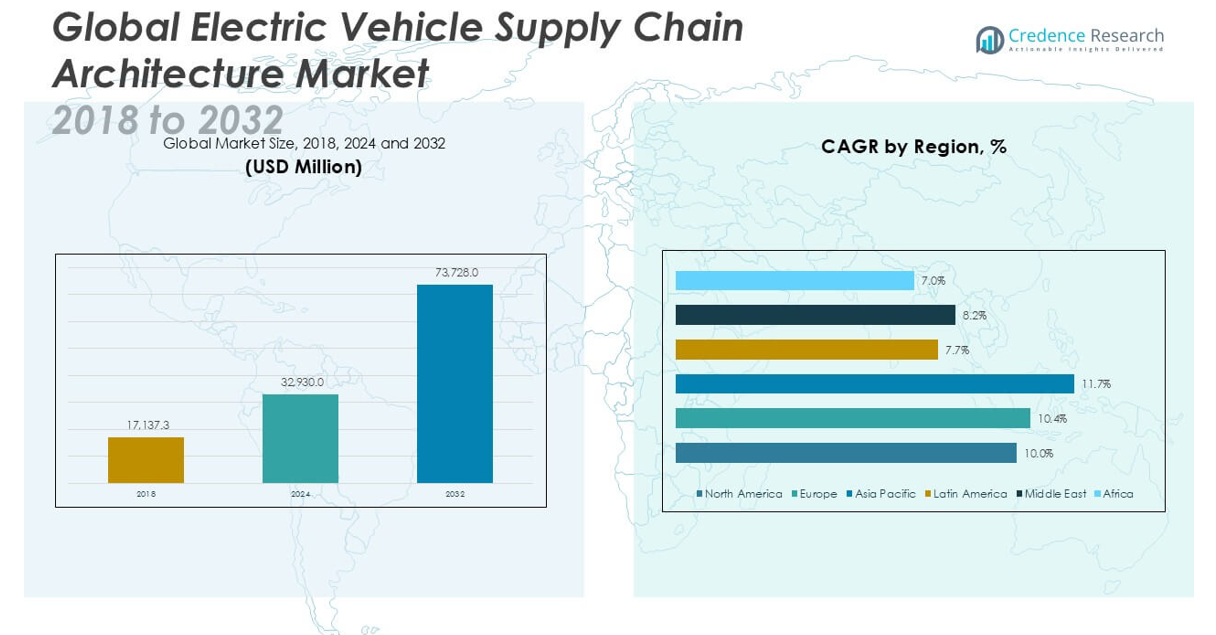
The Electric Vehicle Supply Chain Architecture market size was valued at USD 17,137.3 million in 2018, increased to USD 32,930.0 million in 2024, and is anticipated to reach USD 73,728.0 million by 2032, at a CAGR of 10.60% during the forecast period.

The Electric Vehicle Supply Chain Architecture market is driven by key players such as Contemporary Amperex Technology Co. Limited (CATL), LG Energy Solution, Panasonic Holdings Corporation, BYD Company Limited, Samsung SDI Co., Ltd., and Tesla, Inc. These companies lead the market with strong capabilities in battery manufacturing, advanced supply chain integration, and strategic partnerships with automotive OEMs. Bosch, Aptiv PLC, Denso Corporation, and Magna International Inc. further strengthen the market through their expertise in electronic components and supply chain systems. Asia Pacific holds the dominant position in the global market, capturing approximately 42.0% of the total market share in 2024, supported by large-scale production, government incentives, and rapidly expanding electric vehicle demand in China, Japan, and South Korea.

Electric Vehicle Supply Chain Architecture Market size

Market Insights

  • The Electric Vehicle Supply Chain Architecture market was valued at USD 32,930.0 million in 2024 and is projected to reach USD 73,728.0 million by 2032, growing at a CAGR of 10.60% during the forecast period.
  • Increasing demand for electric vehicles, driven by rising environmental concerns and government incentives, is significantly boosting market growth across all major regions.
  • The market is witnessing trends such as the rapid integration of digital supply chain solutions and the shift toward localized supply chains to reduce global disruption risks.
  • Asia Pacific holds the largest regional share of around 42.0% in 2024, with the lithium-ion battery segment leading due to its high energy density and widespread adoption in electric vehicles.
  • The market faces restraints including limited availability of critical raw materials and complex global logistics, which can create supply shortages and increase operational costs for key players.

Access crucial information at unmatched prices!

Request your sample report today & start making informed decisions powered by Credence Research Inc.!

Download Sample

Market Segmentation Analysis:

By Battery Type:

The lithium-ion batteries segment dominates the Electric Vehicle Supply Chain Architecture market, accounting for the largest market share in 2024. This dominance is driven by their high energy density, lightweight design, and longer life cycle compared to other battery types. The growing consumer preference for electric vehicles with extended driving range and faster charging capabilities has significantly increased the demand for lithium-ion batteries. Although solid-state batteries are emerging with potential safety and energy efficiency advantages, their market penetration remains limited due to high production costs and technological challenges.

  • For instance, Panasonic supplies lithium-ion battery cells for Tesla’s Model 3, which has a battery pack capacity of 50 kWh to 82 kWh, enabling a range of up to 353 miles on a single charge.

By Vehicle Type

Battery Electric Vehicles (BEVs) hold the largest market share in the vehicle type segment of the Electric Vehicle Supply Chain Architecture market. BEVs lead the segment due to rising environmental concerns, stricter emission regulations, and increasing investments by manufacturers in electric vehicle platforms. Governments worldwide are offering substantial subsidies and incentives to promote BEV adoption, further accelerating market growth. While Plug-In Hybrid Electric Vehicles (PHEVs) and Hybrid Electric Vehicles (HEVs) contribute to the segment, BEVs continue to outperform due to advancements in battery technology and expanding charging infrastructure.

  • For instance, BYD produced 1,574,822 battery electric vehicles in 2023, surpassing its own hybrid production and reinforcing its position as a BEV leader.

By Sales Channel

The Original Equipment Manufacturer (OEM) segment leads the sales channel in the Electric Vehicle Supply Chain Architecture market, capturing the largest market share. This dominance is supported by the growing collaborations between OEMs and battery suppliers, which enable integrated and efficient supply chains. OEMs offer customized and pre-installed components that ensure compatibility and performance, driving customer preference. The aftermarket segment is expanding as vehicle ownership rises, but it currently trails OEM sales due to limited demand for replacement parts in newer electric vehicles still under warranty.

Market Overview

Growing Demand for Electric Vehicles

The rapid global shift towards electric mobility is significantly driving the Electric Vehicle Supply Chain Architecture market. Rising environmental concerns, stringent emission regulations, and increasing fuel prices have accelerated the adoption of electric vehicles (EVs). Major automotive manufacturers are expanding their EV portfolios to meet consumer demand and comply with regulatory targets. Additionally, government incentives, tax benefits, and subsidies are further encouraging consumers to transition from conventional vehicles to EVs, which is directly boosting the demand for robust and efficient supply chain solutions.

  • For instance, Tesla delivered 1,808,581 electric vehicles globally in 2023, marking a substantial increase in EV adoption that directly impacts supply chain demand.

Technological Advancements in Battery Production

Innovations in battery technology, especially lithium-ion and solid-state batteries, are a major growth catalyst for the market. Continuous improvements in battery energy density, safety, and cost reduction are enhancing electric vehicle performance and affordability. These advancements necessitate the development of sophisticated and flexible supply chain architectures to efficiently manage raw material procurement, battery manufacturing, and distribution. Strategic partnerships between battery manufacturers and OEMs are further strengthening the supply chain infrastructure, ensuring timely production and delivery to meet increasing global demand.

  • For instance, CATL launched its third-generation cell-to-pack (CTP) battery technology in 2022, achieving a volume utilization efficiency of 72% and supporting ranges exceeding 1,000 kilometers per charge.

Expansion of Charging Infrastructure

The ongoing expansion of public and private electric vehicle charging networks significantly supports market growth. The availability of fast-charging stations and home charging solutions is improving consumer confidence and driving electric vehicle adoption. This infrastructural development requires seamless coordination across multiple supply chain layers, including hardware manufacturers, software providers, and logistics operators. Efficient supply chain systems are critical to meeting the logistical demands of charging infrastructure deployment, thereby creating growth opportunities for supply chain architecture providers within the EV ecosystem.

Key Trends & Opportunities

Rising Integration of Digital Supply Chain Solutions

The adoption of digital technologies such as blockchain, artificial intelligence, and Internet of Things (IoT) is transforming the Electric Vehicle Supply Chain Architecture market. These technologies enable real-time tracking, predictive maintenance, and enhanced transparency across supply chain operations. Companies are leveraging digital platforms to improve decision-making, reduce lead times, and optimize inventory management. This trend presents significant opportunities for supply chain solution providers to offer advanced, data-driven systems that improve efficiency and responsiveness in the electric vehicle sector.

  • For instance, Volkswagen implemented its “Industrial Cloud” solution in collaboration with Amazon Web Services, connecting over 30,000 machines and systems across its 122 production sites worldwide for real-time supply chain management.

Increased Focus on Localized Supply Chains

Manufacturers are increasingly shifting towards localized and regional supply chain models to minimize risks related to global disruptions, trade restrictions, and geopolitical tensions. This trend is driving investments in regional production facilities and material sourcing to reduce dependency on international suppliers. Localizing supply chains helps ensure faster delivery times, reduced transportation costs, and greater flexibility to meet regional demand fluctuations. This strategic shift offers opportunities for supply chain architecture providers to design resilient, region-specific solutions.

  • For instance, LG Energy Solution invested USD 5.5 billion to build a battery manufacturing complex in Arizona, USA, with a production capacity of 43 GWh per year to support North American EV supply chains.

Key Challenges

Supply Shortages of Critical Raw Materials

The Electric Vehicle Supply Chain Architecture market faces significant challenges due to the limited availability of critical raw materials such as lithium, cobalt, and nickel. These materials are essential for battery manufacturing, and their scarcity can lead to production delays and increased costs. The global competition for these resources further intensifies supply constraints, requiring manufacturers to secure long-term contracts or develop alternative materials. Addressing this challenge is crucial to maintaining supply chain stability and supporting market growth.

Complex Global Logistics and Regulatory Barriers

Managing the global supply chain for electric vehicles involves navigating complex logistics networks and diverse regulatory frameworks. Cross-border trade restrictions, import tariffs, and varying safety standards can create significant bottlenecks and compliance challenges. These complexities increase operational costs and delay product deliveries, posing hurdles for efficient supply chain management. Companies must invest in comprehensive regulatory strategies and logistics planning to overcome these obstacles and ensure smooth supply chain operations across different regions.

High Initial Investment in Infrastructure

Developing an integrated and technologically advanced supply chain architecture requires substantial upfront investment. The cost of establishing regional manufacturing hubs, advanced warehousing, and digital tracking systems can be a barrier for smaller market participants. Additionally, investments in skilled labor, cybersecurity, and sustainable practices further elevate entry costs. This high financial requirement limits market access and can slow the pace of supply chain expansion, particularly in emerging markets with constrained capital resources.

Regional Analysis

North America

In 2024, North America held a market size of USD 7,409.3 million in the Electric Vehicle Supply Chain Architecture market, accounting for approximately 22.5% of the global share. The market grew from USD 4,284.3 million in 2018 and is projected to reach USD 14,598.2 million by 2032, registering a CAGR of 10.0% during the forecast period. The region’s growth is driven by the rapid adoption of electric vehicles, favorable government policies, and robust investments in charging infrastructure and battery production. Strong collaboration between OEMs and technology providers further strengthens the North American supply chain landscape.

Europe

Europe captured around 25.0% of the global Electric Vehicle Supply Chain Architecture market in 2024, with a market size of USD 8,232.5 million, up from USD 4,113.0 million in 2018. The market is expected to reach USD 18,063.4 million by 2032, growing at a CAGR of 10.4%. Europe’s growth is propelled by stringent carbon emission regulations, aggressive EV manufacturing targets, and substantial government incentives. The region’s focus on creating a circular battery economy and expanding localized supply chains enhances its market competitiveness, contributing to its growing market share and supply chain sophistication.

Asia Pacific

Asia Pacific dominates the Electric Vehicle Supply Chain Architecture market with a commanding 42.0% market share in 2024. The market surged from USD 6,752.1 million in 2018 to USD 13,830.6 million in 2024 and is projected to reach USD 33,914.9 million by 2032, at the highest regional CAGR of 11.7%. The region’s leadership is supported by China’s large-scale EV production, aggressive government support, and robust battery manufacturing capabilities. Additionally, increasing EV demand in countries like Japan, South Korea, and India fuels regional growth, making Asia Pacific the core hub of the global EV supply chain.

Latin America

Latin America accounted for about 3.5% of the global Electric Vehicle Supply Chain Architecture market in 2024, with a market size of USD 1,152.6 million, growing from USD 599.8 million in 2018. The market is anticipated to reach USD 2,949.1 million by 2032, expanding at a CAGR of 7.7%. The region’s growth is gradually improving, driven by increasing government initiatives to reduce emissions and rising interest in EV infrastructure development. However, challenges related to high initial investment and limited charging facilities are slowing the market’s pace compared to other regions.

Middle East

The Middle East held approximately 4.9% of the global Electric Vehicle Supply Chain Architecture market in 2024, with a market value of USD 1,613.6 million, up from USD 942.6 million in 2018. The market is expected to grow to USD 3,170.3 million by 2032, registering a CAGR of 8.2%. Growing environmental awareness, coupled with increasing investments in smart city projects and EV adoption, is supporting regional expansion. Although infrastructure challenges persist, countries like the UAE and Saudi Arabia are spearheading electric vehicle initiatives that will contribute to market growth in the coming years.

Africa

Africa contributed about 2.1% to the global Electric Vehicle Supply Chain Architecture market in 2024, with a market size of USD 691.5 million, rising from USD 445.6 million in 2018. The market is projected to reach USD 1,032.2 million by 2032, advancing at a CAGR of 7.0%. The African market is in its early stages, facing infrastructure gaps and affordability constraints. However, increasing urbanization, government interest in sustainable transportation, and emerging investments in EV charging stations are expected to gradually support market growth, albeit at a slower rate compared to other global regions.

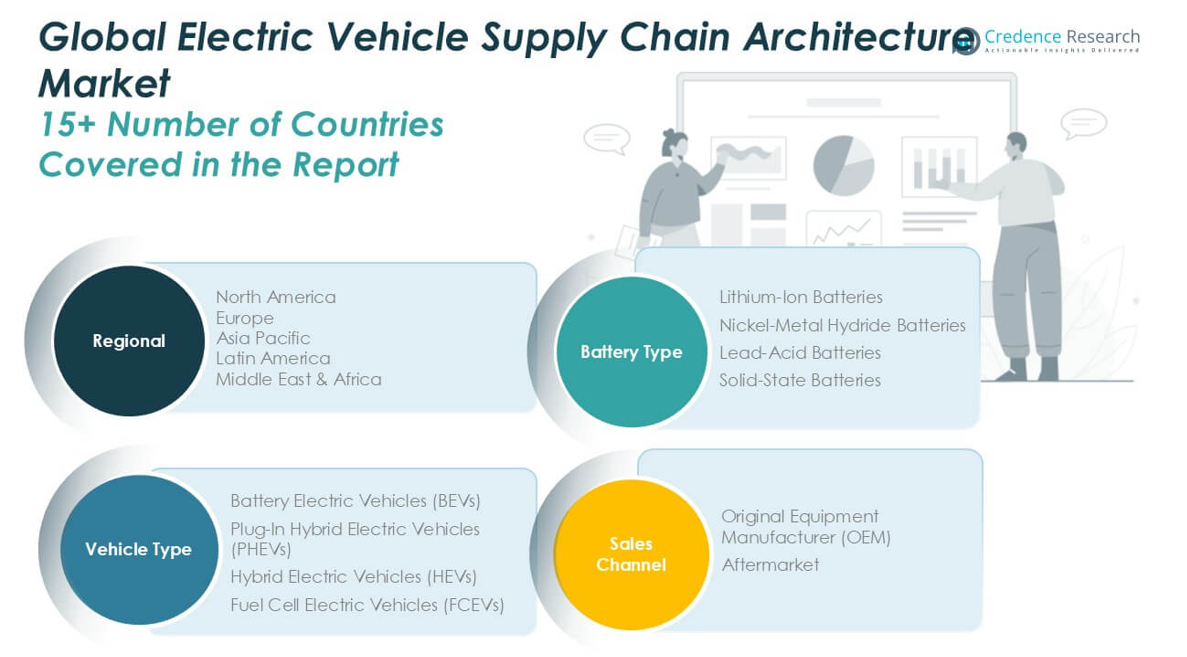
Electric Vehicle Supply Chain Architecture Market segmentation

Market Segmentations:

By Battery Type:

  • Lithium-Ion Batteries
  • Nickel-Metal Hydride Batteries
  • Lead-Acid Batteries
  • Solid-State Batteries

By Vehicle Type:

  • Battery Electric Vehicles (BEVs)
  • Plug-In Hybrid Electric Vehicles (PHEVs)
  • Hybrid Electric Vehicles (HEVs)
  • Fuel Cell Electric Vehicles (FCEVs)

By Sales Channel:

  • Original Equipment Manufacturer (OEM)
  • Aftermarket

By Geography:

  • North America
    • U.S.
    • Canada
    • Mexico
  • Europe
    • Germany
    • France
    • U.K.
    • Italy
    • Spain
    • Rest of Europe
  • Asia Pacific
    • China
    • Japan
    • India
    • South Korea
    • South-east Asia
    • Rest of Asia Pacific
  • Latin America
    • Brazil
    • Argentina
    • Rest of Latin America
  • Middle East & Africa
    • GCC Countries
    • South Africa
    • Rest of the Middle East and Africa

Competitive Landscape

The Electric Vehicle Supply Chain Architecture market is highly competitive, with key players focusing on technological innovation, strategic partnerships, and capacity expansion to strengthen their market positions. Companies such as Contemporary Amperex Technology Co. Limited (CATL), LG Energy Solution, Panasonic Holdings Corporation, and BYD Company Limited dominate the battery supply segment, leveraging large-scale production and advanced battery technologies. Automotive leaders like Tesla, Inc., and major component suppliers such as Bosch, Aptiv, and Denso play critical roles in the integrated supply chain, ensuring seamless coordination across manufacturing, assembly, and distribution. The market is witnessing increasing collaboration between OEMs and battery manufacturers to secure long-term supply agreements and mitigate raw material shortages. Additionally, players are investing in regional production facilities to reduce dependency on global logistics and improve responsiveness to market demands. Competitive strategies also include digital supply chain integration and sustainability initiatives aimed at enhancing supply chain transparency and reducing environmental impact.

Shape Your Report to Specific Countries or Regions & Enjoy 30% Off!

Key Player Analysis

  • Contemporary Amperex Technology Co. Limited (CATL)
  • LG Energy Solution
  • Panasonic Holdings Corporation
  • BYD Company Limited
  • Samsung SDI Co., Ltd.
  • SK On Co., Ltd.
  • Tesla, Inc.
  • Robert Bosch GmbH
  • Nidec Corporation
  • Infineon Technologies AG
  • Aptiv PLC
  • Denso Corporation
  • Magna International Inc.
  • Valeo SA

Recent Developments

  • In February 2025, Geely Galaxy has introduced the Galaxy L6 EM-i, a compact plug-in hybrid sedan available in five variants with CLTC electric-mode ranges of 60 km and 140 km. Prices range from CNY 79,800 to CNY 106,800.
  • In February 2025, Volvo Cars introduced the all-new Volvo EX30 Cross Country, a fully electric compact SUV. It is available for order in selected markets, with deliveries beginning in spring 2025. The vehicle offers a range of up to 427 km and can charge from 10% to 80% in 26 minutes. It features all-wheel drive, increased ground clearance for improved off-road capability, and larger wheels, with an option for 18-inch all-terrain tires.
  • In January 2025, Tesla launched the new Model Y in the US and Canada. The Model Y Launch Series, priced at USD 59,990 before options in the US, is set for deliveries starting in March 2025.
  • In March 2023, Moscow signed a contract with KAMAZ for 1,000 electric buses. There are also plans to purchase another 200 electric buses from GAZ Group. Moscow currently runs 1,055 electric buses on 79 routes. Moscow plans to install nearly 200 ultra-fast charging stations for the electric buses, open a second electric bus park in the Mitino district northwest of Moscow, and launch 29 more electric bus routes.
  • In February 2023, BYD has added two new dealer corporations to its network in the Europe region. Motor Distributors Ltd (MDL) is active in Ireland and will offer BYD models at select locations including Dublin and Cork. RSA is a dealer with whom BYD already works in Norway, and it will offer EVs of Chinese-make in Finland and Iceland. BYD initially launched three EV models in select European countries at the end of 2022. Two more series could follow in 2023.

Market Concentration & Characteristics

The Electric Vehicle Supply Chain Architecture Market is moderately concentrated, with a few dominant players controlling significant market shares, particularly in battery manufacturing and electronic components. It features high entry barriers due to the need for advanced technology, substantial capital investment, and long-term supplier agreements. The market is characterized by rapid technological evolution, complex global logistics, and increasing reliance on digital supply chain management. Strong partnerships between battery manufacturers and automotive OEMs define its structure, enabling streamlined production and secured supply. It operates within a highly regulated environment, driven by emission standards and sustainability goals. Companies prioritize regionalization to reduce logistical risks and improve responsiveness to market demand. The market’s competitive intensity is elevated by continuous innovation in battery chemistry, supply chain transparency, and cost efficiency. It demonstrates significant interdependence across suppliers, logistics providers, and OEMs, which creates vulnerability to raw material shortages and geopolitical disruptions.

Report Coverage

The research report offers an in-depth analysis based on Battery Type, Vehicle Type, Sales Channel and Geography. It details leading market players, providing an overview of their business, product offerings, investments, revenue streams, and key applications. Additionally, the report includes insights into the competitive environment, SWOT analysis, current market trends, as well as the primary drivers and constraints. Furthermore, it discusses various factors that have driven market expansion in recent years. The report also explores market dynamics, regulatory scenarios, and technological advancements that are shaping the industry. It assesses the impact of external factors and global economic changes on market growth. Lastly, it provides strategic recommendations for new entrants and established companies to navigate the complexities of the market.

Future Outlook

  1. The Electric Vehicle Supply Chain Architecture market is expected to expand steadily with the increasing global adoption of electric vehicles.
  2. Battery manufacturing will remain the core focus, with continuous advancements in lithium-ion and solid-state technologies.
  3. Companies will prioritize building regional supply chains to reduce dependence on international logistics and mitigate disruption risks.
  4. Demand for digital supply chain solutions will grow, driven by the need for real-time tracking and improved transparency.
  5. Strategic partnerships between OEMs and battery suppliers will strengthen to ensure consistent raw material access and production capacity.
  6. Governments worldwide will continue to support the market through subsidies, emission regulations, and infrastructure investments.
  7. The market will experience growing pressure to address critical raw material shortages and develop alternative, sustainable materials.
  8. Investments in recycling and second-life battery solutions will increase to support circular supply chain models.
  9. Rapid development of charging infrastructure will continue to create demand for efficient, integrated supply chain networks.
  10. The competitive landscape will remain intense as established players and new entrants focus on technological innovation and cost optimization.

CHAPTER NO. 1 : GENESIS OF THE MARKET

1.1 Market Prelude – Introduction & Scope

1.2 The Big Picture – Objectives & Vision

1.3 Strategic Edge – Unique Value Proposition

1.4 Stakeholder Compass – Key Beneficiaries

CHAPTER NO. 2 : EXECUTIVE LENS

2.1 Pulse of the Industry – Market Snapshot

2.2 Growth Arc – Revenue Projections (USD Million)

2.3. Premium Insights – Based on Primary Interviews

CHAPTER NO. 3 : ELECTRIC VEHICLE SUPPLY CHAIN ARCHITECTURE MARKET FORCES & INDUSTRY PULSE

3.1 Foundations of Change – Market Overview

3.2 Catalysts of Expansion – Key Market Drivers

3.2.1 Momentum Boosters – Growth Triggers

3.2.2 Innovation Fuel – Disruptive Technologies

3.3 Headwinds & Crosswinds – Market Restraints

3.3.1 Regulatory Tides – Compliance Challenges

3.3.2 Economic Frictions – Inflationary Pressures

3.4 Untapped Horizons – Growth Potential & Opportunities

3.5 Strategic Navigation – Industry Frameworks

3.5.1 Market Equilibrium – Porter’s Five Forces

3.5.2 Ecosystem Dynamics – Value Chain Analysis

3.5.3 Macro Forces – PESTEL Breakdown

3.6 Price Trend Analysis

3.6.1 Regional Price Trend

3.6.2 Price Trend by product

CHAPTER NO. 4 : KEY INVESTMENT EPICENTER

4.1 Regional Goldmines – High-Growth Geographies

4.2 Product Frontiers – Lucrative Product Categories

4.3 Vehicle Type Sweet Spots – Emerging Demand Segments

CHAPTER NO. 5: REVENUE TRAJECTORY & WEALTH MAPPING

5.1 Momentum Metrics – Forecast & Growth Curves

5.2 Regional Revenue Footprint – Market Share Insights

5.3 Segmental Wealth Flow – Battery Type & Vehicle Type Revenue

CHAPTER NO. 6 : TRADE & COMMERCE ANALYSIS

6.1.Import Analysis by Region

6.1.1. Global Electric Vehicle Supply Chain Architecture Market Import Volume By Region

6.2.Export Analysis by Region

6.2.1. Global Electric Vehicle Supply Chain Architecture Market Export Volume By Region

CHAPTER NO. 7 : COMPETITION ANALYSIS

7.1.Company Market Share Analysis

7.1.1. Global Electric Vehicle Supply Chain Architecture Market: Company Market Share

7.1. Global Electric Vehicle Supply Chain Architecture Market Company Volume Market Share

7.2. Global Electric Vehicle Supply Chain Architecture Market Company Revenue Market Share

7.3.Strategic Developments

7.3.1.Acquisitions & Mergers

7.3.2. New Product Launch

7.3.3. Regional Expansion

7.4. Competitive Dashboard

7.5.    Company Assessment Metrics, 2024

CHAPTER NO. 8 : ELECTRIC VEHICLE SUPPLY CHAIN ARCHITECTURE MARKET – BY BATTERY TYPE SEGMENT ANALYSIS

8.1. Electric Vehicle Supply Chain Architecture Market Overview by Battery Type Segment

8.1.1. Electric Vehicle Supply Chain Architecture Market Volume Share By Battery Type

8.1.2. Electric Vehicle Supply Chain Architecture Market Revenue Share By Battery Type

8.2.Lithium-Ion Batteries

8.3. Nickel-Metal Hydride Batteries

8.4. Lead-Acid Batteries

8.5. Solid-State Batteries

CHAPTER NO. 9 : ELECTRIC VEHICLE SUPPLY CHAIN ARCHITECTURE MARKET – BY VEHICLE TYPE SEGMENT ANALYSIS

9.1. Electric Vehicle Supply Chain Architecture Market Overview by Vehicle Type Segment

9.1.1. Electric Vehicle Supply Chain Architecture Market Volume Share By Vehicle Type

9.1.2. Electric Vehicle Supply Chain Architecture Market Revenue Share By Vehicle Type

9.2.Battery Electric Vehicles (BEVs)

9.3.Plug-In Hybrid Electric Vehicles (PHEVs)

9.4. Hybrid Electric Vehicles (HEVs)

9.5.Fuel Cell Electric Vehicles (FCEVs)

CHAPTER NO. 10 : ELECTRIC VEHICLE SUPPLY CHAIN ARCHITECTURE MARKET – BY SALES CHANNEL SEGMENT ANALYSIS

10.1.Electric Vehicle Supply Chain Architecture Market Overview by Sales Channel Segment

10.1.1. Electric Vehicle Supply Chain Architecture Market Volume Share By Sales Channel

10.1.2. Electric Vehicle Supply Chain Architecture Market Revenue Share By Sales Channel

10.2.Original Equipment Manufacturer (OEM)

10.3.Aftermarket

CHAPTER NO. 11 : ELECTRIC VEHICLE SUPPLY CHAIN ARCHITECTURE MARKET – REGIONAL ANALYSIS

11.1.Electric Vehicle Supply Chain Architecture Market Overview by Region Segment

11.1.1. Global Electric Vehicle Supply Chain Architecture Market Volume Share By Region

11.1.2. Global Electric Vehicle Supply Chain Architecture Market Revenue Share By Region

11.1.3.Regions

11.1.4.Global Electric Vehicle Supply Chain Architecture Market Volume By Region

11.1.5.Global Electric Vehicle Supply Chain Architecture Market Revenue By Region

11.1.6.Battery Type

11.1.7.Global Electric Vehicle Supply Chain Architecture Market Volume By Battery Type

11.1.8. Global Electric Vehicle Supply Chain Architecture Market Revenue By Battery Type

11.1.9.Vehicle Type

11.1.10. Global Electric Vehicle Supply Chain Architecture Market Volume By Vehicle Type

11.1.11. Global Electric Vehicle Supply Chain Architecture Market Revenue By Vehicle Type

11.1.12.Sales Channel

11.1.13. Global Electric Vehicle Supply Chain Architecture Market Volume By Sales Channel

11.1.14. Global Electric Vehicle Supply Chain Architecture Market Revenue By Sales Channel

CHAPTER NO. 12 : NORTH AMERICA ELECTRIC VEHICLE SUPPLY CHAIN ARCHITECTURE MARKET – COUNTRY ANALYSIS

12.1.North America Electric Vehicle Supply Chain Architecture Market Overview by Country Segment

12.1.1.North America Electric Vehicle Supply Chain Architecture Market Volume Share By Region

12.1.2. North America Electric Vehicle Supply Chain Architecture Market Revenue Share By Region

12.2.North America

12.2.1. North America Electric Vehicle Supply Chain Architecture Market Volume By Country

12.2.2. North America Electric Vehicle Supply Chain Architecture Market Revenue By Country

12.2.3.Battery Type

12.2.4.North America Electric Vehicle Supply Chain Architecture Market Volume By Battery Type

12.2.5.North America Electric Vehicle Supply Chain Architecture Market Revenue By Battery Type

12.2.6.Vehicle Type

12.2.7.North America Electric Vehicle Supply Chain Architecture Market Volume By Vehicle Type

12.2.8. North America Electric Vehicle Supply Chain Architecture Market Revenue By Vehicle Type

12.2.9.Sales Channel

12.2.10.North America Electric Vehicle Supply Chain Architecture Market Volume By Sales Channel

12.2.11.North America Electric Vehicle Supply Chain Architecture Market Revenue By Sales Channel

12.3.U.S.

12.4.Canada

12.5.Mexico

CHAPTER NO. 13 : EUROPE ELECTRIC VEHICLE SUPPLY CHAIN ARCHITECTURE MARKET – COUNTRY ANALYSIS

13.1. Europe Electric Vehicle Supply Chain Architecture Market Overview by Country Segment

13.1.1. Europe Electric Vehicle Supply Chain Architecture Market Volume Share By Region

13.1.2. Europe Electric Vehicle Supply Chain Architecture Market Revenue Share By Region

13.2.Europe

13.2.1.Europe Electric Vehicle Supply Chain Architecture Market Volume By Country

13.2.2.Europe Electric Vehicle Supply Chain Architecture Market Revenue By Country

13.2.3.Battery Type

13.2.4. Europe Electric Vehicle Supply Chain Architecture Market Volume By Battery Type

13.2.5. Europe Electric Vehicle Supply Chain Architecture Market Revenue By Battery Type

13.2.6.Vehicle Type

13.2.7. Europe Electric Vehicle Supply Chain Architecture Market Volume By Vehicle Type

13.2.8. Europe Electric Vehicle Supply Chain Architecture Market Revenue By Vehicle Type

13.2.9.Sales Channel

13.2.10. Europe Electric Vehicle Supply Chain Architecture Market Volume By Sales Channel

13.2.11. Europe Electric Vehicle Supply Chain Architecture Market Revenue By Sales Channel

13.3.UK

13.4.France

13.5.Germany

13.6.Italy

13.7.Spain

13.8.Russia

13.9.   Rest of Europe

CHAPTER NO. 14 : ASIA PACIFIC ELECTRIC VEHICLE SUPPLY CHAIN ARCHITECTURE MARKET – COUNTRY ANALYSIS

14.1.Asia Pacific Electric Vehicle Supply Chain Architecture Market Overview by Country Segment

14.1.1.Asia Pacific Electric Vehicle Supply Chain Architecture Market Volume Share By Region

14.1.2.Asia Pacific Electric Vehicle Supply Chain Architecture Market Revenue Share By Region

14.2.Asia Pacific

14.2.1. Asia Pacific Electric Vehicle Supply Chain Architecture Market Volume By Country

14.2.2. Asia Pacific Electric Vehicle Supply Chain Architecture Market Revenue By Country

14.2.3.Battery Type

14.2.4. Asia Pacific Electric Vehicle Supply Chain Architecture Market Volume By Battery Type

14.2.5.Asia Pacific Electric Vehicle Supply Chain Architecture Market Revenue By Battery Type

14.2.6.Vehicle Type

14.2.7.Asia Pacific Electric Vehicle Supply Chain Architecture Market Volume By Vehicle Type

14.2.8.Asia Pacific Electric Vehicle Supply Chain Architecture Market Revenue By Vehicle Type

14.2.9.Sales Channel

14.2.10.Asia Pacific Electric Vehicle Supply Chain Architecture Market Volume By Sales Channel

14.2.11.Asia Pacific Electric Vehicle Supply Chain Architecture Market Revenue By Sales Channel

14.3.China

14.4.Japan

14.5.South Korea

14.6.India

14.7.Australia

14.8.Southeast Asia

14.9. Rest of Asia Pacific

CHAPTER NO. 15 : LATIN AMERICA ELECTRIC VEHICLE SUPPLY CHAIN ARCHITECTURE MARKET – COUNTRY ANALYSIS

15.1.Latin America Electric Vehicle Supply Chain Architecture Market Overview by Country Segment

15.1.1.Latin America Electric Vehicle Supply Chain Architecture Market Volume Share By Region

15.1.2.Latin America Electric Vehicle Supply Chain Architecture Market Revenue Share By Region

15.2. Latin America

15.2.1. Latin America Electric Vehicle Supply Chain Architecture Market Volume By Country

15.2.2. Latin America Electric Vehicle Supply Chain Architecture Market Revenue By Country

15.2.3.Battery Type

15.2.4. Latin America Electric Vehicle Supply Chain Architecture Market Volume By Battery Type

15.2.5. Latin America Electric Vehicle Supply Chain Architecture Market Revenue By Battery Type

15.2.6.Vehicle Type

15.2.7.Latin America Electric Vehicle Supply Chain Architecture Market Volume By Vehicle Type

15.2.8.Latin America Electric Vehicle Supply Chain Architecture Market Revenue By Vehicle Type

15.2.9.Sales Channel

15.2.10.Latin America Electric Vehicle Supply Chain Architecture Market Volume By Sales Channel

15.2.11.Latin America Electric Vehicle Supply Chain Architecture Market Revenue By Sales Channel

15.3.Brazil

15.4.Argentina

15.5.Rest of Latin America

CHAPTER NO. 16 : MIDDLE EAST ELECTRIC VEHICLE SUPPLY CHAIN ARCHITECTURE MARKET – COUNTRY ANALYSIS

16.1.Middle East Electric Vehicle Supply Chain Architecture Market Overview by Country Segment

16.1.1.Middle East Electric Vehicle Supply Chain Architecture Market Volume Share By Region

16.1.2. Middle East Electric Vehicle Supply Chain Architecture Market Revenue Share By Region

16.2.Middle East

16.2.1. Middle East Electric Vehicle Supply Chain Architecture Market Volume By Country

16.2.2. Middle East Electric Vehicle Supply Chain Architecture Market Revenue By Country

16.2.3.Battery Type

16.2.4.Middle East Electric Vehicle Supply Chain Architecture Market Volume By Battery Type

16.2.5.Middle East Electric Vehicle Supply Chain Architecture Market Revenue By Battery Type

16.2.6.Vehicle Type

16.2.7.Middle East Electric Vehicle Supply Chain Architecture Market Volume By Vehicle Type

16.2.8.Middle East Electric Vehicle Supply Chain Architecture Market Revenue By Vehicle Type

16.2.9. Sales Channel

16.2.10.Middle East Electric Vehicle Supply Chain Architecture Market Volume By Sales Channel

16.2.11. Middle East Electric Vehicle Supply Chain Architecture Market Revenue By Sales Channel

16.3.GCC Countries

16.4. Israel

16.5. Turkey

16.6.Rest of Middle East

CHAPTER NO. 17 : AFRICA ELECTRIC VEHICLE SUPPLY CHAIN ARCHITECTURE MARKET – COUNTRY ANALYSIS

17.1. Africa Electric Vehicle Supply Chain Architecture Market Overview by Country Segment

17.1.1.Africa Electric Vehicle Supply Chain Architecture Market Volume Share By Region

17.1.2. Africa Electric Vehicle Supply Chain Architecture Market Revenue Share By Region

17.2. Africa

17.2.1.Africa Electric Vehicle Supply Chain Architecture Market Volume By Country

17.2.2.Africa Electric Vehicle Supply Chain Architecture Market Revenue By Country

17.2.3.Battery Type

17.2.4.Africa Electric Vehicle Supply Chain Architecture Market Volume By Battery Type

17.2.5. Africa Electric Vehicle Supply Chain Architecture Market Revenue By Battery Type

17.2.6.Vehicle Type

17.2.7. Africa Electric Vehicle Supply Chain Architecture Market Volume By Vehicle Type

17.2.8. Africa Electric Vehicle Supply Chain Architecture Market Revenue By Vehicle Type

17.2.9.Sales Channel

17.2.10. Africa Electric Vehicle Supply Chain Architecture Market Volume By Sales Channel

17.2.11. Africa Electric Vehicle Supply Chain Architecture Market Revenue By Sales Channel

17.3. South Africa

17.4.Egypt

17.5.Rest of Africa

CHAPTER NO. 18 : COMPANY PROFILES

18.1.Contemporary Amperex Technology Co. Limited (CATL)

18.1.1.Company Overview

18.1.2.Product Portfolio

18.1.3.Financial Overview

18.1.4.Recent Developments

18.1.5.Growth Strategy

18.1.6.SWOT Analysis

18.2.LG Energy Solution

18.3.Panasonic Holdings Corporation

18.4.BYD Company Limited

18.5.Samsung SDI Co., Ltd.

18.6.SK On Co., Ltd.

18.7.Tesla, Inc.

18.8.Robert Bosch GmbH

18.9.Nidec Corporation

18.10.Infineon Technologies AG

18.11.Aptiv PLC

18.12.Denso Corporation

18.13.Magna International Inc.

18.14. Valeo SA


Request Free Sample

Ready to Transform Data into Decisions?

Request Your Sample Report and Start Your Journey of Informed Choices


Providing the strategic compass for industry titans.

cr-clients-logos

Frequently Asked Questions: 

What is the current size of the Electric Vehicle Supply Chain Architecture Market?

The Electric Vehicle Supply Chain Architecture Market was valued at USD 32,930.0 million in 2024.

What are the key segments within the Electric Vehicle Supply Chain Architecture
Market?

The key segments include battery type, vehicle type, sales channel, and geography.

What are some challenges faced by the Electric Vehicle Supply Chain Architecture Market?

Key challenges include raw material shortages, complex global logistics, and high infrastructure investment costs.

Who are the major players in the Electric Vehicle Supply Chain Architecture Market?

Major players include CATL, LG Energy Solution, Panasonic, BYD, Tesla, Bosch, and Aptiv.

About Author

Ganesh Chandwade

Ganesh Chandwade

Senior Industry Consultant

Ganesh is a senior industry consultant specializing in heavy industries and advanced materials.

View Profile

Related Reports By Keyword

Transmission and Distribution Electric Capacitor Market

The Transmission and Distribution Electric Capacitor Market was valued at USD 11,695.1 million in 2024 and is projected to reach USD 19,648 million by 2032, expanding at a CAGR of 6.7% during the forecast period.

Mechanical Electrical and Plumbing (MEP) Software Market

The Mechanical, Electrical, and Plumbing (MEP) Software Market was valued at USD 3.45 billion in 2024 and is projected to reach USD 6.98 billion by 2032, expanding at a CAGR of 9.2% during the forecast period.

Off-Highway Electric Vehicles Market

The Off Highway Electric Vehicle Market is projected to grow from USD 7,740 million in 2024 to an estimated USD 58,623 million by 2032, with a compound annual growth rate (CAGR) of 28.8% from 2024 to 2032.

Low Voltage Electric Fuse Market

The low voltage electric fuse market is projected to grow from USD 3,500 million in 2024 to USD 5,171.1 million by 2032, registering a CAGR of 5% during the forecast period.

Medium Power Electric Vehicle Busbar Market

The Medium Power Electric Vehicle Busbar Market size was valued at USD 258.3 million in 2024 and is anticipated to reach USD 1,081.4 million by 2032, expanding at a CAGR of 19.6% during the forecast period.

Low Voltage Commercial Electric Boiler Market

Low Voltage Commercial Electric Boiler Market size was valued at USD 1251.3 million in 2024 and is anticipated to reach USD 3774.8 million by 2032, at a CAGR of 14.8% during the forecast period.

Multistage Electric Submersible Pump Market

The Multistage Electric Submersible Pump Market is projected to grow from USD 8,997.2 million in 2024 to an estimated USD 16,901.5 million by 2032, with a compound annual growth rate (CAGR) of 8.2% from 2024 to 2032.

Low Voltage Electric Capacitor Market

The Low Voltage Electric Capacitor Market is projected to grow from USD 9,225.1 million in 2024 to an estimated USD 17,329.6 million by 2032, with a compound annual growth rate (CAGR) of 8.2% from 2024 to 2032.

Low Voltage Electric Boiler Market

The low voltage electric boiler market is projected to grow from USD 9,050.2 million in 2024 to an estimated USD 21,465.4 million by 2032, with a compound annual growth rate (CAGR) of 11.4% from 2024 to 2032.

Purchase Options

The report comes as a view-only PDF document, optimized for individual clients. This version is recommended for personal digital use and does not allow printing. Use restricted to one purchaser only.
$4999

To meet the needs of modern corporate teams, our report comes in two formats: a printable PDF and a data-rich Excel sheet. This package is optimized for internal analysis. Unlimited users allowed within one corporate location (e.g., regional office).
$6999

The report will be delivered in printable PDF format along with the report’s data Excel sheet. This license offers 100 Free Analyst hours where the client can utilize Credence Research Inc. research team. Permitted for unlimited global use by all users within the purchasing corporation, such as all employees of a single company.
$12999

Credence Staff 3

WILLIAM, North America

Support Staff at Credence Research

KEITH PHILLIPS, Europe

Lee - CR Sales Staff

LEE VALLANCE, Asia Pacific

Kieran Jameson

KIERAN JAMESON, Australia

Report delivery within 24 to 48 hours

User Review

Thank you for the data! The numbers are exactly what we asked for and what we need to build our business case.

Materials Scientist
(privacy requested)

User Review

The report was an excellent overview of the Industrial Burners market. This report does a great job of breaking everything down into manageable chunks.

Imre Hof
Management Assistant, Bekaert

cr-clients-logos

Request Sample