Market Overview:
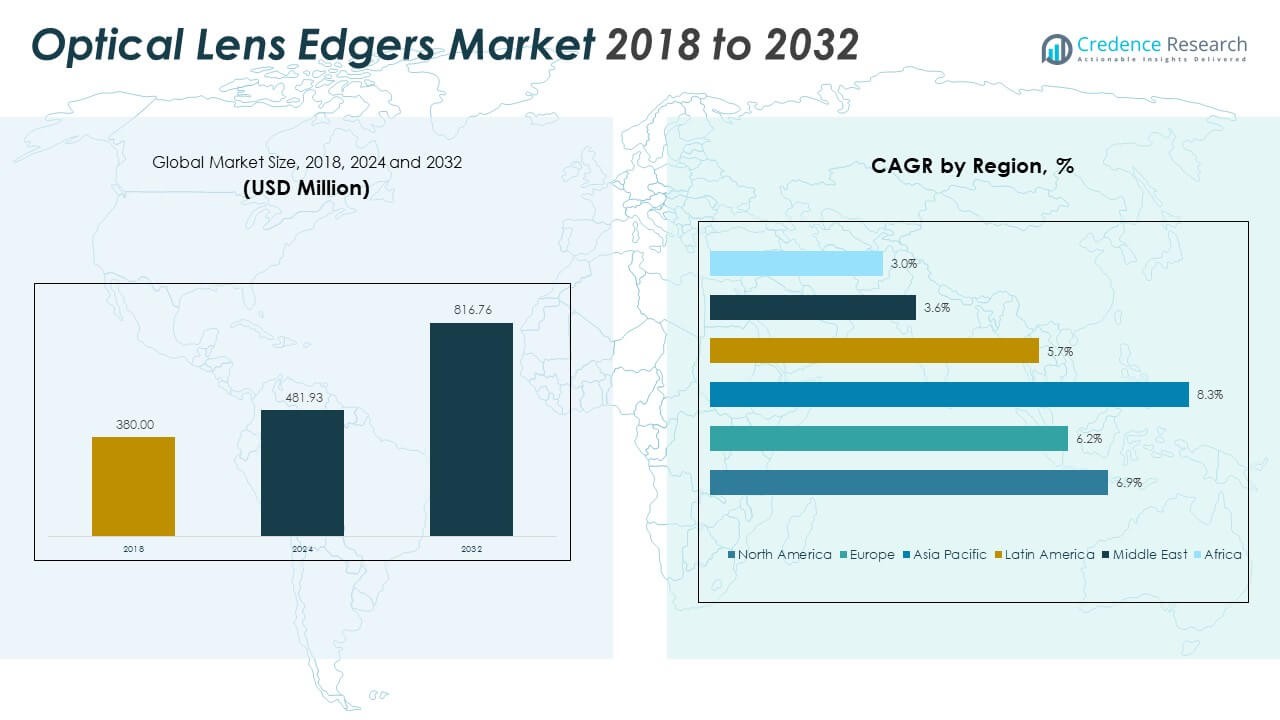
The Optical Lens Edgers Market size was valued at USD 380.00 million in 2018 to USD 481.93 million in 2024 and is anticipated to reach USD 816.76 million by 2032, at a CAGR of 6.88% during the forecast period.
| REPORT ATTRIBUTE |
DETAILS |
| Historical Period |
2020-2023 |
| Base Year |
2024 |
| Forecast Period |
2025-2032 |
| Optical Lens Edgers Market Size 2024 |
USD 481.93 Million |
| Optical Lens Edgers Market , CAGR |
6.88% |
| Optical Lens Edgers Market Size 2032 |
USD 816.76 Million |
Market expansion is driven by growing demand for prescription eyewear, rising cases of myopia and hypermetropia, and advancements in automated lens edging technology. Integration of AI-based precision systems and compact digital edgers improves productivity and accuracy across optical workshops. Increased adoption of smart optical devices, coupled with the rise of e-commerce eyewear platforms, supports wider product accessibility and enhances industry competitiveness. It also benefits from higher replacement rates of manual systems with fully automated machines in labs and retail chains.
North America leads the global market, supported by strong digital infrastructure and established optical manufacturing networks. Europe follows with robust technological innovation and strong regulatory frameworks promoting quality standards. Asia-Pacific emerges as a high-growth region, driven by expanding optical retail chains and increasing disposable income in countries such as China, India, and Japan. Latin America and the Middle East show steady adoption, while Africa records gradual progress supported by improved healthcare access and optical awareness programs.
Access crucial information at unmatched prices!
Request your sample report today & start making informed decisions powered by Credence Research Inc.!
Download Sample
Market Insights:
- The Optical Lens Edgers Market was valued at USD 380.00 million in 2018, reached USD 481.93 million in 2024, and is projected to hit USD 816.76 million by 2032, expanding at a CAGR of 6.88%.
- North America leads with a 37% share due to advanced optical manufacturing, high R&D investment, and wide adoption of AI-enabled lens edging systems.
- Europe follows with 26% share, supported by strong regulatory standards, innovation in precision optics, and a mature retail network.
- Asia Pacific holds 24% share and remains the fastest-growing region, driven by rising eyewear demand, expanding optical retail chains, and affordability of automated edgers.
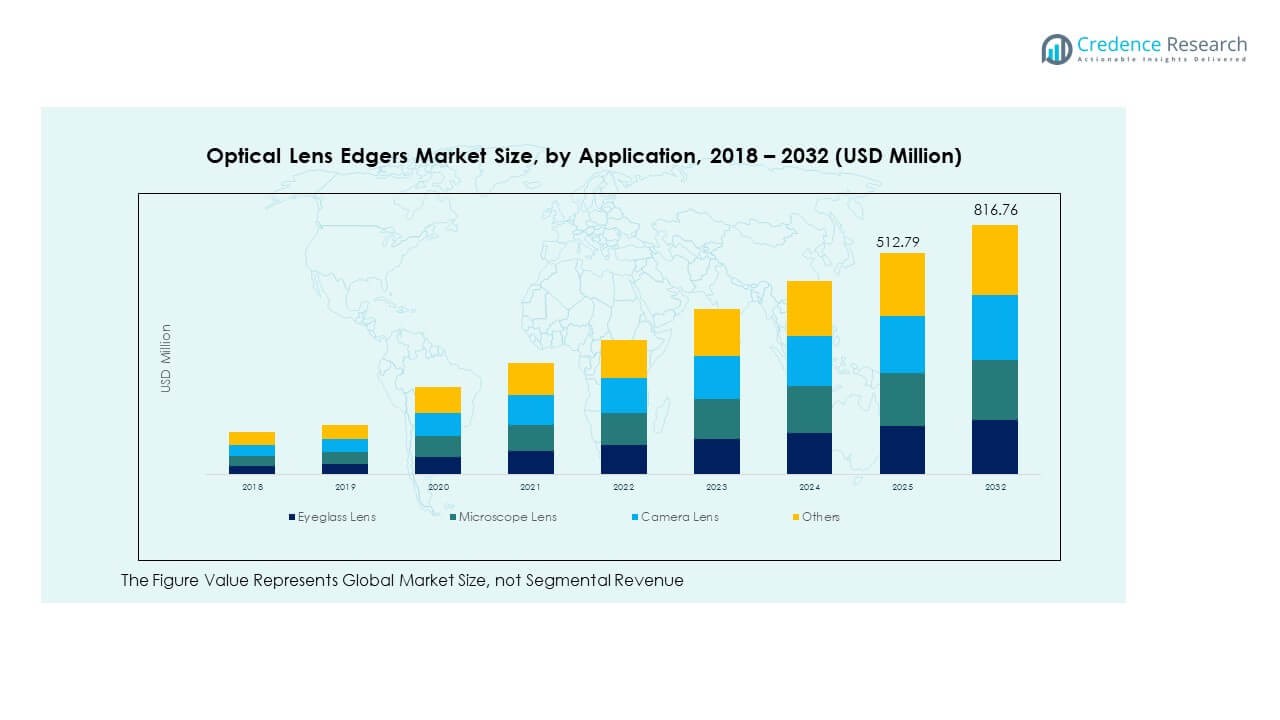
- Eyeglass lenses dominate with 45% market share, followed by microscope and camera lenses at 30% and 20%, respectively, reflecting steady diversification of optical applications.
Market Drivers
Rising Global Demand for Prescription Eyewear and Vision Correction Devices
The Optical Lens Edgers Market experiences strong growth due to the increasing number of people with vision impairments worldwide. Aging populations and prolonged screen exposure are key contributors to the rising demand for corrective eyewear. Manufacturers focus on precision, speed, and customization in edging technology to meet optical standards. Demand for prescription glasses and sunglasses continues to expand across developed and developing nations. Integration of digital lens processing and auto-calibration enhances operational efficiency. It supports consistent lens finishing and minimal error rates. The growth in optometry practices and retail outlets fuels equipment replacement cycles. This creates long-term opportunities for advanced lens edging systems.
Technological Advancements in Automated Lens Processing Systems
Automated edgers with AI integration and digital alignment functions transform optical manufacturing. Advanced machines reduce human error and improve lens-fitting accuracy, enhancing quality and productivity. The Optical Lens Edgers Market benefits from technological innovations like 3D mapping and patternless edging. Smart sensors and real-time calibration ensure precise lens cutting across different materials. AI algorithms optimize lens shaping for improved customer satisfaction. It encourages manufacturers to develop compact and multi-functional systems for retail and lab environments. Automation reduces manual effort and increases throughput, improving return on investment. The shift toward digital precision drives sustained adoption across optical workshops.
- For example, NIDEK Co., Ltd. launched the ME-1500 multifunction lens edger in October 2020, featuring advanced 3D drilling, high base curve processing, and mini beveling capabilities. The system enhances precision and flexibility for optical laboratories, supporting a wide range of lens materials and frame designs.
Growing Penetration of Retail Optical Chains and E-Commerce Platforms
Expanding optical retail networks and e-commerce penetration significantly support market expansion. The Optical Lens Edgers Market gains momentum from rising consumer access to affordable eyewear through online channels. Retailers invest in compact and user-friendly edgers to meet diverse order demands quickly. Efficient in-store edging systems allow same-day eyewear delivery, enhancing customer satisfaction. Independent optical stores adopt semi-automatic models to maintain flexibility and reduce production costs. It allows faster response to personalized orders and frame adjustments. Regional players leverage partnerships with global manufacturers to access high-precision systems. The trend creates a wider product footprint across local markets.
Rising Preference for Customized and Aesthetic Optical Solutions
Consumers increasingly seek personalized eyewear designs that combine comfort and aesthetics. The Optical Lens Edgers Market aligns with this shift by offering precision tools that support advanced customization. Digital lens shaping allows optical professionals to design complex frame curves and stylish edges. Smart edgers help produce lightweight lenses without compromising optical accuracy. It improves the fit, clarity, and overall look of the eyewear. Luxury eyewear brands and boutique optical labs rely on edgers for tailored production. Demand for fashionable frames and coatings fuels innovation in material compatibility. This shift toward customization supports premium product segments globally.
- For example, Topcon Corporation offers the ALE-5100 series automatic lens edgers, designed for precise and efficient lens processing in optical laboratories. The system supports advanced lens shapes and materials, delivering consistent accuracy and high-quality finishing for eyewear production.
Market Trends
Adoption of AI-Enabled and IoT-Integrated Lens Edging Technologies
Integration of AI and IoT significantly reshapes modern optical manufacturing processes. The Optical Lens Edgers Market evolves with smart edgers capable of real-time diagnostics and performance optimization. AI-driven software enhances precision and automates pattern recognition for complex frames. Cloud-based connectivity allows remote monitoring and predictive maintenance for optical workshops. It helps manufacturers reduce downtime and improve service efficiency. Data analytics integration supports better quality control across production batches. Advanced sensors adjust automatically to lens curvature and coating thickness. The continuous upgrade of smart functionalities makes digital edgers the industry standard.
- For example, Coburn Technologies, in partnership with Huvitz, offers advanced lens edging systems such as the HPE-910 and HPE-990 series, designed for high-precision lens processing. These models feature automated calibration, adaptive beveling, and user-friendly interfaces that enhance productivity in optical laboratories.
Sustainability and Eco-Efficient Manufacturing in Optical Equipment
Growing environmental awareness drives manufacturers toward sustainable production practices. The Optical Lens Edgers Market witnesses the adoption of eco-friendly materials and energy-efficient systems. Manufacturers design edgers that minimize waste and use recyclable components. Compact models consume less power and water during the edging process. It aligns with sustainability goals set by international eyewear brands. The move toward green manufacturing strengthens brand reputation and operational efficiency. Equipment with advanced filtration systems reduces microplastic emissions. Sustainable practices redefine competitiveness among global optical equipment producers.
Integration of Cloud-Based Workflow Management and Smart Connectivity
Cloud-based software integration streamlines production workflows and inventory management. The Optical Lens Edgers Market benefits from systems that connect seamlessly with optical lab management software. Remote access enables real-time job tracking and performance analytics. Automated data synchronization improves operational consistency between multiple retail outlets. It enhances transparency in production and delivery timelines. Smart connectivity allows instant updates and troubleshooting through digital dashboards. Cloud integration supports scalability for both small retailers and large optical chains. The trend ensures faster adaptation to digital retail transformation.
Expansion of Compact, Portable, and Multi-Functional Edging Devices
Miniaturization and versatility dominate product development strategies. The Optical Lens Edgers Market adapts to growing space constraints in optical stores. Manufacturers introduce compact tabletop models with multifunctional capabilities. These systems handle diverse lens materials, coatings, and frame types. It enables high flexibility for both retail and laboratory applications. Portable designs appeal to small clinics and mobile optical units. Enhanced usability and easy maintenance increase operational reliability. The demand for plug-and-play models supports market penetration in emerging regions.
- For instance, Briot Optical’s Alta Evolution is a high-precision lens finishing system featuring Gravitech® optical tracing technology and automatic calibration for accurate lens centering and edging. It supports a wide range of lens materials and is designed to enhance efficiency in optical laboratories.
Market Challenges Analysis
High Initial Cost of Advanced Edging Systems and Maintenance Requirements
High capital investment limits the adoption of advanced edgers, especially among small optical retailers. The Optical Lens Edgers Market faces financial barriers due to expensive software integration and precision tooling. Smaller businesses find it difficult to recover costs without high daily throughput. Continuous software upgrades and skilled operator training add operational expenses. It increases dependency on manufacturers for technical support. Maintenance costs for calibration and spare components remain substantial. Limited access to affordable financing restricts expansion in developing economies. This challenge restrains widespread technological adoption among cost-sensitive users.
Lack of Skilled Workforce and Complex Operational Processes
Operating automated and digital edgers requires technical proficiency. The Optical Lens Edgers Market contends with skill shortages in many developing countries. Inexperienced operators risk reducing lens precision and increasing waste. Training programs remain insufficient to meet rising demand for advanced optical services. It delays workflow efficiency and hinders service quality. Manual intervention still dominates small-scale operations, limiting process automation. The learning curve for AI-driven systems is steep for untrained personnel. Insufficient training support slows modernization across retail and laboratory environments.
Market Opportunities
Rising Demand for Smart Eyewear and Digital Vision Solutions
Growing interest in smart eyewear and AR-integrated glasses creates strong opportunities for innovation. The Optical Lens Edgers Market gains from increased demand for precision devices that process advanced lens geometries. Manufacturers explore partnerships with tech firms to develop edge-compatible lenses for digital eyewear. It helps bridge the gap between fashion and function in optical design. Expansion of lifestyle-oriented eyewear promotes higher-value sales in premium categories. Integration of connectivity and sensor-enabled lenses fuels next-generation product development.
Expansion Potential in Emerging Economies Through Affordable Automation
Emerging regions such as Asia-Pacific, Latin America, and the Middle East offer major growth potential. The Optical Lens Edgers Market finds opportunities through affordable, mid-range, and modular systems. Local optical chains and clinics seek cost-effective solutions to upgrade production efficiency. It allows smaller businesses to access digital precision at lower capital outlay. Partnerships between regional distributors and global brands increase accessibility. Growing awareness of vision care and urban retail expansion enhances adoption across developing markets.
Market Segmentation Analysis:
The Optical Lens Edgers Market is segmented
By type into manual, automatic, and semi-automatic edgers. Automatic edgers hold a dominant position due to their high precision, speed, and ease of operation in optical labs and retail stores. These machines integrate digital alignment and AI-based calibration, reducing human error and improving production consistency. Semi-automatic edgers serve mid-scale retailers and regional workshops requiring flexibility and moderate automation. Manual edgers remain relevant in small optical stores and developing regions, offering affordability and simple maintenance for low-volume lens processing. It continues to see technological upgrades focused on precision control and user-friendly interfaces.
- For instance, Topcon Corporation offers a range of lens edgers and optical instruments designed for high-precision lens measurement and processing. Its systems are widely used in optical labs and retail settings to ensure consistent lens alignment, accurate edging, and improved workflow efficiency.
By application, the market includes eyeglass lens, microscope lens, camera lens, and others. Eyeglass lens applications account for the largest share, supported by increasing prescription eyewear demand and the rise of fashion-driven lens customization. Microscope lens edging grows with higher investments in research laboratories and medical imaging systems. The camera lens segment benefits from expanding digital photography and optical device manufacturing. Other applications, such as industrial optics and specialty lenses, show steady adoption with niche precision requirements. It benefits from innovations in compact designs, multi-material compatibility, and enhanced automation across production facilities.
- For example, ZEISS Microscopy operates advanced lens manufacturing and polishing facilities at its Jena plant in Germany, where it utilizes precision robotic systems to enhance optical quality and production efficiency. These technologies support ZEISS in delivering high-performance lenses for microscopy and life science applications.
Segmentation:
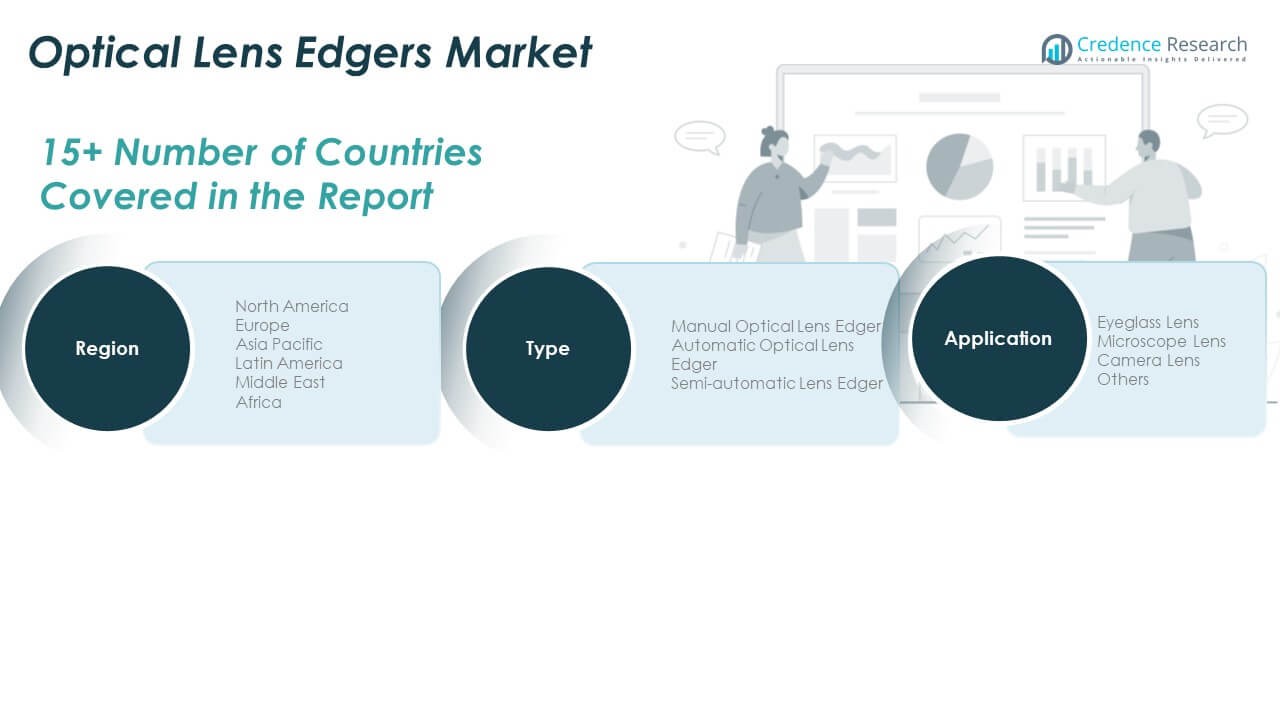
By Type
- Manual Optical Lens Edger
- Automatic Optical Lens Edger
- Semi-automatic Lens Edger
By Application
- Eyeglass Lens
- Microscope Lens
- Camera Lens
- Others
By Region
- North America
- Europe
- Germany
- France
- U.K.
- Italy
- Spain
- Rest of Europe
- Asia Pacific
- China
- Japan
- India
- South Korea
- South-east Asia
- Rest of Asia Pacific
- Latin America
- Brazil
- Argentina
- Rest of Latin America
- Middle East & Africa
- GCC Countries
- South Africa
- Rest of the Middle East and Africa
Regional Analysis:
North America
The North America Optical Lens Edgers Market size was valued at USD 155.23 million in 2018 to USD 194.74 million in 2024 and is anticipated to reach USD 329.65 million by 2032, at a CAGR of 6.9% during the forecast period. North America accounts for a 37% share of the global market. The region leads due to a strong presence of optical technology manufacturers and advanced healthcare infrastructure. Demand for automated lens edgers rises with expanding eyewear retail networks and the growing prevalence of vision correction needs. The U.S. dominates the regional landscape with large-scale adoption of AI-enabled optical devices. Canada contributes through steady investments in optical equipment distribution. It benefits from government initiatives supporting digital transformation in medical and optical services. Product innovation and high purchasing power strengthen North America’s competitive position in the global market.
Europe
The Europe Optical Lens Edgers Market size was valued at USD 108.11 million in 2018 to USD 132.18 million in 2024 and is anticipated to reach USD 212.56 million by 2032, at a CAGR of 6.2% during the forecast period. Europe holds a 26% share of the market. Strong regulatory frameworks and the presence of established eyewear brands drive product standardization and quality control. Germany, France, and the UK lead in technology integration and advanced optical retail models. It benefits from consistent R&D funding in precision engineering and automation. The adoption of semi-automatic edgers remains strong in independent optical labs. Sustainable design trends and material recycling initiatives promote eco-efficient equipment. Europe maintains stability in growth through innovation-focused policies and export-oriented manufacturers.
Asia Pacific
The Asia Pacific Optical Lens Edgers Market size was valued at USD 85.73 million in 2018 to USD 113.95 million in 2024 and is anticipated to reach USD 214.73 million by 2032, at a CAGR of 8.3% during the forecast period. Asia Pacific captures a 24% share of the global market. Expanding middle-class populations and rising vision correction awareness drive eyewear sales across China, Japan, and India. The region’s optical manufacturing sector grows rapidly with automation and local production incentives. It benefits from increased retail penetration and strong e-commerce activity in eyewear. Japan and South Korea focus on high-end optical innovation, while India and Southeast Asia expand mid-range optical facilities. The affordability of locally produced systems supports small-scale adoption. Asia Pacific emerges as the fastest-growing regional hub in this industry.
Latin America
The Latin America Optical Lens Edgers Market size was valued at USD 19.76 million in 2018 to USD 24.77 million in 2024 and is anticipated to reach USD 38.28 million by 2032, at a CAGR of 5.7% during the forecast period. Latin America contributes a 7% market share. Growth is driven by increasing healthcare investments and optical retail expansion in Brazil and Mexico. The region sees growing adoption of compact and affordable edgers for local optical stores. It benefits from partnerships between distributors and global manufacturers offering technical support and financing solutions. Rising consumer awareness of vision care supports the adoption of prescription lenses. Local distributors strengthen market access through tailored sales networks. Government programs for vision screening create steady demand for cost-effective optical devices.
Middle East
The Middle East Optical Lens Edgers Market size was valued at USD 6.84 million in 2018 to USD 7.51 million in 2024 and is anticipated to reach USD 9.89 million by 2032, at a CAGR of 3.6% during the forecast period. The region holds a 4% market share. Demand for modern optical equipment grows in Gulf Cooperation Council countries, supported by healthcare diversification initiatives. High-income consumers in the UAE and Saudi Arabia favor premium eyewear and advanced optical precision. It experiences moderate growth due to limited local manufacturing capacity. International suppliers dominate sales through partnerships with optical chains. Retail expansion in malls and hospitals increases the need for fast lens processing systems. Government focus on healthcare modernization supports gradual equipment adoption across the region.
Africa
The Africa Optical Lens Edgers Market size was valued at USD 4.33 million in 2018 to USD 8.77 million in 2024 and is anticipated to reach USD 11.65 million by 2032, at a CAGR of 3.0% during the forecast period. Africa accounts for a 2% market share. Market growth is supported by expanding optical retail presence in South Africa and Egypt. It benefits from government-led eye health programs promoting basic vision correction. Limited access to advanced optical machinery restrains high-end market penetration. Local distributors rely on mid-range and semi-automatic systems for cost efficiency. Training and awareness initiatives by NGOs improve optical service quality. Increasing disposable income supports long-term opportunities for retail optical growth in urban centers.
Shape Your Report to Specific Countries or Regions & Enjoy 30% Off!
Key Player Analysis:
Competitive Analysis:
The Optical Lens Edgers Market is characterized by strong competition among established global manufacturers focusing on innovation, precision, and automation. Key players include Essilor International S.A., Topcon Corporation, NIDEK CO., LTD., Coburn Technologies, Inc., Huvitz Corp., Santinelli International, INNOVA Medical Ophthalmics, Inc., and Shanghai Supore Instruments Co. Ltd. These companies emphasize advanced lens processing technologies, compact system designs, and digital alignment accuracy to maintain market leadership. It invests in research to enhance speed, quality, and material compatibility. Strategic collaborations, product launches, and regional expansions strengthen brand positioning across developed and emerging economies. Continuous advancements in AI-based edging, IoT connectivity, and energy-efficient systems shape future competition. Firms focusing on after-sales support and software integration gain a stronger foothold in optical laboratories and retail environments.
Recent Developments:
- In October 2025, Topcon Healthcare, Inc. advanced its position in the optical lens edgers market by acquiring Toku, Inc., an innovative developer specializing in non-invasive artificial intelligence-based ocular data platforms. This strategic acquisition aims to accelerate regulatory clearance and commercialization of Toku’s investigational platforms, particularly focusing on oculomics solutions that will complement Topcon’s existing Harmony cloud-based digital health platform.
- In August 2025, NIDEK CO., LTD. made headlines with the launch of the AutoTint automated dry laser tinting system, broadening its suite of lens processing products for the global ophthalmic market. This launch is aligned with the company’s longstanding commitment to technological innovation in lens edging and customization, offering opticians and laboratories enhanced options for automated tinting and processing of optical lenses.
- In August 2025, EssilorLuxottica, parent company of Essilor International S.A., announced the acquisition of Automation & Robotics (A&R), a specialist in the design and manufacture of advanced lens processing systems. This move reinforces EssilorLuxottica’s portfolio in medical device technology and accelerates its ability to deliver innovative lens edging and finishing solutions to optical professionals worldwide.
Report Coverage:
The research report offers an in-depth analysis based on Type and Application. It details leading market players, providing an overview of their business, product offerings, investments, revenue streams, and key applications. Additionally, the report includes insights into the competitive environment, SWOT analysis, current market trends, as well as the primary drivers and constraints. Furthermore, it discusses various factors that have driven market expansion in recent years. The report also explores market dynamics, regulatory scenarios, and technological advancements that are shaping the industry. It assesses the impact of external factors and global economic changes on market growth. Lastly, it provides strategic recommendations for new entrants and established companies to navigate the complexities of the market.
Future Outlook:
- Advancements in digital automation will redefine lens edging precision and efficiency standards globally.
- Integration of AI and IoT capabilities will enhance predictive maintenance and system reliability.
- Rising consumer demand for customized eyewear will strengthen adoption of compact and smart edgers.
- Expansion of optical retail chains in developing economies will create new equipment installation opportunities.
- Manufacturers will focus on sustainable, low-energy designs to meet environmental and operational efficiency targets.
- Growing healthcare awareness and vision correction needs will support steady demand in high-volume regions.
- Increasing affordability of mid-range automatic systems will encourage adoption among small optical labs.
- Strategic collaborations between optical device producers and technology firms will drive innovation in automation.
- Continued investment in R&D will lead to multifunctional edgers with enhanced lens compatibility and speed.
- Global market competition will intensify as regional players scale production and expand distribution networks.


