Market Overview
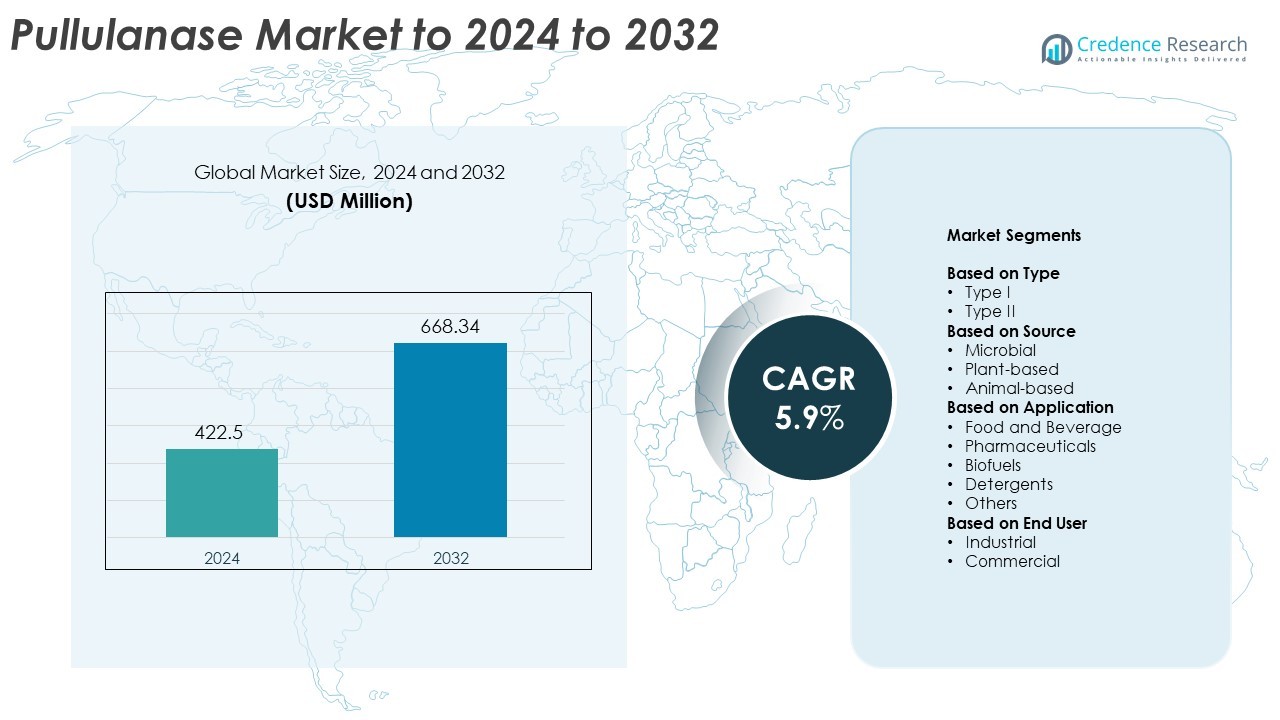
Pullulanase Market size was valued at USD 422.5 million in 2024 and is anticipated to reach USD 668.34 million by 2032, at a CAGR of 5.9% during the forecast period.
| REPORT ATTRIBUTE |
DETAILS |
| Historical Period |
2020-2023 |
| Base Year |
2024 |
| Forecast Period |
2025-2032 |
| Pullulanase Market Size 2024 |
USD 422.5 Million |
| Pullulanase Market, CAGR |
5.9% |
| Pullulanase Market Size 2032 |
USD 668.34 Million |
The pullulanase market includes major players such as Sunson Industry Group Co., Ltd., Novozymes A/S, Biocatalysts Ltd., Shandong Longda Bio-Products Co., Ltd., Thermo Fisher Scientific, Jiangsu Boli Bioproducts Co., Ltd., DuPont de Nemours, Inc., Specialty Enzymes & Biotechnologies Co., Amano Enzyme Inc., and AB Enzymes GmbH. These companies compete through advanced fermentation processes, high-efficiency enzyme variants, and expanded application coverage across food processing, biofuels, and pharmaceuticals. North America led the global market in 2024 with about 34% share, supported by strong industrial enzyme usage, well-established biotechnology infrastructure, and rising demand for optimized starch conversion systems.
Access crucial information at unmatched prices!
Request your sample report today & start making informed decisions powered by Credence Research Inc.!
Download Sample
Market Insights
- The pullulanase market was valued at USD 422.5 million in 2024 and is projected to reach USD 668.34 million by 2032, growing at a CAGR of 5.9%.
- Growing demand for advanced starch processing in food and beverage production drives adoption, with Type I enzymes holding about 62% share due to higher conversion efficiency.
- Trends show strong movement toward microbial enzyme production and cost-efficient fermentation systems, supporting wider use in sweeteners, brewing, and biofuel applications.
- Competition remains active as global manufacturers enhance strain performance, improve purification methods, and expand partnerships with food processors and biofuel facilities.
- North America led with around 34% share, followed by Asia Pacific at 30% and Europe at 28%, while food and beverage remained the dominant application segment with nearly 48% share in 2024.
Market Segmentation Analysis:
By Type
Type I dominated the pullulanase market in 2024 with about 62% share. This enzyme type gained strong demand because manufacturers rely on its high specificity for starch debranching in brewing, sweetener production, and food processing. Type I pullulanase supports efficient hydrolysis, which improves glucose yield and reduces processing time. Many companies prefer this type due to its stable activity and compatibility with existing industrial fermentation systems. Type II recorded steady use in niche operations, but Type I remained ahead because it delivers consistent results and supports large-scale production needs.
- For instance, Merck (Sigma-Aldrich) sells microbial pullulanase E2412 with specific activity ≥1,000 NPUN/g. The product is stored at 2–8 degrees Celsius for stability.
By Source
Microbial pullulanase led the market in 2024 with nearly 71% share. Microbial sources remained preferred because they offer reliable enzyme yield, short production cycles, and strong stability across pH and temperature ranges. Industrial users favored microbial pullulanase due to its cost-effective fermentation and easy scalability for food processing, biofuel production, and pharmaceutical applications. Plant-based and animal-based sources saw limited uptake because they require complex extraction and offer lower enzyme concentration. Microbial pullulanase stayed dominant as manufacturers focused on optimized strains and controlled fermentation systems.
- For instance, Shandong Lonct: Offers liquid pullulanase products with activities of 1,000 U/mL and 2,000 U/mL in plastic drums.
By Application
Food and beverage was the leading application segment in 2024 with about 48% share. Producers used pullulanase widely to enhance starch breakdown, improve sweetness levels, and boost production efficiency in brewing, baking, and syrup manufacturing. Strong adoption came from growing demand for high-purity glucose syrups and improved texture in processed foods. Pharmaceuticals, biofuels, and detergents expanded gradually, but food and beverage kept the top position because it requires consistent enzyme quality and benefits the most from improved saccharification performance.
Key Growth Drivers
Rising Use in Starch Processing
Demand for pullulanase continued to grow as starch processors expanded production of maltose syrups, high-glucose syrups, and brewing ingredients. The enzyme enables deeper starch debranching, which improves conversion efficiency and shortens processing cycles. Food and beverage manufacturers adopted pullulanase to achieve better product consistency, stable sweetness levels, and reduced energy use. Rising consumption of processed foods, bakery products, and ready-to-drink beverages further supported market growth. Large producers also invested in enzyme optimization to meet quality needs in high-volume operations.
- For instance, Jiangsu Boli Bioproducts Co., Ltd. produces commercial liquid pullulanase products that are effective for high-glucose and high-maltose syrup production. These industrial enzymes typically have high concentrations suitable for large-scale production. Literature on this application confirms that pullulanase works effectively in an optimal pH range of approximately 4.2 to 4.6, a condition maintained in industrial corn syrup processes.
Expansion of Biofuel Production
Biofuel plants increasingly used pullulanase to enhance saccharification performance and raise fermentable sugar yield from starch-based feedstocks. The enzyme reduces viscosity, improves conversion rates, and supports smoother fermentation workflows at industrial scale. Many governments expanded ethanol blending mandates, driving stronger interest in enzymes that improve cost efficiency. Pullulanase gained traction because it supports high-temperature processes and integrates well with existing enzyme blends. Growing focus on low-carbon energy sources created additional demand from both established and emerging biofuel facilities.
- For instance, the technical data sheet for Sunson Industry Group’s PUL2 pullulanase enzyme, which is marketed for ethanol yield in the alcohol industry, lists the optimum working temperature range between 45°C and 52°C. The total activity temperature range for the enzyme is noted as 20°C to 60°C.
Growing Pharmaceutical Applications
Pharmaceutical manufacturers expanded pullulanase use for controlled hydrolysis steps in drug development and specialized bioprocessing operations. The enzyme offers precise reaction control, which supports consistent molecular modifications and stable product quality. Pullulanase also fits well within regulated manufacturing setups due to its strong purity profile and compatibility with clean production systems. Rising investment in enzyme-assisted synthesis and biologics increased demand across major pharma hubs. Companies developed high-purity variants to meet strict regulatory expectations, further strengthening adoption in advanced drug formulation workflows.
Key Trends & Opportunities
Shift Toward Microbial Enzyme Production
Microbial pullulanase gained wider acceptance because microbial strains offer stable yields, shorter cultivation cycles, and higher enzyme concentration than plant- or animal-based sources. Companies invested in microbial strain engineering to enhance thermostability, reduce impurities, and support continuous fermentation. This trend opened opportunities for large-scale integration in brewing, sweetener manufacturing, detergents, and biofuels. Improved fermentation technology, including automated bioreactors and optimized nutrient media, supported lower production costs and expanded global supply capacity.
- For instance, Shandong Longda Bio-Products Co., Ltd. (via its subsidiary Lonct Enzymes) reports holding more than 90 national invention patents and 7 utility model patents, with this extensive intellectual property portfolio covering various enzyme products including pullulanase, glucoamylase, and amylase.
Adoption of Cost-Efficient Industrial Processes
Industries adopted pullulanase to streamline operations, reduce raw material use, and increase output across high-volume production lines. The enzyme enhanced reaction efficiency in breweries, starch refineries, and sweetener plants, supporting consistent product quality. Manufacturers explored combining pullulanase with glucoamylase and other enzymes to unlock higher conversion yields. Rising demand for low-waste, energy-efficient manufacturing created space for new enzyme solutions tailored to industrial needs. Opportunities also emerged for customized enzyme blends adapted to regional processing conditions.
- For instance, Amano Enzyme (part of Amano Pharmaceuticals) supplies thermostable pullulanase enzymes, such as KLEISTASE PL45, which are widely used in the industrial production of glucose and maltose syrups, often as part of a multi-enzyme cocktail for efficient starch processing. These enzymes are typically used in the starch saccharification step at optimal conditions within a temperature range around 60°C and a pH range around 4.5–5.5.
Key Challenges
High Production and Purification Costs
Pullulanase manufacturing requires advanced fermentation facilities, strict environmental controls, and specialized purification systems that raise overall production expense. High-purity enzyme forms used in pharmaceuticals demand even tighter quality steps, further increasing cost. Smaller producers face major barriers due to capital requirements and operational complexity. These cost pressures restrict adoption in price-sensitive regions and slow entry into new application areas. Companies continue exploring cost-reduction strategies, but scalability remains a core challenge for many players.
Regulatory and Quality Compliance Issues
Pullulanase suppliers must navigate complex regulatory frameworks governing enzyme use in food, pharmaceuticals, and industrial processes. Approval timelines vary widely across regions, increasing compliance workload and delaying commercialization. Maintaining batch-to-batch consistency, ensuring traceability, and meeting safety certifications add further operational strain. These requirements raise development costs and limit flexibility in introducing modified or enhanced enzyme variants. Regulatory scrutiny remains especially high in food and drug sectors, making compliance a persistent market challenge.
Regional Analysis
North America
North America held about 34% share of the pullulanase market in 2024. Demand grew as food and beverage manufacturers expanded the use of starch‐processing enzymes in syrups, brewing, and baked goods. The U.S. remained the largest contributor due to strong enzyme research activity and well-established fermentation industries. Biofuel producers also increased enzyme adoption to improve conversion efficiency, supporting broader regional growth. Canada showed steady usage across brewing and specialty food segments. Strong regulatory support for advanced processing technologies helped North America maintain a leading position in commercial enzyme applications.
Europe
Europe accounted for nearly 28% share in 2024, driven by strong demand from starch refiners, breweries, and pharmaceutical manufacturers. Countries such as Germany, Denmark, and the Netherlands led commercial enzyme adoption due to advanced biotechnology ecosystems. The region showed growing interest in microbial enzyme variants that support clean-label and efficient processing. Pullulanase gained wider acceptance in sugar reduction applications and specialty carbohydrate production. Growing focus on sustainable manufacturing and energy-efficient operations supported further enzyme use across regulated industries. Europe remained a mature but steadily expanding market with strong technology integration.
Asia Pacific
Asia Pacific captured around 30% share in 2024, supported by rapid industrial expansion and strong presence of starch processing facilities. China and India drove major demand as manufacturers scaled up sweetener production and low-cost fermentation operations. The region benefited from rising processed food consumption and growing investments in enzyme-based brewing technologies. Biofuel initiatives also supported enzyme use in emerging markets across Southeast Asia. Strong regional growth stemmed from lower production costs, expanding industrial capacity, and increasing adoption of microbial pullulanase. Asia Pacific remained the fastest-growing market due to strong manufacturing momentum.
Latin America
Latin America held about 5% share in 2024, with gradual growth from food processing, brewing, and industrial fermentation sectors. Brazil and Mexico recorded highest adoption due to expanding beverage production and rising starch modification activities. Regional interest in cost-efficient enzymes supported moderate demand, especially in mid-scale starch mills. Limited local manufacturing kept import dependence high, but rising industrial modernization encouraged wider enzyme use. Biofuel initiatives in Brazil created additional pullulanase applications. Despite a smaller base, Latin America continued to show stable expansion driven by evolving food and industrial markets.
Middle East & Africa
Middle East & Africa accounted for nearly 3% share in 2024, with emerging demand concentrated in food processing and brewing industries. Countries such as South Africa and the UAE increased adoption for specialty syrup production and industrial fermentation. Market growth remained steady as companies explored enzyme solutions to improve process efficiency and reduce energy use. Limited local enzyme production pushed reliance on imports, but rising investment in food manufacturing strengthened market activity. Biofuel interest in selected regions also created early opportunities, keeping pullulanase demand on a gradual upward trajectory.
Market Segmentations:
By Type
By Source
- Microbial
- Plant-based
- Animal-based
By Application
- Food and Beverage
- Pharmaceuticals
- Biofuels
- Detergents
- Others
By End User
By Geography
- North America
- Europe
- Germany
- France
- U.K.
- Italy
- Spain
- Rest of Europe
- Asia Pacific
- China
- Japan
- India
- South Korea
- South-east Asia
- Rest of Asia Pacific
- Latin America
- Brazil
- Argentina
- Rest of Latin America
- Middle East & Africa
- GCC Countries
- South Africa
- Rest of the Middle East and Afric
Competitive Landscape
The pullulanase market is shaped by key players such as Sunson Industry Group Co., Ltd., Novozymes A/S, Biocatalysts Ltd., Shandong Longda Bio-Products Co., Ltd., Thermo Fisher Scientific, Jiangsu Boli Bioproducts Co., Ltd., DuPont de Nemours, Inc., Specialty Enzymes & Biotechnologies Co., Amano Enzyme Inc., and AB Enzymes GmbH. The competitive landscape features companies focusing on advanced fermentation technologies, high-purity enzyme development, and improved thermostability to meet rising global processing needs. Many manufacturers invest in strain engineering and process optimization to enhance production efficiency and consistency. Partnerships with food, biofuel, and pharmaceutical processors help strengthen market presence, while continuous expansion of microbial enzyme portfolios supports wider application coverage. Firms also prioritize regulatory compliance and quality certifications to secure opportunities in highly regulated industries. Growing emphasis on energy-efficient manufacturing, sustainable enzyme solutions, and region-specific product customization continues to guide competitive differentiation across global markets.
Key Player Analysis
- Sunson Industry Group Co., Ltd.
- Novozymes A/S
- Biocatalysts Ltd.
- Shandong Longda Bio-Products Co., Ltd.
- Thermo Fisher Scientific
- Jiangsu Boli Bioproducts Co., Ltd.
- DuPont de Nemours, Inc.
- Specialty Enzymes & Biotechnologies Co.
- Amano Enzyme Inc.
- AB Enzymes GmbH
Recent Developments
- In 2025, AB Enzymes GmbH launched a new corporate design reflecting its growth and innovation in the enzyme industry.
- In 2025, Jiangsu Boli Bioproducts Co., Ltd. showcased innovative pullulanase enzyme products at IBIE 2025, highlighting advances in their corn starch processing enzymes.
- In 2025, Thermo Fisher Scientific announced plans to expand its bioprocess design and customer experience centers in India to support the growing biopharma manufacturing sector and the development of various enzyme solutions.
Shape Your Report to Specific Countries or Regions & Enjoy 30% Off!
Report Coverage
The research report offers an in-depth analysis based on Type, Source, Application, End-User and Geography. It details leading market players, providing an overview of their business, product offerings, investments, revenue streams, and key applications. Additionally, the report includes insights into the competitive environment, SWOT analysis, current market trends, as well as the primary drivers and constraints. Furthermore, it discusses various factors that have driven market expansion in recent years. The report also explores market dynamics, regulatory scenarios, and technological advancements that are shaping the industry. It assesses the impact of external factors and global economic changes on market growth. Lastly, it provides strategic recommendations for new entrants and established companies to navigate the complexities of the market.
Future Outlook
- Demand for pullulanase will rise as starch processing plants expand global capacity.
- Food and beverage companies will increase enzyme use to improve sweetness and texture.
- Biofuel producers will adopt pullulanase to enhance saccharification efficiency in large facilities.
- Microbial enzyme development will accelerate due to strain optimization and cost benefits.
- Pharmaceutical applications will grow as enzyme-assisted synthesis becomes more common.
- Enzyme blends will gain traction, improving overall conversion rates in industrial systems.
- Asia Pacific will continue to outperform other regions with strong manufacturing growth.
- Regulatory clarity will support broader commercial adoption across food and pharma sectors.
- Improved purification technologies will lower production costs and widen market access.
- Global enzyme suppliers will invest in capacity expansion to meet rising cross-industry demand.


