Market Overview:
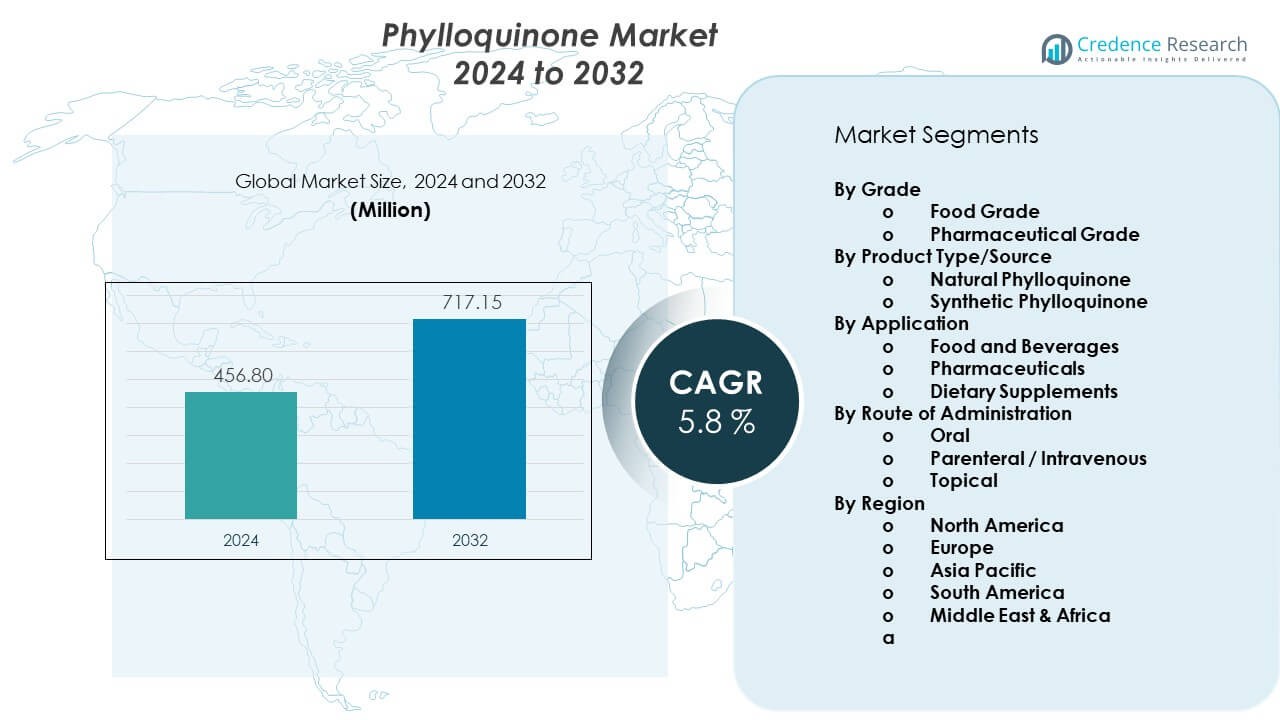
The Phylloquinone Market is projected to grow from USD 456.8 million in 2024 to USD 717.15 million by 2032, with a CAGR of 5.8% from 2024 to 2032.
| REPORT ATTRIBUTE |
DETAILS |
| Historical Period |
2020-2023 |
| Base Year |
2024 |
| Forecast Period |
2025-2032 |
| Phylloquinone Market Size 2024 |
USD 456.8 Million |
| Phylloquinone Market, CAGR |
5.8% |
| Phylloquinone Market Size 2032 |
USD 717.15 Million |
Growing awareness of bone health and cardiovascular wellness drives steady demand for phylloquinone. Supplement makers promote vitamin K1 for improved calcium regulation, which lifts product uptake across sports nutrition and senior care. Pharma firms use phylloquinone in anticoagulation therapy support, which strengthens adoption in clinical settings. Food processors add vitamin K1 to cereals and oils to meet rising clean-label goals. These factors create a stable flow of opportunities across health and wellness channels.
North America leads due to high supplement use, strong retail penetration, and active clinical nutrition programs. Europe holds a major share because of strong regulatory focus on fortified foods and rising usage in preventive care. Asia Pacific emerges as a fast-growing region driven by expanding nutrition awareness, urban lifestyle changes, and rising investment in plant-based vitamin production. Latin America and the Middle East & Africa move gradually, supported by growing interest in affordable nutrition solutions and wider access to fortified food products.
Access crucial information at unmatched prices!
Request your sample report today & start making informed decisions powered by Credence Research Inc.!
Download Sample
Market Insights:
- The Phylloquinone market is projected to grow from USD 456.8 million in 2024 to USD 717.15 million by 2032, recording a CAGR of 5.8% during 2024–2032, driven by wider use in supplements, fortified foods, and clinical therapies.
- North America holds an estimated 34% share due to high supplement penetration, Europe follows with about 28% driven by strong regulatory standards, and Asia Pacific holds nearly 24% supported by rising health awareness and expanding retail access.
- Asia Pacific represents the fastest-growing region with a rising share supported by urban health trends, increasing fortified food demand, and rapid expansion of regional nutrition brands.
- Dietary supplements account for roughly 42% of total segment share, supported by strong preventive-health adoption and broad consumer acceptance.
- Pharmaceutical applications hold an estimated 33% share driven by clinical reliance on vitamin K1 for cardiovascular and bone-health support across regulated medical channels.
Market Drivers:
Rising Global Focus On Bone Strength And Nutritional Wellness Programs
Growing concern over bone density loss pushes strong demand for vitamin K1 across preventive care. Many groups seek formulas that help regulate calcium flow in the body and reduce fracture risks. Hospitals support K1-based therapies to improve patient recovery outcomes. Food companies add K1 to fortified items to support daily intake. Health brands promote cleaner ingredient formats to build trust among new buyers. Plant-based supplements gain traction among younger users. Senior populations support rising repeat purchases. The Phylloquinone market gains steady momentum through rising nutrition awareness.
- For instance, a longitudinal study published in Osteoporosis International found that women with highest dietary vitamin K1 intake had a 30 % lower risk of hip fracture compared to those with lowest intake, over a 5-year follow-up.
Increasing Use Of Vitamin K1 In Heart-Health Support And Clinical Therapies
Cardiologists highlight the role of K1 in improving arterial flexibility, which lifts interest in regulated doses. Many producers launch science-backed blends to meet rising clinical demand. Pharma firms integrate K1 into treatment pathways related to anticoagulation. Research programs show wider benefits of balanced K1 intake, which supports medical adoption. Buyers prefer stable K1 doses in capsule and liquid forms. Hospitals focus on verified purity levels for safe use. Nutritionists advise K1-rich diets to strengthen long-term wellness. The Phylloquinone market expands with broader integration across healthcare.
- For instance, research has established a strong association between low vitamin K levels and increased arterial calcification and stiffness. A clinical trial published in the American Journal of Clinical Nutritionfocused on the effect of 3 years of menaquinone-7 (vitamin K2) supplementation on arterial stiffness
Growing Demand For Natural Sources And Plant-Derived Vitamin K1 Ingredients
Consumers lean toward natural K1 derived from green plants, algae, and botanical extracts. Clean-label demand pushes firms to avoid synthetic additives and promote transparent sourcing. Producers develop eco-friendly extraction methods to support rising sustainability expectations. Many brands highlight organic certification to lift product appeal. Firms invest in better processing lines to protect nutrient quality. Retailers promote plant-origin vitamins across mainstream shelves. Younger users prefer vegan formulas for daily routines. The Phylloquinone market benefits from rising plant-based product interest.
Rising Adoption Of K1-Fortified Foods Across Mass Retail And Everyday Diets
Food companies add vitamin K1 to oils, cereals, and ready-to-eat items to support dietary enrichment. Many households accept fortified products due to rising health alerts from clinicians. Retail chains expand shelf space for new fortified varieties. Producers improve stability profiles to maintain nutrient levels during storage. Governments support awareness drives that highlight K1-linked wellness benefits. Marketing teams promote stronger clarity on usage guidelines. Consumers support repeat purchases due to familiar formats. The Phylloquinone market strengthens its position in daily nutrition segments.
Market Trends:
Shift Toward Microencapsulated Vitamin K1 For Higher Stability And Better Absorption
Manufacturers adopt microencapsulation to protect K1 from oxidation during transport and storage. This step helps brands maintain potency in complex formulations. Pharma firms apply stable microcapsules in controlled-dose therapies. Supplement makers promote enhanced absorption to differentiate new products. R&D teams refine coating materials to improve release timing. Retailers highlight premium stability on product labels. This trend attracts buyers who seek consistent nutrient delivery. The Phylloquinone market benefits from steady innovation in delivery forms.
- For instance, a study of vitamin K1 in lipid-core nanocapsules found that the encapsulated suspension maintained stable physicochemical characteristics and preserved vitamin content over time under light and air exposure.
Rising Interest In Personalized Nutrition And Precision-Dose Vitamin K1 Formats
Consumers seek tailored K1 doses that match age, lifestyle, and daily health goals. Tech-enabled nutrition platforms recommend specific K1 intake levels after assessments. Brands launch targeted blends for seniors, athletes, and women’s wellness. Small-dose formats gain traction due to convenience. Many users prefer app-linked tracking for supplement adherence. Personalized packs support broader acceptance among cautious buyers. This trend attracts investors toward niche formulations. The Phylloquinone market adapts to rising precision-nutrition adoption.
- For instance, compounding pharmacists showed that vitamin K1 oral liquid stored under amber glass bottles retained over 90% of initial potency for 105 days, enabling flexible dosing without rapid degradation.
Expansion Of Ready-To-Mix Vitamin K1 Powders For Flexible Use In Daily Diets
Consumers prefer powder forms that blend with smoothies, soups, and daily meals. This format offers flexible dosing for many lifestyles. Producers refine solubility levels to offer smoother texture. Retailers highlight powder mixes in premium nutrition aisles. Families use these powders to support balanced nutrient intake. Athletes add K1 blends to post-workout routines. Health stores promote powders as easy-to-carry formats. The Phylloquinone market gains steady traction in versatile nutrition categories.
Growing Integration Of Vitamin K1 Into Beauty, Skin Health, And Cosmetic Applications
Skincare brands test K1 for reducing redness and improving elasticity. Cosmetic formulators add K1 to creams and serums aimed at sensitive skin. R&D studies explore wider roles of K1 in topical repair. Beauty retailers promote K1-based products within premium shelves. Many consumers link K1 to natural healing properties. Dermatologists support selective use for specific skin conditions. This trend lifts cross-industry collaboration between pharma and beauty. The Phylloquinone market expands into wellness-beauty hybrids.
Market Challenges Analysis:
Supply Fluctuations, High Production Costs, And Regulatory Restrictions Across Many Regions
Manufacturers face unstable raw material supply when plant sources vary across seasons. Production lines require strict environmental control, which raises operational costs. Regulatory rules differ across markets, creating obstacles for global distribution. Some countries mandate higher purity standards that extend approval timelines. Small producers struggle to meet documentation requirements. Synthetic alternatives challenge natural K1 products in several niches. Market expansion slows when firms delay compliance upgrades. The Phylloquinone market faces these constraints during long-term scale-up.
Low Consumer Awareness, Storage Instability Issues, And Price Sensitivity In Mass Retail
Many users remain unaware of K1-specific benefits, which reduces adoption rates. Retailers prefer fast-moving supplements, which leaves limited space for new K1 products. Nutrient loss during exposure to heat and light challenges product stability. Firms invest in protective packaging to support shelf life. Price-conscious buyers shift to generic blends with minimal K1 content. Marketing budgets limit outreach in emerging regions. These issues create slower uptake despite rising wellness interest. The Phylloquinone market must address awareness gaps and stability concerns.
Market Opportunities:
Growing Scope For Natural, Organic, And Plant-Based Vitamin K1 Expansion Across Health Sectors
Brands can widen portfolios with organic leaf-derived K1 for wellness-focused users. Many retailers push natural vitamins that support daily preventive care. Producers can target sports nutrition and senior care with premium plant formulations. Emerging firms can scale sustainable extraction methods to gain early advantage. Beauty and dermatology channels create growth prospects for topical K1. E-commerce platforms support fast adoption through clean-label marketing. These paths unlock new revenue pockets. The Phylloquinone market can capture strong growth through natural ingredient demand.
Rising Potential In Fortified Foods, Precision Nutrition Platforms, And Global Supplement Penetration
Food manufacturers can expand K1-fortified staples to meet rising household demand. Personalized nutrition apps create targeted channels for dose-specific K1 formats. Pharma programs open room for advanced clinical K1 usage. Retailers in emerging countries increase shelf space for vitamin categories. Brands can use stable encapsulated forms to reach broader users. These openings support new product launches across many regions. The Phylloquinone market gains strong prospects through diversified application growth.
Market Segmentation Analysis:
By Grade
The Phylloquinone market splits into food grade and pharmaceutical grade segments. Food grade products gain strong traction due to rising use in fortified foods and consumer wellness products. Many brands deploy food grade K1 in oils, cereals, and ready-to-eat items to support daily intake. Pharmaceutical grade K1 maintains high demand within clinical settings for regulated therapies. Hospitals prefer strict purity levels, which drives steady procurement. Producers refine processing steps to match global compliance norms. This grade structure supports balanced growth across preventive nutrition and medical care.
By Product Type/Source
Natural and synthetic categories shape this segment, and it shows clear buyer preferences. Natural sources gain momentum due to clean-label shifts, plant-based choices, and rising sustainability goals. Many supplement brands highlight natural extraction to attract health-conscious users. Synthetic variants keep strong demand within pharma and mass-market supplements due to cost stability and consistent potency. It helps manufacturers supply large batches without raw material volatility. Companies balance both types to serve wide-ranging applications. The Phylloquinone market benefits from this dual-source flexibility.
- For instance, Some producers extract K1 from plant oils rather than whole leaves, improving solubility for supplements. Synthetic vitamin K1 remains widely used in pharmaceutical-grade production, because it ensures stable batch-to-batch potency and purity.
By Application and Route of Administration
Application segments include food and beverages, pharmaceuticals, and dietary supplements, each driving steady expansion. Food producers add K1 to improve nutritional profiles of essential products. Pharma firms adopt K1 for therapeutic programs linked to bone and cardiovascular support. Supplement brands target preventive wellness users across many age groups. Route of administration spans oral, parenteral or intravenous, and topical formats. Oral forms dominate due to convenience and broad acceptance. Parenteral methods support clinical accuracy. Topical usage rises in skincare blends. This structure gives the Phylloquinone market broad application depth.
Segmentation:
By Grade
- Food Grade
- Pharmaceutical Grade
By Product Type/Source
- Natural Phylloquinone
- Synthetic Phylloquinone
By Application
- Food and Beverages
- Pharmaceuticals
- Dietary Supplements
By Route of Administration
- Oral
- Parenteral / Intravenous
- Topical
By Region
- North America
- Europe
- Asia Pacific
- South America
- Middle East & Africa
Regional Analysis:
North America
North America holds the largest share of the Phylloquinone market, supported by strong supplement adoption and advanced clinical usage. Consumers show high awareness of vitamin K1 benefits, which drives steady retail activity. Pharma companies expand controlled-dose formats that align with local regulatory norms. Retailers promote fortified foods that lift recurring demand across households. It gains traction from strong healthcare spending and higher preventive care participation. The region maintains leadership through broad product availability and mature distribution networks.
Europe
Europe secures a significant share of the market due to strong regulatory focus on clean-label nutrition and plant-based wellness. Many countries promote fortified food programs that support consistent K1 use. Pharma segments maintain stable adoption within cardiovascular and bone-health therapies. Retail formats highlight natural variants that appeal to sustainability-focused buyers. It benefits from organized distribution across pharmacies, specialty stores, and online platforms. Europe maintains a mature position with a balanced share driven by both preventive and clinical demand.
Asia Pacific, South America, and Middle East & Africa
Asia Pacific emerges as the fastest-growing region with expanding supplement use and rising nutrition awareness across urban populations. Manufacturers increase supply to meet food fortification programs across several countries. South America holds a modest share due to gradual expansion of preventive wellness and rising acceptance of fortified staples. Middle East & Africa maintain a smaller share driven by limited awareness and slower regulatory development. It observes growth potential as import flows rise and retail access improves. Each region builds its presence at a different pace shaped by economic, cultural, and healthcare conditions.
Shape Your Report to Specific Countries or Regions & Enjoy 30% Off!
Key Player Analysis:
- BASF SE
- DSM (DSM Nutritional Products, Koninklijke DSM N.V.)
- Kappa Bioscience
- Adisseo
- Glanbia
- Lonza Group
- Amphastar Pharmaceuticals
Competitive Analysis:
The Phylloquinone market features strong competition between global nutrition firms, specialty ingredient producers, and pharmaceutical suppliers. Leading players focus on purity levels, natural sourcing, and improved stability to maintain differentiation. Many companies invest in advanced extraction technologies to support clean-label demand. It gains traction from producers that expand capacity and improve technical capabilities. Firms highlight natural variants to appeal to wellness-focused buyers. Pharmaceutical suppliers focus on precise dose formats for clinical use. Pricing pressure continues due to low-cost manufacturers in several regions. Competitive intensity strengthens as brands expand global distribution networks.
Recent Developments:
- In October 2025, BASF launched Lutavit® A/D3 1000/200 NXT, a next-generation combined vitamin A and D3 formulation for animal nutrition. While this product addresses vitamin A and D3 combination rather than phylloquinone directly, it demonstrates BASF’s continued innovation in the vitamin market following its recovery from the July 2024 production facility incident. The product features microencapsulation technology and an 18-month shelf life, leveraging BASF’s state-of-the-art vitamin formulation facility at its Ludwigshafen Verbund site in Germany.
- In September 2025, Balchem launched a direct-to-consumer marketing initiative showcasing K2VITAL® at FC Bayern Women’s season opener at the Allianz Arena in Munich, Germany. The exhibition stand reached 57,762 football fans—a new German record attendance. This campaign promoted co-branded products from customer Natsana’s Natural Elements® product range, including liquid drops, capsules, and combined vitamin D and K2 solutions targeting bone health support. This initiative represented Balchem’s strategy to bridge B2B and B2C markets while educating consumers about vitamin K2’s health benefits.
- In August 2025, BASF lifted its force majeure on key animal and human nutrition vitamin products after successfully restarting production at its Ludwigshafen facility. The company resumed production of Lutavit® E 50, Vitamin E-Acetate Oily Feed, and Lucarotin® 10% Feed NXT for animal nutrition, alongside multiple vitamin A and E products for human applications. Production of vitamin A restarted in April 2025, while vitamin E and carotenoid production resumed by July 2025, marking gradual recovery from the July 29, 2024 explosion and fire that had disrupted global vitamin supply chains.
Report Coverage:
The research report offers an in-depth analysis based on By Grade, By Product Type/Source, By Application, and By Route of Administration. It details leading market players, providing an overview of their business, product offerings, investments, revenue streams, and key applications. Additionally, the report includes insights into the competitive environment, SWOT analysis, current market trends, as well as the primary drivers and constraints. Furthermore, it discusses various factors that have driven market expansion in recent years. The report also explores market dynamics, regulatory scenarios, and technological advancements that are shaping the industry. It assesses the impact of external factors and global economic changes on market growth. Lastly, it provides strategic recommendations for new entrants and established companies to navigate the complexities of the market.
Future Outlook:
- Demand will rise as health awareness increases across preventive nutrition programs.
- Natural-source K1 will gain stronger adoption due to clean-label preferences.
- Pharmaceutical-grade formats will grow due to expanding clinical applications.
- Encapsulation and stability technologies will support longer shelf life.
- Food fortification initiatives will expand across developing regions.
- Supplement brands will launch targeted K1 blends for specific demographic groups.
- Topical applications will gain traction within cosmetic and dermatology sectors.
- Manufacturers will scale sustainable extraction methods to meet sourcing standards.
- Regional distribution networks will strengthen to support wider retail penetration.
- Digital health platforms will boost personalized K1 dosage recommendations.


