CHAPTER NO. 1 : INTRODUCTION 31
1.1.1. Report Description 31
Purpose of the Report 31
USP & Key Offerings 31
1.1.2. Key Benefits for Stakeholders 31
1.1.3. Target Audience 32
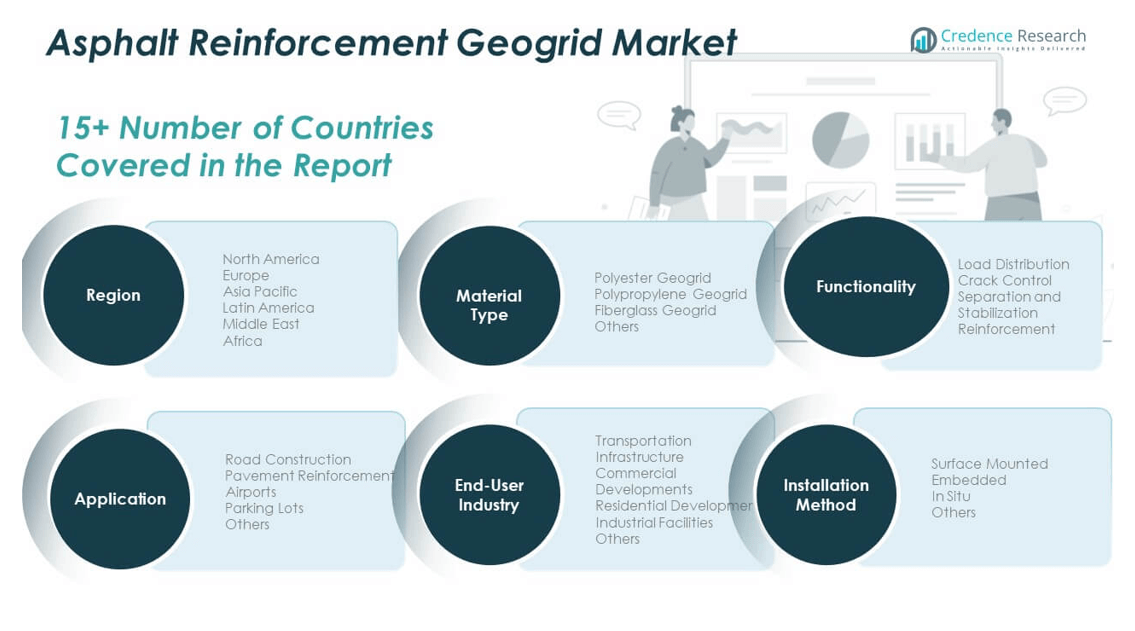
1.1.4. Report Scope 32
1.1.5. Regional Scope 33
CHAPTER NO. 2 : EXECUTIVE SUMMARY 34
2.1. Asphalt Reinforcement Geogrid Market Snapshot 34
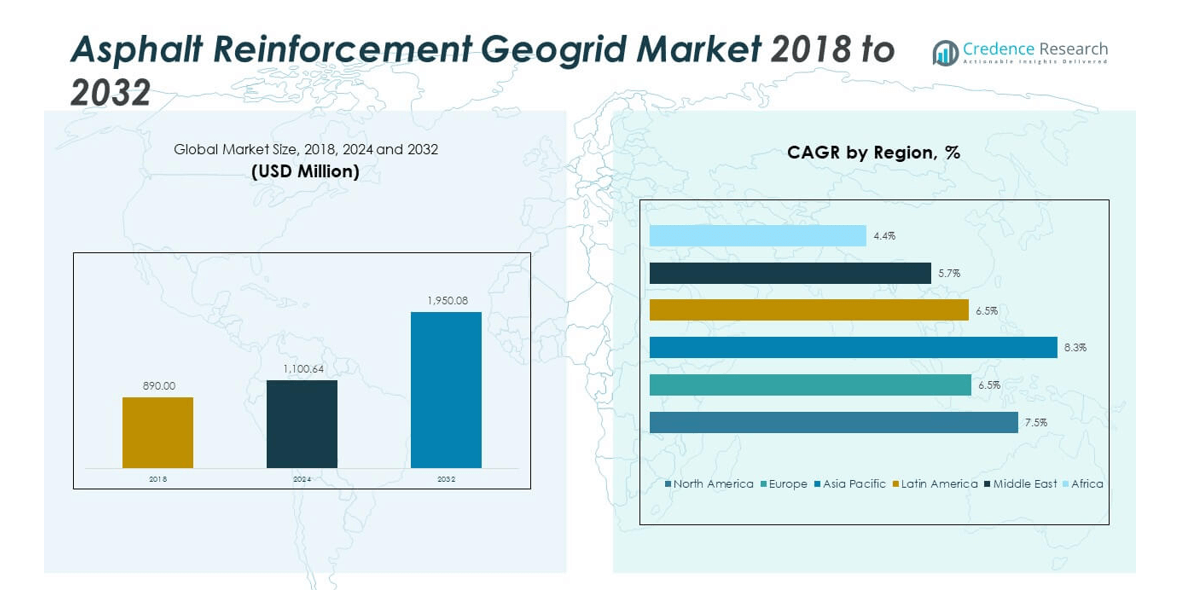
2.1.1. Global Asphalt Reinforcement Geogrid Market, 2018 – 2032 (USD Million) 36
CHAPTER NO. 3 : GEOPOLITICAL CRISIS IMPACT ANALYSIS 37
3.1. Russia-Ukraine and Israel-Palestine War Impacts 37
CHAPTER NO. 4 : ASPHALT REINFORCEMENT GEOGRID MARKET – INDUSTRY ANALYSIS 38
4.1. Introduction 38
4.2. Market Drivers 39
4.2.1. Rising Road Infrastructure Development 39
4.2.2. Growing Need for Pavement Rehabilitation 40
4.3. Market Restraints 41
4.3.1. Restraining Factor Analysis 41
4.4. Market Opportunities 42
4.4.1. Market Opportunity Analysis 42
4.5. Porter’s Five Forces Analysis 43
CHAPTER NO. 5 : ANALYSIS COMPETITIVE LANDSCAPE 44
5.1. Company Market Share Analysis – 2024 44
5.1.1. Global Asphalt Reinforcement Geogrid Market: Company Market Share, by Volume, 2024 44
5.1.2. Global Asphalt Reinforcement Geogrid Market: Company Market Share, by Revenue, 2024 45
5.1.3. Global Asphalt Reinforcement Geogrid Market: Top 6 Company Market Share, by Revenue, 2024 45
5.1.4. Global Asphalt Reinforcement Geogrid Market: Top 3 Company Market Share, by Revenue, 2024 46
5.2. Global Asphalt Reinforcement Geogrid Market Company Revenue Market Share, 2024 47
5.3. Company Assessment Metrics, 2023 48
5.3.1. Stars 48
5.3.2. Emerging Leaders 48
5.3.3. Pervasive Players 48
5.3.4. Participants 48
5.4. Start-ups /SMEs Assessment Metrics, 2023 48
5.4.1. Progressive Companies 48
5.4.2. Responsive Companies 48
5.4.3. Dynamic Companies 48
5.4.4. Starting Blocks 48
5.5. Strategic Developments 49
5.5.1. Acquisitions & Mergers 49
New Product Launch 49
Regional Expansion 49
5.6. Key Players Product Matrix 50
CHAPTER NO. 6 : PESTEL & ADJACENT MARKET ANALYSIS 51
6.1. PESTEL 51
6.1.1. Political Factors 51
6.1.2. Economic Factors 51
6.1.3. Social Factors 51
6.1.4. Technological Factors 51
6.1.5. Environmental Factors 51
6.1.6. Legal Factors 51
6.2. Adjacent Market Analysis 51
CHAPTER NO. 7 : ASPHALT REINFORCEMENT GEOGRID MARKET – BY MATERIAL TYPE SEGMENT ANALYSIS 52
7.1. Asphalt Reinforcement Geogrid Market Overview, by Material Type Segment 52
7.1.1. Asphalt Reinforcement Geogrid Market Revenue Share, By Material Type, 2023 & 2032 53
7.1.2. Asphalt Reinforcement Geogrid Market Attractiveness Analysis, By Material Type 54
7.1.3. Incremental Revenue Growth Opportunity, by Material Type, 2024 – 2032 54
7.1.4. Asphalt Reinforcement Geogrid Market Revenue, By Material Type, 2018, 2023, 2027 & 2032 55
7.2. Polyester Geogrid 56
7.2.1. Global Polyester Geogrid Asphalt Reinforcement Geogrid Market Revenue, By Region, 2018 – 2023 (USD Million) 57
7.2.2. Global Polyester Geogrid Asphalt Reinforcement Geogrid Market Revenue, By Region, 2024 – 2032 (USD Million) 57
7.3. Polypropylene Geogrid 58
7.3.1. Global Polypropylene Geogrid Asphalt Reinforcement Geogrid Market Revenue, By Region, 2018 – 2023 (USD Million) 59
7.3.2. Global Polypropylene Geogrid Asphalt Reinforcement Geogrid Market Revenue, By Region, 2024 – 2032 (USD Million) 59
7.4. Fiberglass Geogrid 60
7.4.1. Global Fiberglass Geogrid Asphalt Reinforcement Geogrid Market Revenue, By Region, 2018 – 2023 (USD Million) 61
7.4.2. Global Fiberglass Geogrid Asphalt Reinforcement Geogrid Market Revenue, By Region, 2024 – 2032 (USD Million) 61
7.5. Others 62
7.5.1. Global Others Asphalt Reinforcement Geogrid Market Revenue, By Region, 2018 – 2023 (USD Million) 63
7.5.2. Global Others Asphalt Reinforcement Geogrid Market Revenue, By Region, 2024 – 2032 (USD Million) 63
CHAPTER NO. 8 : ASPHALT REINFORCEMENT GEOGRID MARKET – BY APPLICATION SEGMENT ANALYSIS 64
8.1. Asphalt Reinforcement Geogrid Market Overview, by Application Segment 64
8.1.1. Asphalt Reinforcement Geogrid Market Revenue Share, By Application, 2023 & 2032 65
8.1.2. Asphalt Reinforcement Geogrid Market Attractiveness Analysis, By Application 66
8.1.3. Incremental Revenue Growth Opportunity, by Application, 2024 – 2032 66
8.1.4. Asphalt Reinforcement Geogrid Market Revenue, By Application, 2018, 2023, 2027 & 2032 67
8.2. Road Construction 68
8.2.1. Global Road Construction Asphalt Reinforcement Geogrid Market Revenue, By Region, 2018 – 2023 (USD Million) 69
8.2.2. Global Road Construction Asphalt Reinforcement Geogrid Market Revenue, By Region, 2024 – 2032 (USD Million) 69
8.3. Pavement Reinforcement 70
8.3.1. Global Pavement Reinforcement Asphalt Reinforcement Geogrid Market Revenue, By Region, 2018 – 2023 (USD Million) 71
8.3.2. Global Pavement Reinforcement Asphalt Reinforcement Geogrid Market Revenue, By Region, 2024 – 2032 (USD Million) 71
8.4. Airports 72
8.4.1. Global Airports Asphalt Reinforcement Geogrid Market Revenue, By Region, 2018 – 2023 (USD Million) 73
8.4.2. Global Airports Asphalt Reinforcement Geogrid Market Revenue, By Region, 2024 – 2032 (USD Million) 73
8.5. Parking Lots 74
8.5.1. Global Parking Lots Asphalt Reinforcement Geogrid Market Revenue, By Region, 2018 – 2023 (USD Million) 75
8.5.2. Global Parking Lots Asphalt Reinforcement Geogrid Market Revenue, By Region, 2024 – 2032 (USD Million) 75
8.6. Others 76
8.6.1. Global Others Asphalt Reinforcement Geogrid Market Revenue, By Region, 2018 – 2023 (USD Million) 77
8.6.2. Global Others Asphalt Reinforcement Geogrid Market Revenue, By Region, 2024 – 2032 (USD Million) 77
CHAPTER NO. 9 : ASPHALT REINFORCEMENT GEOGRID MARKET – BY END-USER INDUSTRY SEGMENT ANALYSIS 78
9.1. Asphalt Reinforcement Geogrid Market Overview, by End-user Industry Segment 78
9.1.1. Asphalt Reinforcement Geogrid Market Revenue Share, By End-user, 2023 & 2032 79
9.1.2. Asphalt Reinforcement Geogrid Market Attractiveness Analysis, By End-user 80
9.1.3. Incremental Revenue Growth Opportunity, by End-user, 2024 – 2032 80
9.1.4. Asphalt Reinforcement Geogrid Market Revenue, By End-user, 2018, 2023, 2027 & 2032 81
9.2. Transportation Infrastructure 82
9.2.1. Global Transportation Infrastructure Asphalt Reinforcement Geogrid Market Revenue, By Region, 2018 – 2023 (USD Million) 83
9.2.2. Global Transportation Infrastructure Asphalt Reinforcement Geogrid Market Revenue, By Region, 2024 – 2032 (USD Million) 83
9.3. Commercial Developments 84
9.3.1. Global Commercial Developments Asphalt Reinforcement Geogrid Market Revenue, By Region, 2018 – 2023 (USD Million) 85
9.3.2. Global Commercial Developments Asphalt Reinforcement Geogrid Market Revenue, By Region, 2024 – 2032 (USD Million) 85
9.4. Residential Developments 86
9.4.1. Global Residential Developments Asphalt Reinforcement Geogrid Market Revenue, By Region, 2018 – 2023 (USD Million) 87
9.4.2. Global Residential Developments Asphalt Reinforcement Geogrid Market Revenue, By Region, 2024 – 2032 (USD Million) 87
9.5. Industrial Facilities 88
9.5.1. Global Industrial Facilities Asphalt Reinforcement Geogrid Market Revenue, By Region, 2018 – 2023 (USD Million) 89
9.5.2. Global Industrial Facilities Asphalt Reinforcement Geogrid Market Revenue, By Region, 2024 – 2032 (USD Million) 89
9.6. Others 90
9.6.1. Global Others Asphalt Reinforcement Geogrid Market Revenue, By Region, 2018 – 2023 (USD Million) 91
9.6.2. Global Others Asphalt Reinforcement Geogrid Market Revenue, By Region, 2024 – 2032 (USD Million) 91
CHAPTER NO. 10 : ASPHALT REINFORCEMENT GEOGRID MARKET – BY FUNCTIONALITY SEGMENT ANALYSIS 92
10.1. Asphalt Reinforcement Geogrid Market Overview, by Functionality Segment 92
10.1.1. Asphalt Reinforcement Geogrid Market Revenue Share, By Functionality, 2023 & 2032 93
10.1.2. Asphalt Reinforcement Geogrid Market Attractiveness Analysis, By Functionality 94
10.1.3. Incremental Revenue Growth Opportunity, by Functionality, 2024 – 2032 94
10.1.4. Asphalt Reinforcement Geogrid Market Revenue, By Functionality, 2018, 2023, 2027 & 2032 95
10.2. Load Distribution 96
10.2.1. Global Load Distribution Asphalt Reinforcement Geogrid Market Revenue, By Region, 2018 – 2023 (USD Million) 97
10.2.2. Global Load Distribution Asphalt Reinforcement Geogrid Market Revenue, By Region, 2024 – 2032 (USD Million) 97
10.3. Crack Control 98
10.3.1. Global Crack Control Asphalt Reinforcement Geogrid Market Revenue, By Region, 2018 – 2023 (USD Million) 99
10.3.2. Global Crack Control Asphalt Reinforcement Geogrid Market Revenue, By Region, 2024 – 2032 (USD Million) 99
10.4. Separation and Stabilization 100
10.4.1. Global Separation and Stabilization Asphalt Reinforcement Geogrid Market Revenue, By Region, 2018 – 2023 (USD Million) 101
10.4.2. Global Separation and Stabilization Asphalt Reinforcement Geogrid Market Revenue, By Region, 2024 – 2032 (USD Million) 101
10.5. Reinforcement 102
10.5.1. Global Reinforcement Asphalt Reinforcement Geogrid Market Revenue, By Region, 2018 – 2023 (USD Million) 103
10.5.2. Global Reinforcement Asphalt Reinforcement Geogrid Market Revenue, By Region, 2024 – 2032 (USD Million) 103
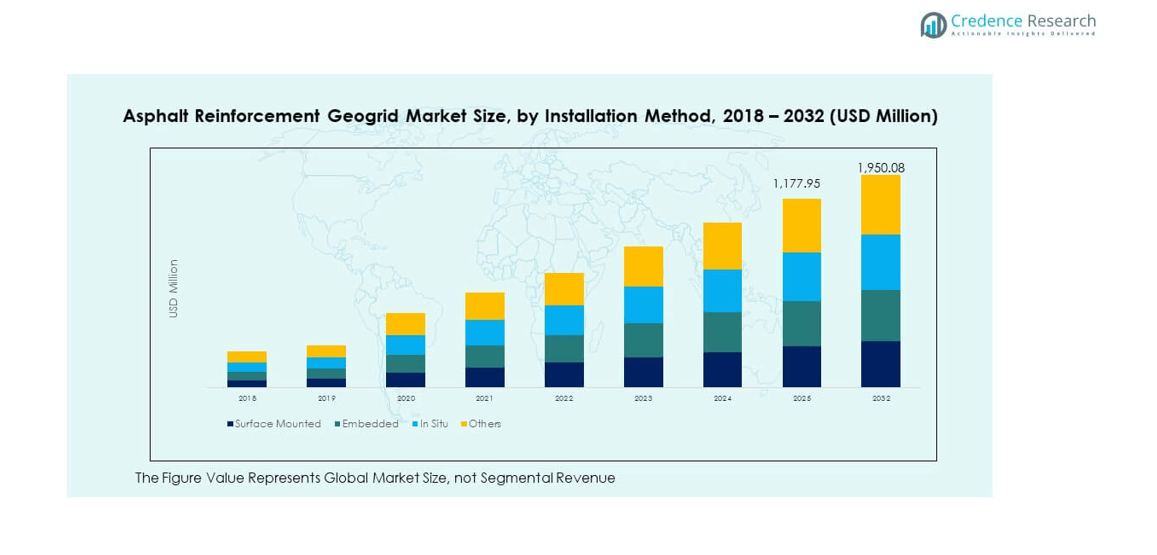
CHAPTER NO. 11 : ASPHALT REINFORCEMENT GEOGRID MARKET – BY INSTALLATION METHOD SEGMENT ANALYSIS 104
11.1. Asphalt Reinforcement Geogrid Market Overview, by Installation Method Segment 104
11.1.1. Asphalt Reinforcement Geogrid Market Revenue Share, By Distribution Channel, 2023 & 2032 105
11.1.2. Asphalt Reinforcement Geogrid Market Attractiveness Analysis, By Distribution Channel 106
11.1.3. Incremental Revenue Growth Opportunity, by Distribution Channel, 2024 – 2032 106
11.1.4. Asphalt Reinforcement Geogrid Market Revenue, By Distribution Channel, 2018, 2023, 2027 & 2032 107
11.2. Surface Mounted 108
11.2.1. Global Surface Mounted Asphalt Reinforcement Geogrid Market Revenue, By Region, 2018 – 2023 (USD Million) 109
11.2.2. Global Surface Mounted Asphalt Reinforcement Geogrid Market Revenue, By Region, 2024 – 2032 (USD Million) 109
11.3. Embedded 110
11.3.1. Global Embedded Asphalt Reinforcement Geogrid Market Revenue, By Region, 2018 – 2023 (USD Million) 111
11.3.2. Global Embedded Asphalt Reinforcement Geogrid Market Revenue, By Region, 2024 – 2032 (USD Million) 111
11.4. In Situ 112
11.4.1. Global In Situ Asphalt Reinforcement Geogrid Market Revenue, By Region, 2018 – 2023 (USD Million) 113
11.4.2. Global In Situ Asphalt Reinforcement Geogrid Market Revenue, By Region, 2024 – 2032 (USD Million) 113
11.5. Others 114
11.5.1. Global Others Asphalt Reinforcement Geogrid Market Revenue, By Region, 2018 – 2023 (USD Million) 115
11.5.2. Global Others Asphalt Reinforcement Geogrid Market Revenue, By Region, 2024 – 2032 (USD Million) 115
CHAPTER NO. 12 : ASPHALT REINFORCEMENT GEOGRID MARKET – REGIONAL ANALYSIS 116
12.1. Asphalt Reinforcement Geogrid Market Overview, by Regional Segments 116
12.2. Region 117
12.2.1. Global Asphalt Reinforcement Geogrid Market Revenue Share, By Region, 2023 & 2032 117
12.2.2. Asphalt Reinforcement Geogrid Market Attractiveness Analysis, By Region 118
12.2.3. Incremental Revenue Growth Opportunity, by Region, 2024 – 2032 118
12.2.4. Asphalt Reinforcement Geogrid Market Revenue, By Region, 2018, 2023, 2027 & 2032 119
12.2.5. Global Asphalt Reinforcement Geogrid Market Revenue, By Region, 2018 – 2023 (USD Million) 120
12.2.6. Global Asphalt Reinforcement Geogrid Market Revenue, By Region, 2024 – 2032 (USD Million) 120
12.3. Material Type 121
12.3.1. Global Asphalt Reinforcement Geogrid Market Revenue, By Material Type, 2018 – 2023 (USD Million) 121
12.3.2. Global Asphalt Reinforcement Geogrid Market Revenue, By Material Type, 2024 – 2032 (USD Million) 121
12.4. Application 122
12.4.1. Global Asphalt Reinforcement Geogrid Market Revenue, By Application, 2018 – 2023 (USD Million) 122
12.4.2. Global Asphalt Reinforcement Geogrid Market Revenue, By Application, 2024 – 2032 (USD Million) 122
12.5. End-user 123
12.5.1. Global Asphalt Reinforcement Geogrid Market Revenue, By End-user, 2018 – 2023 (USD Million) 123
12.5.2. Global Asphalt Reinforcement Geogrid Market Revenue, By End-user, 2024 – 2032 (USD Million) 123
12.6. Functionality 124
12.6.1. Global Asphalt Reinforcement Geogrid Market Revenue, By Functionality, 2018 – 2023 (USD Million) 124
12.6.2. Global Asphalt Reinforcement Geogrid Market Revenue, By Functionality, 2024 – 2032 (USD Million) 124
12.7. Distribution Channel 125
12.7.1. Global Asphalt Reinforcement Geogrid Market Revenue, By Installation Method, 2018 – 2023 (USD Million) 125
12.7.2. Global Asphalt Reinforcement Geogrid Market Revenue, By Installation Method, 2024 – 2032 (USD Million) 125
CHAPTER NO. 13 : ASPHALT REINFORCEMENT GEOGRID MARKET – NORTH AMERICA 126
13.1. North America 126
13.1.1. Key Highlights 126
13.1.2. North America Asphalt Reinforcement Geogrid Market Revenue, By Country, 2018 – 2023 (USD Million) 127
13.1.3. North America Asphalt Reinforcement Geogrid Market Revenue, By Material Type, 2018 – 2023 (USD Million) 128
13.1.4. North America Asphalt Reinforcement Geogrid Market Revenue, By Application, 2018 – 2023 (USD Million) 129
13.1.5. North America Asphalt Reinforcement Geogrid Market Revenue, By End-user, 2018 – 2023 (USD Million) 130
13.1.6. North America Asphalt Reinforcement Geogrid Market Revenue, By Functionality, 2018 – 2023 (USD Million) 131
13.1.7. North America Asphalt Reinforcement Geogrid Market Revenue, By Installation Method, 2018 – 2023 (USD Million) 132
13.2. U.S. 133
13.3. Canada 133
13.4. Mexico 133
CHAPTER NO. 14 : ASPHALT REINFORCEMENT GEOGRID MARKET – EUROPE 134
14.1. Europe 134
14.1.1. Key Highlights 134
14.1.2. Europe Asphalt Reinforcement Geogrid Market Revenue, By Country, 2018 – 2023 (USD Million) 135
14.1.3. Europe Asphalt Reinforcement Geogrid Market Revenue, By Material Type, 2018 – 2023 (USD Million) 136
14.1.4. Europe Asphalt Reinforcement Geogrid Market Revenue, By Application, 2018 – 2023 (USD Million) 137
14.1.5. Europe Asphalt Reinforcement Geogrid Market Revenue, By End-user, 2018 – 2023 (USD Million) 138
14.1.6. Europe Asphalt Reinforcement Geogrid Market Revenue, By Functionality, 2018 – 2023 (USD Million) 139
14.1.7. Europe Asphalt Reinforcement Geogrid Market Revenue, By Installation Method, 2018 – 2023 (USD Million) 140
14.2. UK 141
14.3. France 141
14.4. Germany 141
14.5. Italy 141
14.6. Spain 141
14.7. Russia 141
14.8. Belgium 141
14.9. Netherland 141
14.10. Austria 141
14.11. Sweden 141
14.12. Poland 141
14.13. Denmark 141
14.14. Switzerland 141
14.15. Rest of Europe 141
CHAPTER NO. 15 : ASPHALT REINFORCEMENT GEOGRID MARKET – ASIA PACIFIC 142
15.1. Asia Pacific 142
15.1.1. Key Highlights 142
15.1.2. Asia Pacific Asphalt Reinforcement Geogrid Market Revenue, By Country, 2018 – 2023 (USD Million) 143
15.1.3. Asia Pacific Asphalt Reinforcement Geogrid Market Revenue, By Material Type, 2018 – 2023 (USD Million) 144
15.1.4. Asia Pacific Asphalt Reinforcement Geogrid Market Revenue, By Application, 2018 – 2023 (USD Million) 145
15.1.5. Asia Pacific Asphalt Reinforcement Geogrid Market Revenue, By End-user, 2018 – 2023 (USD Million) 146
15.1.6. Asia Pacific Asphalt Reinforcement Geogrid Market Revenue, By Functionality, 2018 – 2023 (USD Million) 147
15.1.7. Asia Pacific Asphalt Reinforcement Geogrid Market Revenue, By Installation Method, 2018 – 2023 (USD Million) 148
15.2. China 149
15.3. Japan 149
15.4. South Korea 149
15.5. India 149
15.6. Australia 149
15.7. Thailand 149
15.8. Indonesia 149
15.9. Vietnam 149
15.10. Malaysia 149
15.11. Philippines 149
15.12. Taiwan 149
15.13. Rest of Asia Pacific 149
CHAPTER NO. 16 : ASPHALT REINFORCEMENT GEOGRID MARKET – LATIN AMERICA 150
16.1. Latin America 150
16.1.1. Key Highlights 150
16.1.2. Latin America Asphalt Reinforcement Geogrid Market Revenue, By Country, 2018 – 2023 (USD Million) 151
16.1.3. Latin America Asphalt Reinforcement Geogrid Market Revenue, By Material Type, 2018 – 2023 (USD Million) 152
16.1.4. Latin America Asphalt Reinforcement Geogrid Market Revenue, By Application, 2018 – 2023 (USD Million) 153
16.1.5. Latin America Asphalt Reinforcement Geogrid Market Revenue, By End-user, 2018 – 2023 (USD Million) 154
16.1.6. Latin America Asphalt Reinforcement Geogrid Market Revenue, By Functionality, 2018 – 2023 (USD Million) 155
16.1.7. Latin America Asphalt Reinforcement Geogrid Market Revenue, By Installation Method, 2018 – 2023 (USD Million) 156
16.2. Brazil 157
16.3. Argentina 157
16.4. Peru 157
16.5. Chile 157
16.6. Colombia 157
16.7. Rest of Latin America 157
CHAPTER NO. 17 : ASPHALT REINFORCEMENT GEOGRID MARKET – MIDDLE EAST 158
17.1. Middle East 158
17.1.1. Key Highlights 158
17.1.2. Middle East Asphalt Reinforcement Geogrid Market Revenue, By Country, 2018 – 2023 (USD Million) 159
17.1.3. Middle East Asphalt Reinforcement Geogrid Market Revenue, By Material Type, 2018 – 2023 (USD Million) 160
17.1.4. Middle East Asphalt Reinforcement Geogrid Market Revenue, By Application, 2018 – 2023 (USD Million) 161
17.1.5. Middle East Asphalt Reinforcement Geogrid Market Revenue, By End-user, 2018 – 2023 (USD Million) 162
17.1.6. Middle East Asphalt Reinforcement Geogrid Market Revenue, By Functionality, 2018 – 2023 (USD Million) 163
17.1.7. Middle East Asphalt Reinforcement Geogrid Market Revenue, By Installation Method, 2018 – 2023 (USD Million) 164
17.2. UAE 165
17.3. KSA 165
17.4. Israel 165
17.5. Turkey 165
17.6. Iran 165
17.7. Rest of Middle East 165
CHAPTER NO. 18 : ASPHALT REINFORCEMENT GEOGRID MARKET – AFRICA 166
18.1. Africa 166
18.1.1. Key Highlights 166
18.1.2. Africa Asphalt Reinforcement Geogrid Market Revenue, By Country, 2018 – 2023 (USD Million) 167
18.1.3. Africa Asphalt Reinforcement Geogrid Market Revenue, By Material Type, 2018 – 2023 (USD Million) 168
18.1.4. Africa Asphalt Reinforcement Geogrid Market Revenue, By Application, 2018 – 2023 (USD Million) 169
18.1.5. Africa Asphalt Reinforcement Geogrid Market Revenue, By End-user, 2018 – 2023 (USD Million) 170
18.1.6. Africa Asphalt Reinforcement Geogrid Market Revenue, By Functionality, 2018 – 2023 (USD Million) 171
18.1.7. Africa Asphalt Reinforcement Geogrid Market Revenue, By Installation Method, 2018 – 2023 (USD Million) 172
18.2. Egypt 173
18.3. Nigeria 173
18.4. Algeria 173
18.5. Morocco 173
18.6. Rest of Africa 173
CHAPTER NO. 19 : COMPANY PROFILES 174
19.1. Maccaferri 174
19.1.1. Company Overview 174
19.1.2. Product Portfolio 174
19.1.3. Swot Analysis 174
19.1.4. Business Strategy 175
19.1.5. Financial Overview 175
19.2. Ace Geosynthetics 176
19.3. Tenax 176
19.4. Agru America Inc 176
19.5. Hanes Geo Components 176
19.6. Belton Industries Inc 176
19.7. Cetco 176
19.8. Huesker Synthetic GmbH 176
19.9. Asahi-Kasei Corporation 176
19.10. Texdelta 176
19.11. Panaweb Construction Solutions 176
19.12. Titan Environmental 176
List of Figures
FIG NO. 1. Global Asphalt Reinforcement Geogrid Market Revenue, 2018 – 2032 (USD Million) 36
FIG NO. 2. Porter’s Five Forces Analysis for Global Asphalt Reinforcement Geogrid Market 43
FIG NO. 3. Company Share Analysis, 2024 44
FIG NO. 4. Company Share Analysis, 2024 45
FIG NO. 5. Company Share Analysis, 2024 45
FIG NO. 6. Company Share Analysis, 2024 46
FIG NO. 7. Asphalt Reinforcement Geogrid Market – Company Revenue Market Share, 2024 47
FIG NO. 8. Asphalt Reinforcement Geogrid Market Revenue Share, By Material Type, 2023 & 2032 53
FIG NO. 9. Market Attractiveness Analysis, By Material Type 54
FIG NO. 10. Incremental Revenue Growth Opportunity by Material Type, 2024 – 2032 54
FIG NO. 11. Asphalt Reinforcement Geogrid Market Revenue, By Material Type, 2018, 2023, 2027 & 2032 55
FIG NO. 12. Global Asphalt Reinforcement Geogrid Market for Polyester Geogrid, Revenue (USD Million) 2018 – 2032 56
FIG NO. 13. Global Asphalt Reinforcement Geogrid Market for Polypropylene Geogrid, Revenue (USD Million) 2018 – 2032 58
FIG NO. 14. Global Asphalt Reinforcement Geogrid Market for Fiberglass Geogrid, Revenue (USD Million) 2018 – 2032 60
FIG NO. 15. Global Asphalt Reinforcement Geogrid Market for Others, Revenue (USD Million) 2018 – 2032 62
FIG NO. 16. Asphalt Reinforcement Geogrid Market Revenue Share, By Application, 2023 & 2032 65
FIG NO. 17. Market Attractiveness Analysis, By Application 66
FIG NO. 18. Incremental Revenue Growth Opportunity by Application, 2024 – 2032 66
FIG NO. 19. Asphalt Reinforcement Geogrid Market Revenue, By Application, 2018, 2023, 2027 & 2032 67
FIG NO. 20. Global Asphalt Reinforcement Geogrid Market for Road Construction, Revenue (USD Million) 2018 – 2032 68
FIG NO. 21. Global Asphalt Reinforcement Geogrid Market for Pavement Reinforcement, Revenue (USD Million) 2018 – 2032 70
FIG NO. 22. Global Asphalt Reinforcement Geogrid Market for Airports, Revenue (USD Million) 2018 – 2032 72
FIG NO. 23. Global Asphalt Reinforcement Geogrid Market for Parking Lots, Revenue (USD Million) 2018 – 2032 74
FIG NO. 24. Global Asphalt Reinforcement Geogrid Market for Others, Revenue (USD Million) 2018 – 2032 76
FIG NO. 25. Asphalt Reinforcement Geogrid Market Revenue Share, By End-user, 2023 & 2032 79
FIG NO. 26. Market Attractiveness Analysis, By End-user 80
FIG NO. 27. Incremental Revenue Growth Opportunity by End-user, 2024 – 2032 80
FIG NO. 28. Asphalt Reinforcement Geogrid Market Revenue, By End-user, 2018, 2023, 2027 & 2032 81
FIG NO. 29. Global Asphalt Reinforcement Geogrid Market for Transportation Infrastructure, Revenue (USD Million) 2018 – 2032 82
FIG NO. 30. Global Asphalt Reinforcement Geogrid Market for Commercial Developments, Revenue (USD Million) 2018 – 2032 84
FIG NO. 31. Global Asphalt Reinforcement Geogrid Market for Residential Developments, Revenue (USD Million) 2018 – 2032 86
FIG NO. 32. Global Asphalt Reinforcement Geogrid Market for Industrial Facilities, Revenue (USD Million) 2018 – 2032 88
FIG NO. 33. Global Asphalt Reinforcement Geogrid Market for Others, Revenue (USD Million) 2018 – 2032 90
FIG NO. 34. Asphalt Reinforcement Geogrid Market Revenue Share, By Functionality, 2023 & 2032 93
FIG NO. 35. Market Attractiveness Analysis, By Functionality 94
FIG NO. 36. Incremental Revenue Growth Opportunity by Functionality, 2024 – 2032 94
FIG NO. 37. Asphalt Reinforcement Geogrid Market Revenue, By Functionality, 2018, 2023, 2027 & 2032 95
FIG NO. 38. Global Asphalt Reinforcement Geogrid Market for Load Distribution, Revenue (USD Million) 2018 – 2032 96
FIG NO. 39. Global Asphalt Reinforcement Geogrid Market for Crack Control, Revenue (USD Million) 2018 – 2032 98
FIG NO. 40. Global Asphalt Reinforcement Geogrid Market for Separation and Stabilization, Revenue (USD Million) 2018 – 2032 100
FIG NO. 41. Global Asphalt Reinforcement Geogrid Market for Reinforcement, Revenue (USD Million) 2018 – 2032 102
FIG NO. 42. Asphalt Reinforcement Geogrid Market Revenue Share, By Distribution Channel, 2023 & 2032 105
FIG NO. 43. Market Attractiveness Analysis, By Distribution Channel 106
FIG NO. 44. Incremental Revenue Growth Opportunity by Distribution Channel, 2024 – 2032 106
FIG NO. 45. Asphalt Reinforcement Geogrid Market Revenue, By Distribution Channel, 2018, 2023, 2027 & 2032 107
FIG NO. 46. Global Asphalt Reinforcement Geogrid Market for Surface Mounted, Revenue (USD Million) 2018 – 2032 108
FIG NO. 47. Global Asphalt Reinforcement Geogrid Market for Embedded, Revenue (USD Million) 2018 – 2032 110
FIG NO. 48. Global Asphalt Reinforcement Geogrid Market for In Situ, Revenue (USD Million) 2018 – 2032 112
FIG NO. 49. Global Asphalt Reinforcement Geogrid Market for Others, Revenue (USD Million) 2018 – 2032 114
FIG NO. 50. Global Asphalt Reinforcement Geogrid Market Revenue Share, By Region, 2023 & 2032 117
FIG NO. 51. Market Attractiveness Analysis, By Region 118
FIG NO. 52. Incremental Revenue Growth Opportunity by Region, 2024 – 2032 118
FIG NO. 53. Asphalt Reinforcement Geogrid Market Revenue, By Region, 2018, 2023, 2027 & 2032 119
FIG NO. 54. North America Asphalt Reinforcement Geogrid Market Revenue, 2018 – 2032 (USD Million) 126
FIG NO. 55. Europe Asphalt Reinforcement Geogrid Market Revenue, 2018 – 2032 (USD Million) 134
FIG NO. 56. Asia Pacific Asphalt Reinforcement Geogrid Market Revenue, 2018 – 2032 (USD Million) 142
FIG NO. 57. Latin America Asphalt Reinforcement Geogrid Market Revenue, 2018 – 2032 (USD Million) 150
FIG NO. 58. Middle East Asphalt Reinforcement Geogrid Market Revenue, 2018 – 2032 (USD Million) 158
FIG NO. 59. Africa Asphalt Reinforcement Geogrid Market Revenue, 2018 – 2032 (USD Million) 166
List of Tables
TABLE NO. 1. : Global Asphalt Reinforcement Geogrid Market: Snapshot 34
TABLE NO. 2. : Drivers for the Asphalt Reinforcement Geogrid Market: Impact Analysis 39
TABLE NO. 3. : Restraints for the Asphalt Reinforcement Geogrid Market: Impact Analysis 41
TABLE NO. 4. : Global Polyester Geogrid Asphalt Reinforcement Geogrid Market Revenue, By Region, 2018 – 2023 (USD Million) 57
TABLE NO. 5. : Global Polyester Geogrid Asphalt Reinforcement Geogrid Market Revenue, By Region, 2024 – 2032 (USD Million) 57
TABLE NO. 6. : Global Polypropylene Geogrid Asphalt Reinforcement Geogrid Market Revenue, By Region, 2018 – 2023 (USD Million) 59
TABLE NO. 7. : Global Polypropylene Geogrid Asphalt Reinforcement Geogrid Market Revenue, By Region, 2024 – 2032 (USD Million) 59
TABLE NO. 8. : Global Fiberglass Geogrid Asphalt Reinforcement Geogrid Market Revenue, By Region, 2018 – 2023 (USD Million) 61
TABLE NO. 9. : Global Fiberglass Geogrid Asphalt Reinforcement Geogrid Market Revenue, By Region, 2024 – 2032 (USD Million) 61
TABLE NO. 10. : Global Others Asphalt Reinforcement Geogrid Market Revenue, By Region, 2018 – 2023 (USD Million) 63
TABLE NO. 11. : Global Others Asphalt Reinforcement Geogrid Market Revenue, By Region, 2024 – 2032 (USD Million) 63
TABLE NO. 12. : Global Road Construction Asphalt Reinforcement Geogrid Market Revenue, By Region, 2018 – 2023 (USD Million) 69
TABLE NO. 13. : Global Road Construction Asphalt Reinforcement Geogrid Market Revenue, By Region, 2024 – 2032 (USD Million) 69
TABLE NO. 14. : Global Pavement Reinforcement Asphalt Reinforcement Geogrid Market Revenue, By Region, 2018 – 2023 (USD Million) 71
TABLE NO. 15. : Global Pavement Reinforcement Asphalt Reinforcement Geogrid Market Revenue, By Region, 2024 – 2032 (USD Million) 71
TABLE NO. 16. : Global Airports Asphalt Reinforcement Geogrid Market Revenue, By Region, 2018 – 2023 (USD Million) 73
TABLE NO. 17. : Global Airports Asphalt Reinforcement Geogrid Market Revenue, By Region, 2024 – 2032 (USD Million) 73
TABLE NO. 18. : Global Parking Lots Asphalt Reinforcement Geogrid Market Revenue, By Region, 2018 – 2023 (USD Million) 75
TABLE NO. 19. : Global Parking Lots Asphalt Reinforcement Geogrid Market Revenue, By Region, 2024 – 2032 (USD Million) 75
TABLE NO. 20. : Global Others Asphalt Reinforcement Geogrid Market Revenue, By Region, 2018 – 2023 (USD Million) 77
TABLE NO. 21. : Global Others Asphalt Reinforcement Geogrid Market Revenue, By Region, 2024 – 2032 (USD Million) 77
TABLE NO. 22. : Global Transportation Infrastructure Asphalt Reinforcement Geogrid Market Revenue, By Region, 2018 – 2023 (USD Million) 83
TABLE NO. 23. : Global Transportation Infrastructure Asphalt Reinforcement Geogrid Market Revenue, By Region, 2024 – 2032 (USD Million) 83
TABLE NO. 24. : Global Commercial Developments Asphalt Reinforcement Geogrid Market Revenue, By Region, 2018 – 2023 (USD Million) 85
TABLE NO. 25. : Global Commercial Developments Asphalt Reinforcement Geogrid Market Revenue, By Region, 2024 – 2032 (USD Million) 85
TABLE NO. 26. : Global Residential Developments Asphalt Reinforcement Geogrid Market Revenue, By Region, 2018 – 2023 (USD Million) 87
TABLE NO. 27. : Global Residential Developments Asphalt Reinforcement Geogrid Market Revenue, By Region, 2024 – 2032 (USD Million) 87
TABLE NO. 28. : Global Industrial Facilities Asphalt Reinforcement Geogrid Market Revenue, By Region, 2018 – 2023 (USD Million) 89
TABLE NO. 29. : Global Industrial Facilities Asphalt Reinforcement Geogrid Market Revenue, By Region, 2024 – 2032 (USD Million) 89
TABLE NO. 30. : Global Others Asphalt Reinforcement Geogrid Market Revenue, By Region, 2018 – 2023 (USD Million) 91
TABLE NO. 31. : Global Others Asphalt Reinforcement Geogrid Market Revenue, By Region, 2024 – 2032 (USD Million) 91
TABLE NO. 32. : Global Load Distribution Asphalt Reinforcement Geogrid Market Revenue, By Region, 2018 – 2023 (USD Million) 97
TABLE NO. 33. : Global Load Distribution Asphalt Reinforcement Geogrid Market Revenue, By Region, 2024 – 2032 (USD Million) 97
TABLE NO. 34. : Global Crack Control Asphalt Reinforcement Geogrid Market Revenue, By Region, 2018 – 2023 (USD Million) 99
TABLE NO. 35. : Global Crack Control Asphalt Reinforcement Geogrid Market Revenue, By Region, 2024 – 2032 (USD Million) 99
TABLE NO. 36. : Global Separation and Stabilization Asphalt Reinforcement Geogrid Market Revenue, By Region, 2018 – 2023 (USD Million) 101
TABLE NO. 37. : Global Separation and Stabilization Asphalt Reinforcement Geogrid Market Revenue, By Region, 2024 – 2032 (USD Million) 101
TABLE NO. 38. : Global Reinforcement Asphalt Reinforcement Geogrid Market Revenue, By Region, 2018 – 2023 (USD Million) 103
TABLE NO. 39. : Global Reinforcement Asphalt Reinforcement Geogrid Market Revenue, By Region, 2024 – 2032 (USD Million) 103
TABLE NO. 40. : Global Surface Mounted Asphalt Reinforcement Geogrid Market Revenue, By Region, 2018 – 2023 (USD Million) 109
TABLE NO. 41. : Global Surface Mounted Asphalt Reinforcement Geogrid Market Revenue, By Region, 2024 – 2032 (USD Million) 109
TABLE NO. 42. : Global Embedded Asphalt Reinforcement Geogrid Market Revenue, By Region, 2018 – 2023 (USD Million) 111
TABLE NO. 43. : Global Embedded Asphalt Reinforcement Geogrid Market Revenue, By Region, 2024 – 2032 (USD Million) 111
TABLE NO. 44. : Global In Situ Asphalt Reinforcement Geogrid Market Revenue, By Region, 2018 – 2023 (USD Million) 113
TABLE NO. 45. : Global In Situ Asphalt Reinforcement Geogrid Market Revenue, By Region, 2024 – 2032 (USD Million) 113
TABLE NO. 46. : Global Others Asphalt Reinforcement Geogrid Market Revenue, By Region, 2018 – 2023 (USD Million) 115
TABLE NO. 47. : Global Others Asphalt Reinforcement Geogrid Market Revenue, By Region, 2024 – 2032 (USD Million) 115
TABLE NO. 48. : Global Asphalt Reinforcement Geogrid Market Revenue, By Region, 2018 – 2023 (USD Million) 120
TABLE NO. 49. : Global Asphalt Reinforcement Geogrid Market Revenue, By Region, 2024 – 2032 (USD Million) 120
TABLE NO. 50. : Global Asphalt Reinforcement Geogrid Market Revenue, By Material Type, 2018 – 2023 (USD Million) 121
TABLE NO. 51. : Global Asphalt Reinforcement Geogrid Market Revenue, By Material Type, 2024 – 2032 (USD Million) 121
TABLE NO. 52. : Global Asphalt Reinforcement Geogrid Market Revenue, By Application, 2018 – 2023 (USD Million) 122
TABLE NO. 53. : Global Asphalt Reinforcement Geogrid Market Revenue, By Application, 2024 – 2032 (USD Million) 122
TABLE NO. 54. : Global Asphalt Reinforcement Geogrid Market Revenue, By End-user, 2018 – 2023 (USD Million) 123
TABLE NO. 55. : Global Asphalt Reinforcement Geogrid Market Revenue, By End-user, 2024 – 2032 (USD Million) 123
TABLE NO. 56. : Global Asphalt Reinforcement Geogrid Market Revenue, By Functionality, 2018 – 2023 (USD Million) 124
TABLE NO. 57. : Global Asphalt Reinforcement Geogrid Market Revenue, By Functionality, 2024 – 2032 (USD Million) 124
TABLE NO. 58. : Global Asphalt Reinforcement Geogrid Market Revenue, By Installation Method, 2018 – 2023 (USD Million) 125
TABLE NO. 59. : Global Asphalt Reinforcement Geogrid Market Revenue, By Installation Method, 2024 – 2032 (USD Million) 125
TABLE NO. 60. : North America Asphalt Reinforcement Geogrid Market Revenue, By Country, 2018 – 2023 (USD Million) 127
TABLE NO. 61. : North America Asphalt Reinforcement Geogrid Market Revenue, By Country, 2024 – 2032 (USD Million) 127
TABLE NO. 62. : North America Asphalt Reinforcement Geogrid Market Revenue, By Material Type, 2018 – 2023 (USD Million) 128
TABLE NO. 63. : North America Asphalt Reinforcement Geogrid Market Revenue, By Material Type, 2024 – 2032 (USD Million) 128
TABLE NO. 64. : North America Asphalt Reinforcement Geogrid Market Revenue, By Application, 2018 – 2023 (USD Million) 129
TABLE NO. 65. : North America Asphalt Reinforcement Geogrid Market Revenue, By Application, 2024 – 2032 (USD Million) 129
TABLE NO. 66. : North America Asphalt Reinforcement Geogrid Market Revenue, By End-user, 2018 – 2023 (USD Million) 130
TABLE NO. 67. : North America Asphalt Reinforcement Geogrid Market Revenue, By End-user, 2024 – 2032 (USD Million) 130
TABLE NO. 68. : North America Asphalt Reinforcement Geogrid Market Revenue, By Functionality, 2018 – 2023 (USD Million) 131
TABLE NO. 69. : North America Asphalt Reinforcement Geogrid Market Revenue, By Functionality, 2024 – 2032 (USD Million) 131
TABLE NO. 70. : North America Asphalt Reinforcement Geogrid Market Revenue, By Installation Method, 2018 – 2023 (USD Million) 132
TABLE NO. 71. : North America Asphalt Reinforcement Geogrid Market Revenue, By Installation Method, 2024 – 2032 (USD Million) 132
TABLE NO. 72. : Europe Asphalt Reinforcement Geogrid Market Revenue, By Country, 2018 – 2023 (USD Million) 135
TABLE NO. 73. : Europe Asphalt Reinforcement Geogrid Market Revenue, By Country, 2024 – 2032 (USD Million) 135
TABLE NO. 74. : Europe Asphalt Reinforcement Geogrid Market Revenue, By Material Type, 2018 – 2023 (USD Million) 136
TABLE NO. 75. : Europe Asphalt Reinforcement Geogrid Market Revenue, By Material Type, 2024 – 2032 (USD Million) 136
TABLE NO. 76. : Europe Asphalt Reinforcement Geogrid Market Revenue, By Application, 2018 – 2023 (USD Million) 137
TABLE NO. 77. : Europe Asphalt Reinforcement Geogrid Market Revenue, By Application, 2024 – 2032 (USD Million) 137
TABLE NO. 78. : Europe Asphalt Reinforcement Geogrid Market Revenue, By End-user, 2018 – 2023 (USD Million) 138
TABLE NO. 79. : Europe Asphalt Reinforcement Geogrid Market Revenue, By End-user, 2024 – 2032 (USD Million) 138
TABLE NO. 80. : Europe Asphalt Reinforcement Geogrid Market Revenue, By Functionality, 2018 – 2023 (USD Million) 139
TABLE NO. 81. : Europe Asphalt Reinforcement Geogrid Market Revenue, By Functionality, 2024 – 2032 (USD Million) 139
TABLE NO. 82. : Europe Asphalt Reinforcement Geogrid Market Revenue, By Installation Method, 2018 – 2023 (USD Million) 140
TABLE NO. 83. : Europe Asphalt Reinforcement Geogrid Market Revenue, By Installation Method, 2024 – 2032 (USD Million) 140
TABLE NO. 84. : Asia Pacific Asphalt Reinforcement Geogrid Market Revenue, By Country, 2018 – 2023 (USD Million) 143
TABLE NO. 85. : Asia Pacific Asphalt Reinforcement Geogrid Market Revenue, By Country, 2024 – 2032 (USD Million) 143
TABLE NO. 86. : Asia Pacific Asphalt Reinforcement Geogrid Market Revenue, By Material Type, 2018 – 2023 (USD Million) 144
TABLE NO. 87. : Asia Pacific Asphalt Reinforcement Geogrid Market Revenue, By Material Type, 2024 – 2032 (USD Million) 144
TABLE NO. 88. : Asia Pacific Asphalt Reinforcement Geogrid Market Revenue, By Application, 2018 – 2023 (USD Million) 145
TABLE NO. 89. : Asia Pacific Asphalt Reinforcement Geogrid Market Revenue, By Application, 2024 – 2032 (USD Million) 145
TABLE NO. 90. : Asia Pacific Asphalt Reinforcement Geogrid Market Revenue, By End-user, 2018 – 2023 (USD Million) 146
TABLE NO. 91. : Asia Pacific Asphalt Reinforcement Geogrid Market Revenue, By End-user, 2024 – 2032 (USD Million) 146
TABLE NO. 92. : Asia Pacific Asphalt Reinforcement Geogrid Market Revenue, By Functionality, 2018 – 2023 (USD Million) 147
TABLE NO. 93. : Asia Pacific Asphalt Reinforcement Geogrid Market Revenue, By Functionality, 2024 – 2032 (USD Million) 147
TABLE NO. 94. : Asia Pacific Asphalt Reinforcement Geogrid Market Revenue, By Installation Method, 2018 – 2023 (USD Million) 148
TABLE NO. 95. : Asia Pacific Asphalt Reinforcement Geogrid Market Revenue, By Installation Method, 2024 – 2032 (USD Million) 148
TABLE NO. 96. : Latin America Asphalt Reinforcement Geogrid Market Revenue, By Country, 2018 – 2023 (USD Million) 151
TABLE NO. 97. : Latin America Asphalt Reinforcement Geogrid Market Revenue, By Country, 2024 – 2032 (USD Million) 151
TABLE NO. 98. : Latin America Asphalt Reinforcement Geogrid Market Revenue, By Material Type, 2018 – 2023 (USD Million) 152
TABLE NO. 99. : Latin America Asphalt Reinforcement Geogrid Market Revenue, By Material Type, 2024 – 2032 (USD Million) 152
TABLE NO. 100. : Latin America Asphalt Reinforcement Geogrid Market Revenue, By Application, 2018 – 2023 (USD Million) 153
TABLE NO. 101. : Latin America Asphalt Reinforcement Geogrid Market Revenue, By Application, 2024 – 2032 (USD Million) 153
TABLE NO. 102. : Latin America Asphalt Reinforcement Geogrid Market Revenue, By End-user, 2018 – 2023 (USD Million) 154
TABLE NO. 103. : Latin America Asphalt Reinforcement Geogrid Market Revenue, By End-user, 2024 – 2032 (USD Million) 154
TABLE NO. 104. : Latin America Asphalt Reinforcement Geogrid Market Revenue, By Functionality, 2018 – 2023 (USD Million) 155
TABLE NO. 105. : Latin America Asphalt Reinforcement Geogrid Market Revenue, By Functionality, 2024 – 2032 (USD Million) 155
TABLE NO. 106. : Latin America Asphalt Reinforcement Geogrid Market Revenue, By Installation Method, 2018 – 2023 (USD Million) 156
TABLE NO. 107. : Latin America Asphalt Reinforcement Geogrid Market Revenue, By Installation Method, 2024 – 2032 (USD Million) 156
TABLE NO. 108. : Middle East Asphalt Reinforcement Geogrid Market Revenue, By Country, 2018 – 2023 (USD Million) 159
TABLE NO. 109. : Middle East Asphalt Reinforcement Geogrid Market Revenue, By Country, 2024 – 2032 (USD Million) 159
TABLE NO. 110. : Middle East Asphalt Reinforcement Geogrid Market Revenue, By Material Type, 2018 – 2023 (USD Million) 160
TABLE NO. 111. : Middle East Asphalt Reinforcement Geogrid Market Revenue, By Material Type, 2024 – 2032 (USD Million) 160
TABLE NO. 112. : Middle East Asphalt Reinforcement Geogrid Market Revenue, By Application, 2018 – 2023 (USD Million) 161
TABLE NO. 113. : Middle East Asphalt Reinforcement Geogrid Market Revenue, By Application, 2024 – 2032 (USD Million) 161
TABLE NO. 114. : Middle East Asphalt Reinforcement Geogrid Market Revenue, By End-user, 2018 – 2023 (USD Million) 162
TABLE NO. 115. : Middle East Asphalt Reinforcement Geogrid Market Revenue, By End-user, 2024 – 2032 (USD Million) 162
TABLE NO. 116. : Middle East Asphalt Reinforcement Geogrid Market Revenue, By Functionality, 2018 – 2023 (USD Million) 163
TABLE NO. 117. : Middle East Asphalt Reinforcement Geogrid Market Revenue, By Functionality, 2024 – 2032 (USD Million) 163
TABLE NO. 118. : Middle East Asphalt Reinforcement Geogrid Market Revenue, By Installation Method, 2018 – 2023 (USD Million) 164
TABLE NO. 119. : Middle East Asphalt Reinforcement Geogrid Market Revenue, By Installation Method, 2024 – 2032 (USD Million) 164
TABLE NO. 120. : Africa Asphalt Reinforcement Geogrid Market Revenue, By Country, 2018 – 2023 (USD Million) 167
TABLE NO. 121. : Africa Asphalt Reinforcement Geogrid Market Revenue, By Country, 2024 – 2032 (USD Million) 167
TABLE NO. 122. : Africa Asphalt Reinforcement Geogrid Market Revenue, By Material Type, 2018 – 2023 (USD Million) 168
TABLE NO. 123. : Africa Asphalt Reinforcement Geogrid Market Revenue, By Material Type, 2024 – 2032 (USD Million) 168
TABLE NO. 124. : Africa Asphalt Reinforcement Geogrid Market Revenue, By Application, 2018 – 2023 (USD Million) 169
TABLE NO. 125. : Africa Asphalt Reinforcement Geogrid Market Revenue, By Application, 2024 – 2032 (USD Million) 169
TABLE NO. 126. : Africa Asphalt Reinforcement Geogrid Market Revenue, By End-user, 2018 – 2023 (USD Million) 170
TABLE NO. 127. : Africa Asphalt Reinforcement Geogrid Market Revenue, By End-user, 2024 – 2032 (USD Million) 170
TABLE NO. 128. : Africa Asphalt Reinforcement Geogrid Market Revenue, By Functionality, 2018 – 2023 (USD Million) 171
TABLE NO. 129. : Africa Asphalt Reinforcement Geogrid Market Revenue, By Functionality, 2024 – 2032 (USD Million) 171
TABLE NO. 130. : Africa Asphalt Reinforcement Geogrid Market Revenue, By Installation Method, 2018 – 2023 (USD Million) 172
TABLE NO. 131. : Africa Asphalt Reinforcement Geogrid Market Revenue, By Installation Method, 2024 – 2032 (USD Million) 172