
Global Hydrogen Detection Market Overview
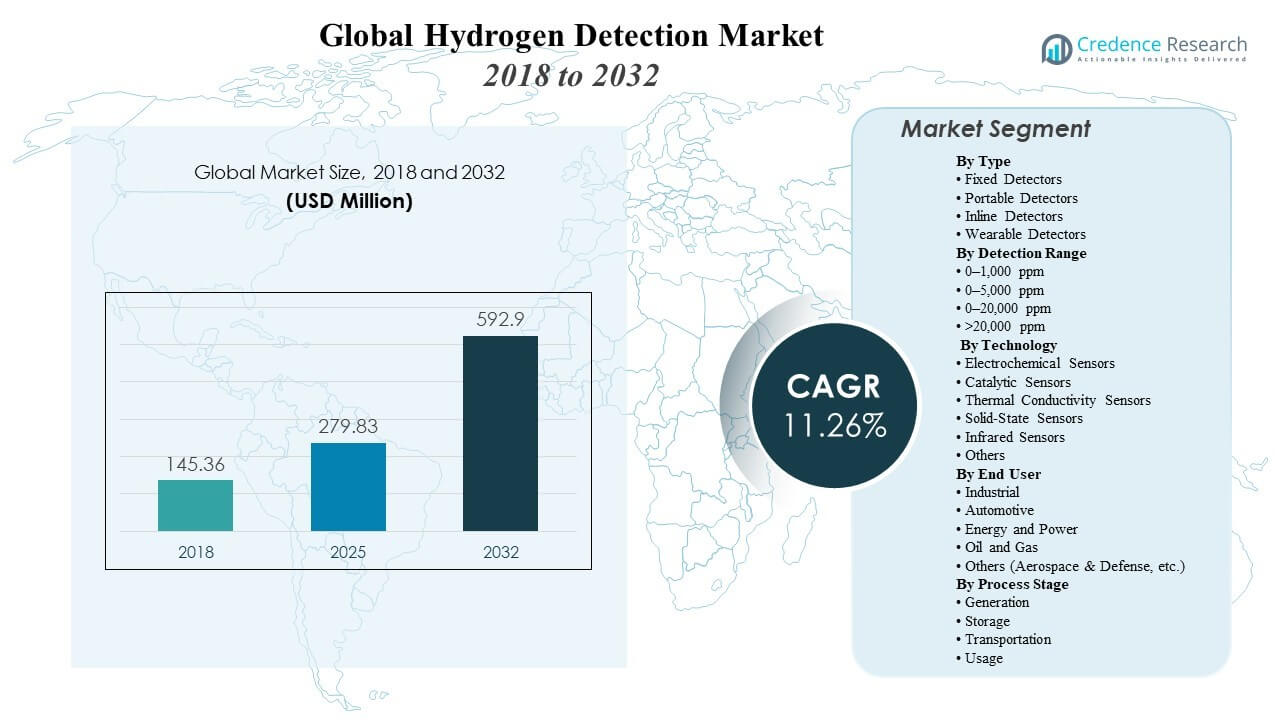
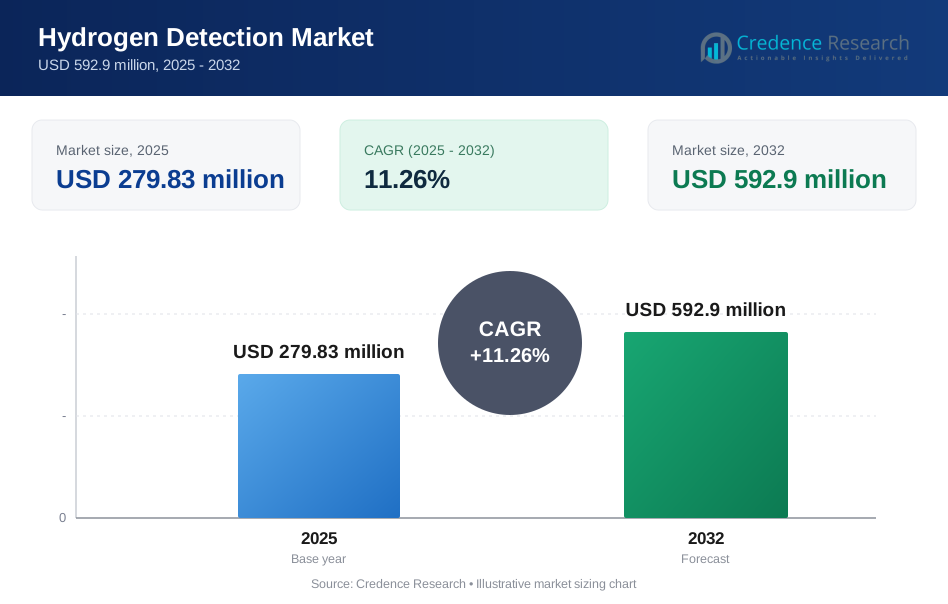
The Global Hydrogen Detection Market size was valued at USD 145.36 million in 2018 and reached USD 279.83 million in 2025, and it is expected to reach USD 592.9 million by 2032, growing at a CAGR of 11.26% from 2025 to 2032. It expands as hydrogen production, storage, and end-use assets scale across industrial decarbonization and mobility programs, increasing the need for continuous leak monitoring in safety-critical environments. It also benefits from stricter plant safety practices and the integration of detection systems with alarms, ventilation, and shutdown controls across high-risk operating areas.
| REPORT ATTRIBUTE | DETAILS |
|---|---|
| Historical Period | 2020-2023 |
| Base Year | 2024 |
| Forecast Period | 2025-2032 |
| Hydrogen Detection Market Size 2025 | USD 279.83 million |
| Hydrogen Detection Market, CAGR | 11.26% |
| Hydrogen Detection Market Size 2032 | USD 592.9 million |
Key Market Trends & Insights
- The market expanded from USD 145.36 million in 2018 to USD 279.83 million in 2025 and is projected to reach USD 592.9 million by 2032, supported by a growing installed base of hydrogen detection systems across industrial environments.
- It is projected to grow at an 26% CAGR during 2025–2032 as hydrogen infrastructure scales across multiple process stages.
- Europe accounted for a 2% share in 2025, supported by hydrogen projects and safety compliance needs across production and storage assets.
- Asia Pacific represented a 9% share in 2025, driven by expanding industrial activity and hydrogen adoption across major economies.
- Fixed Detectors accounted for the largest share of 0% in 2025, supported by continuous monitoring requirements in plant-wide safety programs.
Segment Analysis
The hydrogen detection market is shaped by deployment preferences that prioritize continuous monitoring, rapid response, and seamless integration with site safety systems. Buyers typically evaluate detector performance under real-world operating conditions, along with calibration requirements and long-term operating costs, particularly in environments where hydrogen handling is concentrated around compression, storage, and transfer points. Market growth is also supported by the broader adoption of safety-instrumented functions that connect detection outputs with alarm systems and mitigation workflows.
The market continues to diversify across fixed, portable, inline, and wearable formats, reflecting differences in inspection frequency, mobility requirements, and monitoring coverage strategies. Technology selection is influenced by sensitivity requirements, environmental conditions, tolerance to cross-sensitivity, and compatibility with existing control systems. This diversity supports adoption across a broad range of end users, including heavy industry, power generation, mobility, and specialized defense applications.
By Type Insights
Fixed Detectors accounted for the largest share of 64.0% in 2025. This segment leads because it enables continuous, unattended monitoring across critical hydrogen handling points where leak risk is highest. Fixed systems integrate directly with alarm and mitigation infrastructure, improving response times and supporting standardized safety workflows. They are also well suited to facility-wide coverage strategies in sites where hydrogen is produced, stored, internally transported, or used across multiple operational points.
By Detection Range Insights
Detection range selection is shaped by site hazard assessments, code compliance requirements, and the need to balance early warning capability with operational practicality. Lower-ppm ranges support earlier leak identification in enclosed or safety-critical environments where even minor leaks must be detected quickly. Higher-range configurations are more suitable for process environments where gas concentrations may fluctuate during operational transitions, maintenance activities, or abnormal events. As a result, range selection is increasingly aligned with system-level safety design and incident prevention objectives.
By Technology Insights
Electrochemical Sensors accounted for the largest share of 42.5% in 2025. This segment leads due to its established field performance and widespread adoption in gas detection applications. It benefits from mature supply chains and standardized maintenance practices that industrial buyers can implement at scale. Electrochemical sensing also remains a preferred option where reliability, cost efficiency, and compatibility with both fixed and portable detection platforms are important purchasing considerations.
By End User Insights
Industrial demand remains central to the market, as facilities require continuous monitoring across production, storage, and utilization points where hydrogen handling is routine. Automotive adoption is strengthening as hydrogen mobility ecosystems expand and safety monitoring becomes increasingly embedded in refueling and vehicle-related environments. Energy and power applications are also adopting hydrogen detection systems to manage risks associated with hydrogen blending, storage, and emerging hydrogen-to-power configurations. In addition, the market supports oil and gas and other high-risk sectors where hazard management programs require reliable detection coverage across critical zones.
By Process Stage Insights
Generation remains a major demand driver because detection coverage is required around electrolyzers, reformers, compression units, and auxiliary systems. Storage increases system requirements at tanks, valves, and transfer interfaces where leak risks are concentrated and continuous monitoring is essential. Transportation expands detection needs across pipelines, trailers, and handling nodes where exposure conditions vary by asset type. Usage supports ongoing deployments in industrial combustion systems, fuel cells, and hydrogen-enabled equipment where operational safety depends on early detection and rapid response.
Hydrogen Detection Market Drivers
Expansion of Hydrogen Production and Infrastructure
The market is growing alongside the expansion of hydrogen production capacity across electrolyzers, reformers, and integrated hydrogen hubs, which increases the number of leak-prone interfaces requiring monitoring. It also benefits from the broader deployment of storage tanks, compressors, and transfer systems where hydrogen handling is frequent and safety coverage is essential. Rising investments in fueling infrastructure and industrial hydrogen applications further support demand for detection solutions across multiple operational zones. Growth is reinforced as operators standardize safety programs and implement facility-wide monitoring architectures.
Safety Compliance and Risk Mitigation Requirements
Demand is supported by safety regulations and internal operational risk controls that require continuous monitoring in hazardous environments. Facilities increasingly mandate fixed detection points at critical hydrogen handling areas and require integration with alarm systems and emergency response infrastructure. These systems improve incident prevention by enabling earlier leak identification and faster mitigation measures. The market also aligns with broader industrial safety investments focused on instrumentation, automation, and protective controls.
Integration with Industrial Control and Safety Systems
The market is expanding as hydrogen detection systems become more closely integrated with distributed control systems and safety-instrumented functions that automate alarms, ventilation, and shutdown actions. It benefits from digital monitoring and centralized system visibility, which improve response coordination across large or complex facilities. Adoption is also increasing where operations teams require better traceability, diagnostics, and consistent maintenance planning across multiple detectors. This integration supports scalable deployments by enabling standardized installation and monitoring practices across sites.
For instance, MSA’s Ultima X5000 Gas Monitor specifies combustible gas measurement up to 0–100% LEL and provides industrial-ready interfaces, including dual 4–20 mA current source outputs plus HART, with nominal power listed at less than 5 W (10–30 VDC). These features provide practical integration points for linking detectors with DCS/SIS logic and broader asset management workflows.
Growth of Hydrogen Mobility and Emerging End-Use Applications
The market is further reinforced by the expansion of hydrogen mobility programs, including refueling stations and hydrogen-powered equipment, where continuous leak monitoring is critical. It supports safety requirements across vehicle-adjacent environments and hydrogen storage systems used in transport applications. Demand also benefits from the growth of fuel-cell deployments and hydrogen-enabled industrial processes. Adoption is increasing as operators prioritize compact, reliable sensing solutions capable of performing under variable operating conditions.
For instance, Nel reported that its next-generation H2Station offers configurations for 70 MPa (700 bar) and 35 MPa fueling and stated per-dispenser throughput targets of up to 100 cars or 50 buses per day, alongside a Denmark factory capacity of up to 300 stations per annum. This level of deployment directly increases the number of forecourt zones requiring continuous leak detection.
Hydrogen Detection Market Challenges
The market faces challenges related to performance under harsh operating conditions, including temperature variation, humidity, and contamination, all of which can affect sensor behavior and maintenance frequency. It must also address cross-sensitivity and calibration management across diverse environments, which can increase the operational burden for large-scale deployments. Procurement can become more complex when buyers require certified systems with proven field performance, often extending qualification timelines. Cost pressures also emerge as facilities expand monitoring coverage while seeking to optimize total cost of ownership.
For instance, NevadaNano’s MPS Hydrogen Gas Sensor is specified to operate from -40°C to 75°C and 0–100% RH, is positioned as requiring no field calibration, and is listed with a 15-year sensor life, alongside an ultra-low-power variant specified at 1.35 mW. It also carries global safety certifications including Class I, Div. 1/Zone 0 and ATEX/IECEx, as well as an IP65+ rating. The company has also publicly reported five years of continuous operation with no additional calibration and no deterioration or drift.
The market must also manage installation and integration complexity, particularly where legacy systems and heterogeneous safety architectures remain in place across sites. High-throughput facilities may face downtime constraints because maintenance windows are limited and detector accessibility varies by location. In addition, suppliers must meet site-specific requirements related to enclosure ratings, hazardous area classifications, and communication protocols. Balancing high sensitivity with long-term operational stability across different hydrogen handling conditions remains a key challenge.
Hydrogen Detection Market Trends and Opportunities
The market is moving toward smarter monitoring architectures that support centralized visibility, diagnostics, and integration with broader safety and asset management systems. It benefits from increasing digital readiness, which makes it easier to scale detector networks and improve maintenance planning. These developments create opportunities for solutions that reduce false alarms and improve reliability in mixed-gas and demanding industrial environments. Demand is also rising for compact detector designs and flexible installation options that can support a variety of deployment scenarios.
For instance, Dräger’s REGARD® 7000 supports remote access via HART® and a Modbus RTU interface for higher-level system processing, while publishing a typical measurement and status transmission time of 1 second and a maximum of 3.3 seconds, along with a long-distance gateway transmission range of up to 3,000 meters. These features support centralized diagnostics across distributed detector networks.
The market is also seeing growing opportunity in solutions designed for emerging hydrogen applications, including refueling infrastructure, fuel-cell systems, and new industrial hydrogen process configurations. Innovation in sensing technologies is improving detection thresholds and response times, creating further opportunities for technology providers. Portable and wearable formats are also gaining traction in inspection-intensive environments where technicians require on-demand safety confirmation. The market is expected to expand further as hydrogen project pipelines transition from pilot phases to scaled commercial operations.
Regional Insights
North America
North America is supported by the adoption of industrial safety instrumentation and ongoing hydrogen infrastructure buildout across both production and end-use environments. The region accounted for 20.0% of the market in 2025, reflecting continued deployments in industrial facilities and hydrogen mobility ecosystems. Demand is reinforced by the need to standardize safety coverage across facilities where hydrogen handling points are distributed across multiple zones.
Europe
Europe is driven by strong hydrogen project activity and rigorous safety compliance requirements across production, storage, and utilization assets. The region accounted for 34.2% of the market in 2025, supported by broader hydrogen infrastructure development and increasing facility-level monitoring needs. Growth is also aided by the modernization of industrial safety systems and the wider adoption of integrated detection and mitigation workflows.
Asia Pacific
Asia Pacific is expanding alongside industrial growth and rising hydrogen adoption across major economies, increasing demand for detection coverage in production and handling environments. The region represented 33.9% of the market in 2025, supported by the scaling of industrial applications and infrastructure deployment. It also benefits from strong manufacturing activity and a growing installed base of safety monitoring systems.
Latin America
Latin America is growing as hydrogen initiatives and industrial modernization efforts increase demand for safety monitoring across emerging hydrogen value chains. The region accounted for 6.0% of the market in 2025, supported by selective project development and ongoing investments in safety instrumentation. Broader industrial safety upgrades in high-risk operating environments also contribute to market growth.
Middle East & Africa
The Middle East & Africa market is strengthening as large-scale energy and industrial assets integrate hydrogen projects and expand safety monitoring practices. The region accounted for 5.9% of the market in 2025, supported by hydrogen project pipelines and increasing safety investments around storage and handling assets. Demand is further reinforced by the need for facility-wide monitoring in high-risk operating environments.
Competitive Landscape
The hydrogen detection market remains competitive, with vendors differentiating themselves through sensor technology, detection thresholds, response time, ruggedization, and system integration capabilities. Competition is strongly influenced by reliability under real operating conditions, calibration strategies, and lifecycle service support that reduces downtime and maintenance effort. Buyers increasingly prefer platforms that integrate with plant safety systems and enable centralized monitoring across multiple detection points. The competitive landscape continues to evolve as suppliers expand their portfolios across fixed, portable, inline, and wearable formats to address diverse deployment requirements.
.
Figaro Engineering Inc. competes through gas sensing expertise and component-level capabilities that support integration into broader detection platforms. It benefits from positioning where manufacturers require stable sensor performance and dependable supply for safety-critical deployments. It also aligns its product development with industrial applications that demand long-term reliability across varying operating conditions. It remains relevant where system integrators and OEMs prioritize proven sensing performance and consistent quality.
The industry research and growth report includes detailed analyses of the competitive landscape of the market and information about key companies, including:
- Figaro Engineering Inc.
- Teledyne Gas and Flame Detection
- NevadaNano
- H2Scan
- Ambetronics Engineers Pvt. Ltd.
- Honeywell International Inc.
- Emerson
- Membrapor AG
- MSA
- Sensidyne, LP
- RIKEN KEIKI Co., Ltd.
- Eagle Eye Power Solutions, LLC
- Others
Qualitative and quantitative analysis of companies has been conducted to help clients understand the wider business environment as well as the strengths and weaknesses of key industry players. Data is qualitatively analyzed to categorize companies as pure play, category-focused, industry-focused, and diversified; it is quantitatively analyzed to categorize companies as dominant, leading, strong, tentative, and weak.
Recent Developments
- In January 2026, H2Scan announced a distribution partnership under which Angst+Pfister Sensors and Power AG would serve as the exclusive distributor for H2Scan products in Germany and Switzerland, expanding access to hydrogen detection systems used across transformers, industrial processes, energy storage systems, and fuel cells.
- In February 2026, NevadaNano announced that its MPS flammable gas sensor was integrated into Sensorex Oy’s SX-Alpha fixed gas detection platform as part of a collaboration aimed at long-lasting, reliable fixed gas detection performance.
- In May 2025, Honeywell launched a new Hydrogen Leak Detector (HLD) solution engineered to identify microscopic hydrogen leaks in real time using thermal conductivity detection, with sensitivity down to 50 parts per million (ppm).
- In February 2025, Dai Nippon Printing (DNP) and Yokohama National University (YNU) announced the successful development of a specialized Hydrogen Detection System that uses a unique "color-changing" mechanism.
Report Scope
| Report Attribute | Details |
| Historic year | 2018 |
| Market size value in 2018 | USD 145.36 million |
| Market size value in 2025 | USD 279.83 million |
| Revenue forecast in 2032 | USD 592.9 million |
| Growth rate (CAGR) | 11.26% (2025–2032) |
| Base year | 2025 |
| Forecast period | 2025–2032 |
| Quantitative units | USD million |
| Segments covered | By Type Outlook: Fixed Detectors, Portable Detectors, Inline Detectors, Wearable Detectors; By Detection Range Outlook: 0–1,000 ppm, 0–5,000 ppm, 0–20,000 ppm, >20,000 ppm; By Technology Outlook: Electrochemical Sensors, Catalytic Sensors, Thermal Conductivity Sensors, Solid-State Sensors, Infrared Sensors, Others; By End User Outlook: Industrial, Automotive, Energy and Power, Oil and Gas, Others; By Process Stage Outlook: Generation, Storage, Transportation, Usage |
| Regional scope | North America, Europe, Asia Pacific, Latin America, Middle East & Africa |
| Key companies profiled | Figaro Engineering Inc., Teledyne Gas and Flame Detection, NevadaNano, H2Scan, Ambetronics Engineers Pvt. Ltd., Honeywell International Inc., Emerson, Membrapor AG, MSA, Sensidyne, LP, RIKEN KEIKI Co., Ltd., Eagle Eye Power Solutions, LLC, Others companies |
| No. of Pages | 340 |
Segmentation
BY TYPE
- Fixed Detectors
- Portable Detectors
- Inline Detectors
- Wearable Detectors
BY DETECTION RANGE
- 0–1,000 ppm
- 0–5,000 ppm
- 0–20,000 ppm
- >20,000 ppm
BY TECHNOLOGY
- Electrochemical Sensors
- Catalytic Sensors
- Thermal Conductivity Sensors
- Solid-State Sensors
- Infrared Sensors
- Others
BY END USER
- Industrial
- Automotive
- Energy and Power
- Oil and Gas
- Others (Aerospace & Defense, etc.)
BY PROCESS STAGE
- Generation
- Storage
- Transportation
- Usage
BY REGION
- North America
- U.S.
- Canada
- Mexico
- Europe
- Germany
- France
- U.K.
- Italy
- Spain
- Rest of Europe
- Asia Pacific
- China
- Japan
- India
- South Korea
- South-east Asia
- Rest of Asia Pacific
- Latin America
- Brazil
- Argentina
- Rest of Latin America
- Middle East & Africa
- GCC Countries
- South Africa
- Rest of the Middle East and Africa
Request a Free Sample
Fill in your details and we'll send you a free sample report.
- Sample data tables & charts
- Research methodology
Need a Custom Version of This Report?
Tailor the scope, geography, or segments to your exact requirements.
- Custom geography or segment scope
- Direct access to our analyst team
Frequently Asked Questions
What is the market size of the Global Hydrogen Detection Market in 2025 and its forecast for 2032?
What is the CAGR of the Global Hydrogen Detection Market during 2025–2032?
Which segment leads the market by type?
What factors are driving market growth?
Who are the key players in the market?
Which region holds the largest share of the market?
Table of Content
Chapter 1. Report Introduction
- 1.1 Report Description & Purpose
- 1.1.1 Report Title & Market Definition
- 1.1.2 Unique Selling Propositions (USP) & Key Differentiators
- 1.1.3 Value Proposition for Stakeholders
- 1.2 Research Objectives
- 1.2.1 Market Sizing Objectives (Volume & Revenue)
- 1.2.2 Segmentation Objectives
- 1.2.3 Competitive Intelligence Objectives
- 1.2.4 Forecast & Scenario Objectives
- 1.3 Report Scope
- 1.3.1 Hydrogen Detection Scope – Types & Subtypes Covered
- 1.3.2 Geographic Scope – Regions & Countries Covered
- 1.3.3 Historical Period, Base Year & Forecast Period (2025; forecast to 2032)
- 1.3.4 Inclusions & Exclusions
- 1.4 HS Code & Classification Framework
- 1.5 Currency, Units & Pricing Basis
- 1.6 Target Stakeholders
- 1.7 Limitations & Assumptions
Chapter 2. Executive Summary
- 2.1 Global Hydrogen Detection Market Snapshot
- 2.1.1 Market Size – Historical (2025) & Forecast (2025-2032) (2025: USD 279.83 million → 2032: USD 592.9 million)
- 2.1.2 Volume & Revenue – Global Totals
- 2.1.3 Key Market Highlights – Top Five Facts
- 2.2 Hydrogen Detection Market Segmentation Snapshot
- 2.2.1 Market Split by Region – 2025 vs. 2032
- 2.3 Competitive Snapshot
- 2.3.1 Top 10 Players by Revenue Share – 2025
- 2.3.2 Top 10 Players by Volume Share – 2025
- 2.3.3 Recent Strategic Developments (18-Month Summary)
- 2.4 Key Investment Highlights & Strategic Conclusions
Chapter 3. Hydrogen Detection Market Dynamics & Industry Analysis
- 3.1 Market Overview & Context
- 3.1.1 Hydrogen Detection Market Position in the Broader Automotive Value Chain
- 3.1.2 OEM vs. Replacement Market Dynamics
- 3.1.3 Market Maturity & Development Stage by Region
- 3.2 Hydrogen Detection Market Drivers
- 3.3 Hydrogen Detection Market Restraints & Challenges
- 3.4 Hydrogen Detection Market Opportunities
- 3.5 Porter's Five Forces Analysis
- 3.5.1 Threat of New Entrants
- 3.5.2 Bargaining Power of Suppliers
- 3.5.3 Bargaining Power of Buyers
- 3.5.4 Threat of Substitutes
- 3.5.5 Competitive Rivalry – Intensity Assessment
- 3.6 Hydrogen Detection Value Chain Analysis
- 3.6.1 Upstream – Raw Material/Input Suppliers
- 3.6.1.1 Raw Material/Input 1
- 3.6.1.2 Raw Material/Input 2
- 3.6.1.3 Raw Material/Input 3
- 3.6.2 Midstream – Production/Manufacturing/Service Delivery
- 3.6.2.1 Production/Process Overview
- 3.6.2.2 Key Facility Locations & Capacity by Manufacturer
- 3.6.3 Downstream – Distribution & End Consumer
- 3.6.3.1 Primary Channel – B2B/OEM
- 3.6.3.2 Secondary Channels – Dealer, Retail, Online, Direct
- 3.6.4 Value Chain Profitability Analysis
- 3.6.1 Upstream – Raw Material/Input Suppliers
- 3.7 PESTEL Analysis
- 3.7.1 Political Factors
- 3.7.2 Economic Factors
- 3.7.3 Social Factors
- 3.7.4 Technological Factors
- 3.7.5 Environmental Factors
- 3.7.6 Legal Factors
- 3.8 Hydrogen Detection Supply Chain Analysis
- 3.8.1 Raw Material/Input Supply Risk Assessment
- 3.8.2 Manufacturing Concentration Risk (Geographic Exposure)
- 3.8.3 Trade Disruption Impact Analysis
- 3.9 Regulatory & Policy Landscape
Note: The regulatory and policy landscape section covers regulations based on their applicability to the market, Hydrogen Detection category, geography, and scope of the study. Only regulatory frameworks with a material impact on operations, compliance, trade, sustainability, or market access are analyzed in detail.
Chapter 4. Key Investment Pockets & Opportunity Analysis
- 4.1 Hydrogen Detection Market Attractiveness Analysis
- 4.1.1 By Region – Investment Attractiveness Matrix (Volume × CAGR)
- 4.2 Absolute Revenue Growth Opportunity
- 4.2.1 By Region – Absolute USD Growth Through 2032
- 4.3 Incremental Volume Opportunity
- 4.3.1 By Region – Incremental Volume Through 2032
- 4.3.2 Segment – Incremental Volume
- 4.4 Emerging Submarket Opportunity Deep Dive (Subject to Applicability)
- 4.5 Emerging Market Opportunity Scorecards
- 4.5.1 United States
- 4.5.2 Europe
- 4.5.3 Asia
- 4.5.4 Middle East & Africa
Note: Emerging Market Opportunity Scorecards will be included based on relevance and strategic importance. Regions listed are indicative and may vary depending on data availability and market dynamics.
Chapter 5. Hydrogen Detection Import-Export Analysis & Trade Flows
- 5.1 Global Trade Overview
- 5.1.1 Global Export Value by Country (2025)
- 5.1.2 Global Export Volume by Country (2025)
- 5.1.3 Global Import Value by Country (2025)
- 5.1.4 Global Import Volume by Country (2025)
- 5.1.5 Net Trade Balance by Country (2025)
- 5.2 Export Analysis – Segment
- 5.2.1 Type 1 (HS Code)
- 5.2.2 Type 2 (HS Code)
- 5.2.3 Type 3 (HS Code)
- 5.2.4 Type 4 (HS Code)
- 5.2.5 Type 5 (HS Code)
- 5.3 Import Analysis – Segment
- 5.3.1 Type 1 (HS Code)
- 5.3.2 Type 2 (HS Code)
- 5.3.3 Type 3 (HS Code)
- 5.3.4 Type 4 (HS Code)
- 5.3.5 Type 5 (HS Code)
- 5.4 Average Unit Trade Prices
- 5.4.1 Average Export Price – Segment & Country
- 5.4.2 Average Import Price – Segment & Source Country
- 5.4.3 Price Trends (2025)
- 5.5 Key Trade Route Analysis
- 5.5.1 Trade Route 1
- 5.5.2 Trade Route 2
- 5.5.3 Trade Route 3
- 5.5.4 Trade Route 4
- 5.5.5 Trade Route 5
- 5.6 Trade Policy Impact Assessment
- 5.6.1 US Anti-Dumping & Section 301 Tariffs
- 5.6.2 EU Customs Union Impact
- 5.6.3 Major Free Trade Agreements
- 5.6.4 USMCA Rules of Origin
Note: Trade policy analysis will be included only where relevant to the Hydrogen Detection market.
Chapter 6. Competitive Landscape & Company Benchmarking
- 6.1 Hydrogen Detection Market Concentration & Structure
- 6.1.1 Herfindahl-Hirschman Index (HHI) – vs. 2025
- 6.1.2 Tier 1, Tier 2 & Tier 3 Market Structure
- 6.1.3 Global, Regional & Local Player Dynamics
- 6.2 Hydrogen Detection Market Share Analysis – 2025
- 6.2.1 Global Revenue Share by Company
- 6.2.2 Global Volume Share by Company
- 6.2.3 Regional Revenue Share
- 6.2.4 Market Share Evolution ( vs. 2025)
- 6.2.5 OEM Segment Share by Company
- 6.2.6 Replacement Segment Share by Company
- 6.3 Production/Delivery Capacity & Facility Analysis
- 6.3.1 Global Installed Capacity
- 6.3.2 Capacity Utilization Rates
- 6.3.3 Production/Output Volume
- 6.3.4 Facility Locations & Capacity Map
- 6.3.5 Planned Capacity Additions
- 6.4 Hydrogen Detection Competitive Benchmarking Matrix
- 6.4.1 Revenue, Volume, CAGR & Profitability Comparison
- 6.4.2 Channel Revenue Mix
- 6.4.3 Geographic Revenue Exposure
- 6.4.4 R&D Intensity
- 6.4.5 Sustainability Maturity
- 6.5 Strategic Developments in Hydrogen Detection (Last 24 Months)
- 6.5.1 Mergers, Acquisitions & Divestments
- 6.5.2 New Hydrogen Detection Launches
- 6.5.3 Facility Expansions
- 6.5.4 Strategic Alliances, Joint Ventures & Partnerships
- 6.5.5 Distribution Expansion & Market Entry
- 6.5.6 Sustainability & ESG Initiatives
- 6.6 Competitive Strategy Mapping
- 6.6.1 Leader, Challenger, Follower & Niche Classification
- 6.6.2 Pricing Strategy Comparison
- 6.6.3 Channel Strategy Matrix
Note: Strategic developments are included based on their materiality and the availability of reliable information.
Chapter 7. Global Hydrogen Detection Market – By Distribution Channel
- 7.1 Segment Overview
- 7.1.1 Volume & Revenue Split by Channel (2025 & 2032)
- 7.1.2 Channel Mix Evolution (2025-2032)
Chapter 8. Regional Market Analysis – Global Overview
- 8.1 Global Regional Overview
- 8.1.1 Regional Volume Share
- 8.1.2 Regional Revenue Share
- 8.1.3 Regional Volume by Region
- 8.1.4 Regional Revenue by Region
- 8.1.5 Regional Forecast Through 2032
- 8.2 Cross-Regional Segment Analysis
- 8.2.1 By Distribution Channel
- 8.2.2 By Brand/Price Tier
Chapter 9. North America Hydrogen Detection Market
- 9.1 United States
- 9.2 Canada
- 9.3 Mexico
Chapter 10. Europe Hydrogen Detection Market
- 10.1 Germany
- 10.2 France
- 10.3 Italy
- 10.4 United Kingdom
- 10.5 Spain
- 10.6 Poland
- 10.7 Russia
- 10.8 Netherlands
- 10.9 Belgium
- 10.10 Sweden
- 10.11 Denmark
- 10.12 Norway
- 10.13 Rest of Europe
Chapter 11. Asia Pacific Hydrogen Detection Market
- 11.1 China
- 11.2 India
- 11.3 Japan
- 11.4 South Korea
- 11.5 Thailand
- 11.6 Indonesia
- 11.7 Vietnam
- 11.8 Malaysia
- 11.9 Australia
- 11.10 Rest of Asia Pacific
Chapter 12. Latin America Hydrogen Detection Market
- 12.1 Brazil
- 12.2 Argentina
- 12.3 Colombia
- 12.4 Chile
- 12.5 Rest of Latin America
Chapter 13. Middle East Hydrogen Detection Market
- 13.1 Saudi Arabia
- 13.2 United Arab Emirates
- 13.3 Turkey
- 13.4 Israel
- 13.5 Iran
- 13.6 Rest of the Middle East
Chapter 14. Africa Hydrogen Detection Market
- 14.1 South Africa
- 14.2 Egypt
- 14.3 Nigeria
- 14.4 Morocco
- 14.5 Rest of Africa
Chapter 15. Hydrogen Detection Company Profiles
- 15.1 [Company 01]
- 15.1.1 Company Overview
- 15.1.2 Key Management Personnel
- 15.1.3 Products & Services Portfolio
- 15.1.4 Financial Performance
- 15.1.5 Key Market Focus & Geographic Presence
- 15.1.6 Recent Developments & Strategic Initiatives
Note: The company profile list is preliminary and may change based on research findings, market developments, data availability, and client requirements.
Chapter 16. Appendices
- Appendix A – List of Abbreviations & Acronyms
- Appendix B – Industry Classification Code Reference – Full Series
- Appendix C – Production & Capacity Data Tables
- Appendix D – End-Use & Demand Base Tables
- Appendix E – Consumption & Replacement Rate Assumptions
- Appendix F – ASP Reference Tables
- Appendix G – Manufacturing & Facility Database
- Appendix H – Import-Export Data Tables
- Appendix I – Regulatory Summary Tables
- Appendix J – Primary Research Participant List (Anonymized)
- Appendix K – Primary Research Questionnaire Framework
- Appendix L – Data Sources & Bibliography
- Appendix M – Market Size Divergence & Source Comparison
Chapter 17. Research Methodology
- 17.1 Research Framework & Philosophy
- 17.2 Secondary Research – Sources, Hierarchy & Data Extraction
- 17.3 Data Modeling – Bottom-Up & Top-Down Market Sizing
- 17.4 Primary Research – Stakeholder Framework, LOI & Sample Sizes
- 17.5 Forecast Methodology – Regression, Scenario & Sensitivity Analysis
- 17.6 Quality Control – Four-Layer Validation Framework
- 17.7 Limitations & Standard Assumptions
- 17.8 Disclaimer
