Market Overview
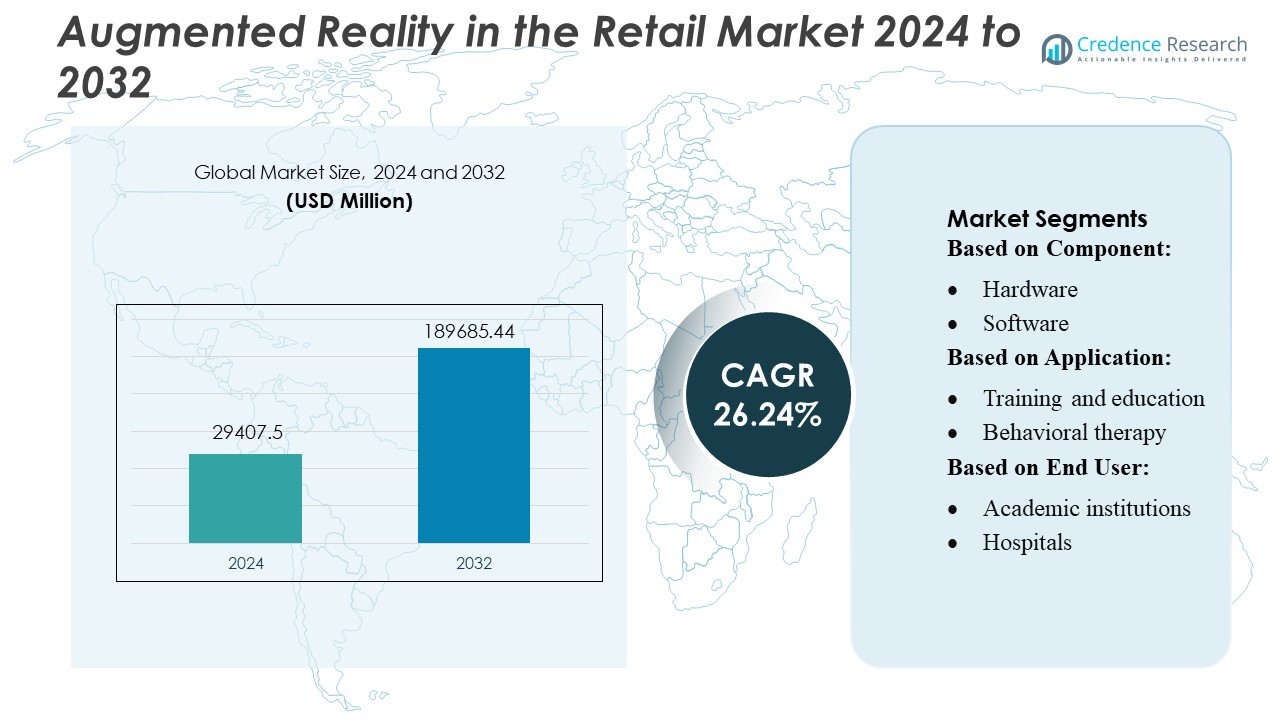
Augmented Reality in the Retail Market size was valued USD 29407.5 million in 2024 and is anticipated to reach USD 189685.44 million by 2032, at a CAGR of 26.24% during the forecast period.
| REPORT ATTRIBUTE |
DETAILS |
| Historical Period |
2020-2023 |
| Base Year |
2024 |
| Forecast Period |
2025-2032 |
| Augmented Reality in the Retail Market Size 2024 |
USD 29407.5 Million |
| Augmented Reality in the Retail Market, CAGR |
14.80% |
| Augmented Reality in the Retail Market Size 2032 |
USD 189685.44 Million |
The augmented reality in retail market is shaped by a competitive mix of major technology innovators that provide advanced AR hardware, software platforms, and immersive visualization tools for retailers worldwide. These companies focus on improving spatial mapping, AI-driven personalization, and seamless integration across mobile and web channels to enhance virtual try-ons, product configuration, and in-store navigation. North America remains the leading region in this market, holding approximately 40% of the global share, supported by strong digital infrastructure, high consumer adoption of AR applications, and significant investment from large retail and technology firms.
Access crucial information at unmatched prices!
Request your sample report today & start making informed decisions powered by Credence Research Inc.!
Download Sample
Market Insights
- The Augmented Reality in Retail Market reached USD 29,407.5 million in 2024 and is projected to hit USD 189,685.44 million by 2032, growing at a strong 24% CAGR during the forecast period.
- Market growth is driven by rising demand for virtual try-ons, 3D product visualization, and AI-enabled personalization that improves customer engagement and reduces product return rates.
- Key trends include the expansion of web-based AR, increasing use of AR smart mirrors, and the integration of spatial computing to enhance both online and in-store shopping experiences.
- Competition intensifies as technology providers enhance AR hardware, software, and cloud capabilities, though high implementation costs and data-security concerns act as major restraints.
- North America leads the market with around 40% share, while Asia-Pacific shows the fastest growth; the fashion and beauty segment accounts for the largest application share, supported by high adoption of virtual try-on technologies.
Market Segmentation Analysis:
By Component:
The hardware segment leads the augmented reality in retail market, holding about 55% market share due to strong demand for AR headsets, smart glasses, sensors, and display devices that enable immersive shopping experiences. Retailers prioritize hardware because it delivers accurate product visualization and enhances in-store engagement. Software grows steadily as brands adopt AR applications for virtual try-ons and product configurators, while services expand with rising integration and maintenance needs. Hardware remains dominant as retailers increasingly invest in robust AR devices to support interactive product demonstrations and customer experience enhancement.
- For instance, Meta sold 1,486,996 XR devices in Q3, including both its smart glasses and VR headsets, underlining its strong hardware deployment. This total consisted of an estimated 989,515 smart glasses (Ray-Ban Meta and Oakley HSTN) and 497,481 VR headsets (Quest 3 and Quest 3S).
By Application:
Training and education is the dominant application segment, accounting for nearly 40% market share, driven by its wide use in staff training, store layout planning, and product demonstration preparation. Retailers leverage AR-based simulations to improve employee performance while reducing training time and costs. Surgery, behavioral therapy, and medical imaging are smaller and more specialized AR use cases, applied mainly in health-related retail categories such as medical devices or wellness centers. However, training and education remain the largest due to scalable implementation and clear productivity benefits across retail chains.
- For instance, Lenovo’s ThinkReality VRX headset delivers enterprise-grade training: it features 4-camera 6-DoF optical tracking, 12 GB of RAM, and 128 GB of storage, enabling realistic mixed reality simulations that help trainees practice complex scenarios.
By End User:
Hospitals lead this segment with approximately 45% market share, as they widely adopt AR tools for patient engagement, treatment guidance, and enhanced service delivery within retail-linked healthcare environments. Clinics and dentists also use AR for product visualization and patient education, while academic institutions adopt it for research and demonstration of medical retail technologies. Though other end users contribute to niche applications, hospitals dominate due to higher AR investment capacity and strong demand for tools that improve patient shopping decisions for medical products and service packages.
Key Growth Drivers
- Rising Adoption of Immersive Customer Engagement Tools
Retailers increasingly deploy AR solutions to elevate customer engagement through interactive product visualization and virtual try-ons. The technology enables consumers to examine product details, compare variations, and personalize selections without physical interaction, resulting in higher purchase confidence and reduced return rates. As mobile AR apps and in-store smart mirrors mature, retailers gain measurable improvements in conversion rates and customer satisfaction. This shift accelerates AR adoption as brands compete to differentiate experiences and strengthen omnichannel strategies.
- For instance, Snap, Inc. reports that its community uses AR Lenses in Snapchat’s camera 8 billion times per day, with over 400,000 developers having built more than 4 million Lenses using its AR tools.
- Expansion of AR-Enabled Omnichannel Retailing
The rapid integration of AR within omnichannel frameworks drives strong market growth as retailers blend digital and physical shopping experiences. AR bridges in-store and online channels by offering consistent product visualization, guided navigation, and contextual information across devices. Retailers leverage AR to streamline product discovery and reduce friction in the purchase journey, especially in home décor, fashion, and electronics. The enhanced continuity between physical stores, websites, and mobile apps strengthens customer retention and increases dwell time, supporting greater AR investment.
- For instance, TeamViewer reports that Frontline accelerates process execution by up to 35% and achieves 100% accuracy in inspections.
- Advancements in AR Hardware, Software, and AI Algorithms
Continuous progress in computer vision, spatial mapping, and AI-driven object recognition significantly improves AR accuracy and usability. Retailers benefit from faster rendering, more realistic overlays, and adaptive personalization engine capabilities that tailor recommendations in real time. Additionally, cost reductions in AR-compatible devices, such as smartphones and smart glasses, expand accessibility for both consumers and store associates. These advancements enable scalable deployment of AR applications for inventory management, virtual store design, and interactive marketing, bolstering long-term AR retail adoption.
Key Trends & Opportunities
1. Growth of Virtual Try-On Solutions Across Fashion and Beauty
Virtual try-on technologies are rapidly gaining traction as retailers respond to consumer demand for convenience and personalization. AR-driven fitting rooms and facial mapping tools allow customers to preview apparel, eyewear, accessories, and cosmetics with high precision. This trend presents strong opportunities for brands to reduce product return rates, optimize inventory planning, and introduce customized product recommendations. As accuracy improves through AI integration, virtual try-ons are becoming essential components of digital retail strategies, enabling scalable and interactive consumer engagement.
- For instance, Sony developed an XR head-mounted display equipped with 4 K OLED microdisplays and six built-in cameras and sensors for real-time space tracking, enabling lifelike rendering of 3D textures and facial expressions.
2. Expansion of AR-Powered In-Store Navigation and Smart Assistance
Retailers increasingly adopt AR-based indoor navigation and product-finding features to enhance in-store efficiency. By overlaying directions, promotions, and product details in real time, AR helps customers locate items faster and discover personalized offers. For store associates, AR tools streamline stock checks, planogram compliance, and order picking. This trend presents opportunities for retailers to modernize store operations, increase footfall satisfaction, and leverage behavioral insights derived from AR interactions to refine merchandising and layout strategies.
- For instance, Time-of-Flight depth sensor has a 75° × 70° field of view and captures at 544 × 480 px, while its world-sensing system uses three 1-MP cameras with 100° × 100° FOV.
3. Rising Use of AR for Interactive Advertising and Product Storytelling
Brands are adopting AR to create immersive marketing campaigns that elevate product storytelling and consumer interaction. AR-enabled packaging, 3D product demos, and experiential ads allow shoppers to explore features dynamically, increasing brand recall and engagement. This trend offers opportunities for retailers to differentiate their campaigns, gather deeper consumer data, and deliver contextual promotions. As social media AR filters and web-based AR tools gain popularity, retailers can reach broader audiences without requiring app downloads.
Key Challenges
1. High Implementation Costs and Integration Complexity
Despite growing interest, AR deployment involves substantial costs related to software development, hardware procurement, system integration, and content creation. Retailers must ensure compatibility with existing POS systems, e-commerce platforms, and inventory databases, which often increases integration complexity. Smaller retailers face financial barriers that slow adoption. Additionally, ensuring continuous app performance, accurate object detection, and seamless user experience requires ongoing investment in updates and infrastructure, limiting widespread implementation.
2. Consumer Privacy Concerns and Data Security Risks
AR applications collect sensitive user data, including spatial mapping, facial features, and behavioral patterns, raising significant privacy and security concerns. Retailers must comply with strict data protection regulations and ensure secure data processing practices to avoid breaches and protect customer trust. Mismanagement of biometric or location-based data may hinder adoption and expose companies to legal risks. As AR features become more personalized, ensuring transparency and ethical data usage becomes crucial for long-term market acceptance.
Regional Analysis
North America
North America leads the Augmented Reality in Retail market with an estimated 40% market share. Strong digital infrastructure, high smartphone penetration, and early adoption by major retailers drive regional dominance. Companies such as Walmart, Amazon, and IKEA actively integrate AR for virtual try-ons, store navigation, and immersive product visualization. The region also benefits from a mature consumer base accustomed to omnichannel shopping. Continuous investment in AI and AR platforms, along with rising demand for personalized experiences, strengthens market adoption. The U.S. remains the largest contributor, followed by Canada.
Europe
Europe holds approximately 28% of the global market, supported by strong tech adoption and innovation in retail modernization. Retailers in the UK, Germany, and France increasingly deploy AR for virtual fitting rooms, interactive displays, and product customization. Consumers in the region show high acceptance of immersive digital experiences, encouraging retailers to expand AR use in both online and physical stores. Government-backed digital transformation initiatives also support technology adoption. Growing e-commerce penetration and sustainability-focused design tools further boost AR demand, making Europe a significant growth hub.
Asia-Pacific
Asia-Pacific accounts for roughly 25–30% market share, driven by fast digitalization and a strong mobile-first consumer base. China, Japan, South Korea, and India lead AR adoption, supported by large retail ecosystems and rapid growth in online shopping. E-commerce giants like Alibaba, Flipkart, and Rakuten invest heavily in AR-based virtual try-ons and product previews. Rising disposable income and expanding smartphone penetration accelerate market uptake. Increasing integration of AR in fashion, electronics, and beauty retail makes APAC one of the fastest-growing regions.
Latin America
Latin America captures an estimated 7–8% market share in the AR retail market. Growth stems from expanding e-commerce activity, rising digital awareness, and increasing smartphone adoption in countries such as Brazil, Mexico, and Chile. Retailers are gradually adopting AR tools to enhance product visualization, boost customer engagement, and modernize store experiences. Although adoption is slower compared to major markets, improving internet infrastructure and growing interest in virtual shopping experiences support steady growth. Regional retail platforms like MercadoLibre are also introducing AR features, helping accelerate market penetration.
Middle East & Africa
The Middle East & Africa region holds 5–6% market share, driven by rising investment in retail digitalization and smart infrastructure. Countries such as the UAE, Saudi Arabia, and South Africa are early adopters of AR-enabled store navigation, interactive displays, and virtual product demonstrations. Growing 5G availability and strong interest in premium shopping experiences support AR integration in malls and flagship stores. Although adoption remains uneven across the region, increasing smartphone usage and government-backed digital initiatives are strengthening market potential.
Market Segmentations:
By Component:
By Application:
- Training and education
- Behavioral therapy
By End User:
- Academic institutions
- Hospitals
By Geography
- North America
- Europe
- Germany
- France
- U.K.
- Italy
- Spain
- Rest of Europe
- Asia Pacific
- China
- Japan
- India
- South Korea
- South-east Asia
- Rest of Asia Pacific
- Latin America
- Brazil
- Argentina
- Rest of Latin America
- Middle East & Africa
- GCC Countries
- South Africa
- Rest of the Middle East and Africa
Competitive Landscape
The augmented reality in retail market features a competitive landscape dominated by leading technology innovators such as Meta Platforms, Inc., Lenovo Group, Snap, Inc., TeamViewer AG, Sony Corporation, Magic Leap, Incorporated, PTC Inc., Google LLC, Blippar Limited, and Apple, Inc. The augmented reality in retail market continues to intensify as technology providers focus on developing advanced AR platforms, immersive visualization tools, and AI-driven personalization capabilities. Companies compete by enhancing spatial mapping accuracy, improving real-time rendering quality, and expanding interoperability across mobile devices, wearables, and web-based channels. Retailers increasingly seek scalable AR solutions that support virtual try-ons, in-store navigation, product configuration, and interactive marketing, encouraging vendors to invest heavily in innovation. Cloud-based AR engines, lightweight smart hardware, and seamless omnichannel integration have become key differentiators, driving continuous advancements and fostering strategic partnerships between technology developers, retailers, and digital commerce platforms.
Shape Your Report to Specific Countries or Regions & Enjoy 30% Off!
Key Player Analysis
- Meta Platforms, Inc.
- Lenovo Group
- Snap, Inc.
- TeamViewer AG
- Sony Corporation
- Magic Leap, Incorporated
- PTC Inc.
- Google LLC
- Blippar Limited
- Apple, Inc.
Recent Developments
- In September 2024, Meta Platforms, Inc. introduced Orion, previously codenamed Project Nazare, which we believe is the most advanced pair of AR glasses ever made. These lightweight glasses come equipped with high-resolution displays and advanced sensors that allow users to interact with virtual elements in their environment.
- In April 2024, Osso VR introduced Osso Health, an Apple Vision Pro surgical training app. The app enables users to explore and engage with high-fidelity procedural workflows like total knee replacement and carpal tunnel release to provide more immersive training on the latest spatial computing devices.
- In January 2024, Sony Corporation announced the development of an immersive spatial content creation system that includes an XR head-mounted display featuring high-quality 4K OLED Microdisplays and a video see-through function, along with specialized controllers for intuitive interaction with 3D objects.
Report Coverage
The research report offers an in-depth analysis based on Component, Application, End-User and Geography. It details leading market players, providing an overview of their business, product offerings, investments, revenue streams, and key applications. Additionally, the report includes insights into the competitive environment, SWOT analysis, current market trends, as well as the primary drivers and constraints. Furthermore, it discusses various factors that have driven market expansion in recent years. The report also explores market dynamics, regulatory scenarios, and technological advancements that are shaping the industry. It assesses the impact of external factors and global economic changes on market growth. Lastly, it provides strategic recommendations for new entrants and established companies to navigate the complexities of the market.
Future Outlook
- The market will expand as retailers integrate AR deeper into omnichannel strategies to enhance product discovery and customer engagement.
- Virtual try-on technologies will become standard features across fashion, beauty, and eyewear retail.
- AR-driven store navigation and guided assistance will see wider adoption in large-format retail environments.
- Web-based AR will gain traction, reducing the need for app downloads and increasing user accessibility.
- Smart glasses will begin transitioning from enterprise use to consumer shopping experiences.
- AI integration will improve personalization, enabling more accurate product recommendations and visualization.
- AR will play a stronger role in sustainable retail by reducing product returns and optimizing inventory.
- Retailers will invest in AR-powered experiential marketing to strengthen brand differentiation.
- Data analytics from AR interactions will support more precise merchandising and store layout decisions.
- Partnerships between tech vendors and retailers will accelerate innovation and reduce adoption barriers.


