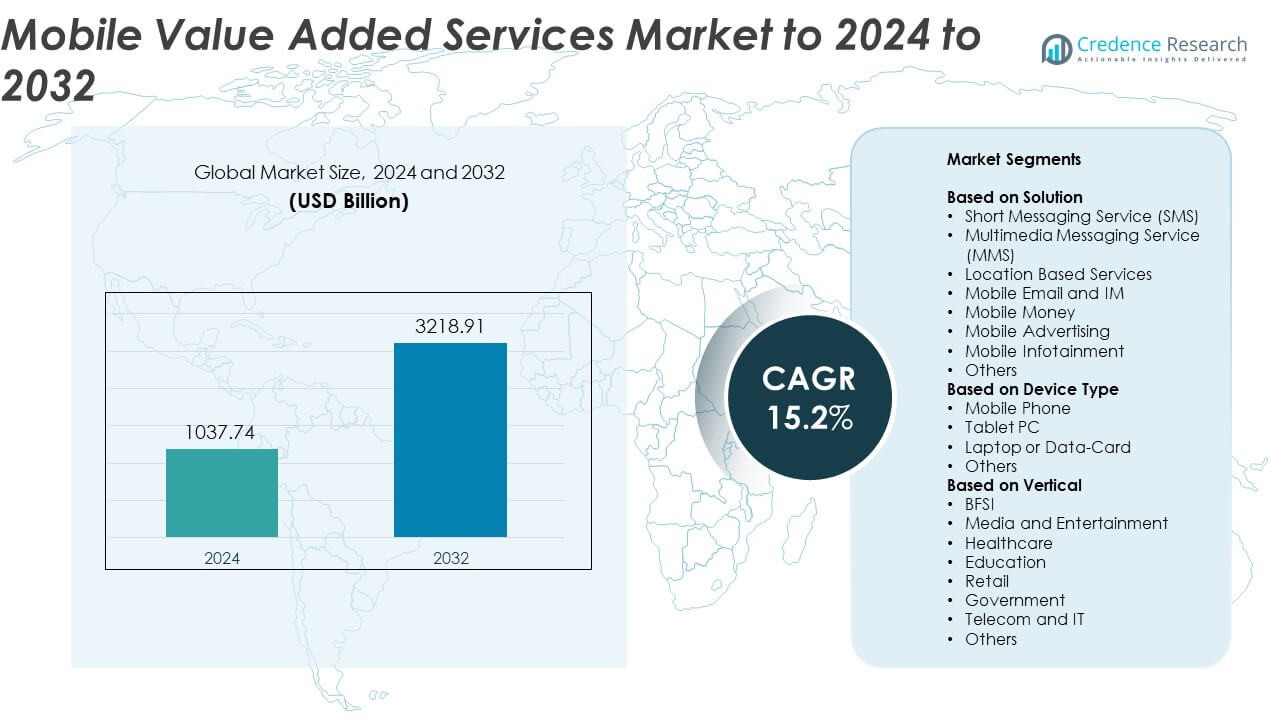
Home » Information and Communications Technology » Technology & Media » Mobile Value Added Services Market

Mobile Value Added Services Market By Vertical (Media and Entertainment, Healthcare, Education, Retail) By Solution (Short Messaging Service (SMS), Multimedia Messaging Service (MMS), Location Based Services, Mobile Email & IM)-Growth, Future Prospects & Competitive Analysis, 2016 – 2030

Price: $4999

Published: | Report ID: 20180 | Report Format : PDF

Key Highlights of the Report

The global mobile value added services market is segmented by vertical, solution, end-users, and region. The government category is the most popular vertical, while the mobile money category is the primary solution segment. In addition, the large enterprises category held the largest share in the end-users segment, with Asia Pacific leading the market growth.

One of the main factors influencing the market’s growth is the increase in urbanization, which is also being accompanied by a notable rise in the number of smartphone and tablet users worldwide. Additionally, the widespread use of mobile applications and the web as a result of the expanding use of 3G and 4G services is bolstering market expansion. Another significant growth-inducing aspect is the rising preference for value-based content among young people, particularly in the form of over-the-top (OTT) media services to access cutting-edge material while on the go.

Nonetheless, the Asia Pacific market for mobile value added services is predicted to grow at the greatest CAGR. The Asia-Pacific area has a large population of mobile phone users who primarily use their devices for entertainment purposes like news, mobile banking, movies, and other forms of entertainment. The market is predicted to expand quickly due to various factors, including the expansion of businesses and industry verticals employing various mobile value-added services and the region’s booming retail, e-commerce, IT, and telecommunications industries.

Design Element 2

Access crucial information at unmatched prices!

Request your free sample report today & start making informed decisions powered by Credence Research!

Download Free Sample
CTA Design Element 3

Market Overview

The global mobile value added services market has witnessed steady growth in recent years and is expected to continue growing at a CAGR of 15.20% between 2023 and 2030. The market was valued at USD 674.1 billion in 2022 and is expected to reach USD 1815.1 billion in 2030.

What Are The Main Drivers Of The Global Mobile Value Added Services Market?

One of the key factors propelling the growth of the mobile value-added services market is the rise in usage of mobile applications and mobile web. The growth of social networking applications and mobile payments supports the market size for mobile value-added services.

What Are The Major Challenges Faced By The Global Mobile Value Added Services Market?

The lack of regulations and rules for the various mobile value-added service (MVAS) market participants responsible for consumer rights, data privacy, and legal obligations may limit users and prevent them from using mobile value-added services.

What Are The Growth Opportunities In The Global Mobile Value Added Services Market?

The advent of cloud-based VAS systems, improvements to the telecommunications infrastructure, and advances in 5G technology are anticipated to fuel market growth.

Executive Summary

Overview of the Global Mobile value added services Market

The mobile value added services market is anticipated to witness healthy expansion in the upcoming years due to the collaborative efforts of key stakeholders and manufacturers to provide clients with cutting-edge services. Businesses in the mobile value-added services sector are intensifying their efforts to improve service quality to increase earning potential on the global market. Digitalization, technical innovation and advancement, increased disposable income, and rapid urbanization are some factors driving the global market for mobile value-added services.

Market Definition

The term “mobile value-added services” (MVAS) refers to various ancillary services the telecom industry provides. This comprises utility VAS, social networking, infotainment, mobile education, Interactive Voice and Video Response (IVVR), Unstructured Supplementary Service Data (USSD), Wireless Application Protocol (WAP), and short message service (SMS). The operator provides These extra services for an additional fee and are seen as a reliable source of extra income. In addition, these services help improve the customer experience, the pricing strategy, and the operator’s return on investment (ROI).

Market Insights

  • The global demand for mobile value added services was valued at USD 674.1 Billion in 2022 and is expected to reach USD 1815.1 Billion in 2030, growing at a CAGR of 15.20% between 2023 and 2030.
  • Regarding value, the government category leads the market and accounts for almost 21% of sales in 2022. The telecom and IT category is expected to increase at the fastest rate.
  • The mobile money category is expected to continue to dominate the mobile value added services market through 2022, with a massive market share of over 18% predicted.
  • The large enterprise’s category leads the market and accounted for almost 52% of sales in 2022.
  • In 2022, Asia Pacific will account for roughly one-third of the global market for mobile value added services, with the remaining 45% split between North America and Europe.
  • The increased use of mobile applications and mobile web is one of the main drivers of the growth of the market for mobile value-added services. The expansion of social networking applications and mobile payments supports the market size for mobile value-added services.
  • The Asia Pacific mobile value added services industry is predicted to expand at a faster CAGR. Most mobile phone users in the Asia-Pacific region use their devices for amusement, such as news, mobile banking, films, and other forms of entertainment.

Segmentation by Vertical

  • With almost 21% of the market share for mobile value added services, the government category remained the top rank in terms of product in 2022.
  • The global mobile value added services market is expected to experience the quickest growth throughout the projected period in the telecom and IT category.

Segmentation by Solution

  • The mobile money segment led the mobile value added services market with a market share of over 18% in 2022.
  • The short messaging service (SMS) category is anticipated to register the highest CAGR over the forecast period.

Segmentation by End-Users

  • In 2022, the large enterprises segment held a market share of more than 52% of the mobile value added services market.
  • SMB category is expected to have the greatest CAGR during the predicted period.

Segmentation by Region

  • Asia Pacific region held the largest share in the global mobile value added services market in 2022.
  • In 2022, North America will occupy more than 24% of the global mobile value added services market, with Europe accounting for just under 20% of the total.
  • The rest of the world’s demand for mobile value added services comes from places including Latin America, the Middle East, and Africa.

The development in urbanization, which is also being supported by a noticeable increase in smartphone and tablet users globally, is one of the major drivers driving the market’s expansion. Additionally, market expansion is supported by the widespread usage of mobile applications and the web brought on by the rising use of 3G and 4G services.

Asia Pacific dominated the global mobile value added services market. In developing nations like China and India, where smartphone usage is rising, MVAS sales are driven by this trend. The user base is also anticipated to grow, supporting the mobile value-added services market. This is because smartphone prices have decreased due to greater competition among manufacturers and service providers. India presently has the second-largest consumer base in the telecoms market, according to the India Brand Equity Foundation, with close to 1.2 billion registered subscribers.

The market for mobile value-added services in North America is anticipated to grow at the highest CAGR because the educational sector is increasingly using mobile devices, especially smartphones and tablets. Additionally, several regional educational establishments are actively using mobile learning technologies to provide students with easy access to learning resources. Furthermore, the region has a highly developed digital infrastructure is encouraging the growth of the market for mobile learning.

Overall, the preference for value-based content among young people is growing, especially as they use over-the-top (OTT) media platforms to access cutting-edge information while on the go.

Users’ access to and usage of mobile value-added services may be restricted by a lack of guidelines and standards for the different mobile value-added service (MVAS) market participants, who protect consumer rights, personal information privacy, and legal requirements.

Mobile Value Added Services Market

Growing Smartphone Penetration

One of the main factors propelling the expansion of the mobile value-added services industry is the quick rise in smartphone penetration. In recent years, there has been a sharp increase in the number of smartphone users worldwide. Smartphone users who had active connections made up over 60% of all active mobile connections in 2019. The growing reliance of customers on mobile devices for a variety of activities, including gaming, web surfing, e-commerce, and social media participation, should be credited with this growth. The rapid growth in disposable money on a global scale has been a major factor in the uptake of smartphones and tablets. Their need for content access drives users’ choice of mobile devices over traditional desktop computers while on the go.

Additionally, a wide selection of smartphones at affordable rates has allowed people to choose the models that best suit their needs. For instance, in the Asian market, companies like Xiaomi, OnePlus, Oppo, and Huawei provide feature-rich smartphones through various distribution channels at low rates. Due to the fierce rivalry in the smartphone market, costs have decreased, making them more affordable for customers. Therefore, the global mobile value-added services (VAS) market is anticipated to grow in the upcoming years due to this increase in smartphone usage.

Limitations In Content Monetisation

A significant obstacle impeding the expansion of the market for mobile value-added services is the difficulty in monetizing content. It’s getting more and harder for OTT content providers to make money from their material. In the past, voice calls were the main source of income for mobile service providers. However, the money made from voice calls has drastically decreased due to the rapid drop in call rates and the popularity of instant messaging services and online calling apps that provide free audio and video chatting. Mobile service providers are attempting to monetize OTT content, such as video and audio downloads, to make up for the decline in revenue from phone calls.

The change to a subscription-based business model is anticipated in the forecast period for companies like Reliance Industries and AT&T, which previously provided free OTT content through alliances with outside vendors. Customers will now have to pay for previously free information. Thus, this transition offers a significant difficulty. Mobile manufacturers will face difficulties keeping subscribers for subscription-based value-added services (VAS) unless they continually deliver top-notch content and launch cutting-edge services. As a result, the worldwide mobile VAS market is anticipated to see some growth challenges over the forecast period due to the monetization of content as a replacement for voice call income.

Rising Popularity Of Augmented Reality

The expansion of the mobile value-added services market has been significantly impacted by the rising popularity of augmented reality (AR) in location-based gaming. Augmented reality (AR), which overlays virtual content on actual settings and objects, is becoming more popular in location-based gaming. Smartphones and other mobile devices, including smart glasses, can access these games. The adaptability of AR’s platform is what accounts for its popularity in location-based games. Unlike virtual reality (VR) games that call for specialized technology and headgear, AR can be used with most mobile devices and headsets.

Since Niantic’s Pokemon Go, which debuted in July 2016, has been so popular, more game developers are now interested in making location-based augmented reality games. Google’s statement further increased the possibility for better location-based gaming in March 2018 regarding opening the Google Maps Platform. Major mobile value-added service (VAS) providers like Alphabet and Apple are likely to make sizeable investments in the expanding trend of combining augmented reality (AR) and location-based services (LBS) in gaming. The mobile games industry will be driven by this investment, fueling the total expansion of the global mobile VAS market throughout the projected period.

Competitive Landscape

Key Players

The global mobile value added services market is highly competitive, with the presence of several key players. Some of the major players in the market and their market share are as follows:

These businesses prioritize product innovation, enlarging their distribution networks, and mergers and acquisitions to stay competitive in the market.

The key players in the worldwide mobile value added services market are continually launching new products and developments to stay ahead.

In June 2021, Deutsche Telekom, Samsung, and Ericsson finished a 5G E2E network slicing experiment. The slicing trial was conducted at Deutsche Telekom’s Bonn lab using commercial Samsung S21 hardware coupled with a (VR) Virtual Reality headset.

In June 2021, Verizon Communications Inc. announced that it had acquired Senion AB, an indoor positioning technology that offers organizations location sharing, geofencing, indoor wayfinding, and analytics.

In June 2021, InMobi Pvt. Ltd. declared a collaboration with the Trade Desk. Through this agreement, marketers can deterministically assess the incremental brand impact of their in-app, mobile web, and desktop digital media campaigns.

Summary of Key Findings

  • The global market for mobile value-added services is driven by several factors, including digitalization, technological innovation and advancement, rising disposable income, and expanding urbanization.
  • Market segmented by vertical, solution, end-users, and region.
  • Mobile money category is the most popular, with the short messaging service (SMS) category as the primary mobile value added services solution.
  • The government segment is most commonly used vertical of the mobile value added services market.
  • Asia Pacific is leading market growth; the market is highly competitive with key players including Samsung Electronics Co. Ltd., Huawei Investment & Holding Co. Ltd., One97 Communications, Alphabet Inc., Vodafone Group plc, Mozat Pte Ltd, OnMobile Global Limited, Reliance Industries Ltd., Apple Inc., and Comviva Technologies.

Shape Your Report to Specific Countries or Regions & Enjoy 30% Off!

Future Outlook

  • The global market for mobile value added services is expected to increase significantly, especially in the Asia Pacific region.
  • One of the main driver fueling the market’s progress is the growth in urbanization, which is also aided by a noteworthy rise in smartphone and tablet users worldwide.
  • Lack of norms and standards for the various mobile value-added service (MVAS) market participants, who are responsible for safeguarding consumer rights, the privacy of personal information, and regulatory obligations, may limit users’ access to and usage of mobile value-added services.
  • Major companies should focus on creating novel items, expanding their market, and maintaining cheap power ratings to be competitive in the market.

Segmentation

  • By Vertical
    • Media and Entertainment
    • Healthcare
    • Education
    • Retail
    • Government
    • Telecom and IT
    • Others
  • By Solution
    • Short Messaging Service (SMS)
    • Multimedia Messaging Service (MMS)
    • Location Based Services
    • Mobile Email & IM
    • Mobile Money
    • Mobile Advertising
    • Mobile Infotainment
    • Others
  • By End-User
    • SMB
    • Large Enterprises
  • By Region
  • North America
    • US
    • Canada
    • Mexico
  • Europe
    • Germany
    • France
    • U.K.
    • Italy
    • Spain
    • Rest of Europe
  • Asia Pacific
    • China
    • Japan
    • India
    • South Korea
    • South-east Asia
    • Rest of Asia Pacific
  • Latin America
    • Brazil
    • Argentina
    • Rest of Latin America
  • Middle East & Africa
    • GCC Countries
    • South Africa
    • Rest of Middle East and Africa

1. Preface
1.1. Report Description
1.1.1. Purpose of the Report
1.1.2. Target Audience
1.1.3. USP and Key Offerings
1.2. Research Scope
1.3. Research Methodology
1.3.1. Phase I – Secondary Research
1.3.2. Phase II – Data Modelling
1.3.2.1. Company Share Analysis Model
1.3.2.2. Revenue Based Modelling
1.3.3. Phase III – Primary Research
1.3.4. Research Limitations
1.3.5. Assumptions
1.4. Market Introduction
1.5. Market Research Scope

2. Executive Summary
2.1. Market Snapshot: Global Mobile Value Added Services Market
2.2. Global Mobile Value Added Services Market, By Vertical
2.3. Global Mobile Value Added Services Market, By Solution
2.4. Global Mobile Value Added Services Market, By End-User
2.5. Global Mobile Value Added Services Market, By Region

3. Market Dynamics & Factors Analysis
3.1. Introduction
3.1.1. Global Mobile Value Added Services Market Value, 2017-2030, (US$ Bn)
3.1.2. Y-o-Y Growth Trend Analysis
3.2. Market Dynamics
3.2.1. Market Drivers
3.2.2. Market Restraints
3.2.3. Market Opportunities
3.2.4. Major Industry Challenges
3.3. Growth and Development Patterns
3.4. Investment Feasibility Analysis
3.5. Market Opportunity Analysis
3.5.1. Vertical
3.5.2. Solution
3.5.3. End-User
3.5.4. Geography

4. Premium Insights
4.1. STAR (Situation, Task, Action, Results) Analysis
4.2. Porter’s Five Forces Analysis
4.2.1. Threat of New Entrants
4.2.2. Bargaining Power of Buyers/Consumers
4.2.3. Bargaining Power of Suppliers
4.2.4. Threat of Substitute Types
4.2.5. Intensity of Competitive Rivalry
4.3. Key Market Trends
4.3.1. Demand Side Trends
4.3.2. Supply Side Trends
4.4. Value Chain Analysis
4.5. Technology Analysis
4.6. Analysis and Recommendations
4.7. Marketing Strategy Analysis
4.7.1. Direct Marketing
4.7.2. Indirect Marketing
4.7.3. Marketing Channel Development Trend

5. Market Positioning of Key Players, 2022
5.1. Company market share of key players, 2022
5.2. Competitive Benchmarking
5.3. Market Positioning of Key Vendors
5.4. Geographical Presence Analysis
5.5. Major Strategies Adopted by Key Players
5.5.1. Key Strategies Analysis
5.5.2. Mergers and Acquisitions
5.5.3. Partnerships
5.5.4. Product Launch
5.5.5. Geographical Expansion
5.5.6. Others

6. Economic Impact Analysis
6.1. Recession Impact
6.1.1. North America
6.1.2. Europe
6.1.3. Asia Pacific
6.1.4. Latin America
6.1.5. Middle East and Africa
6.2. Ukraine-Russia War Impact
6.2.1. North America
6.2.2. Europe
6.2.3. Asia Pacific
6.2.4. Latin America
6.2.5. Middle East and Africa
6.3. COVID-19 Impact Analysis
6.3.1. North America
6.3.2. Europe
6.3.3. Asia Pacific
6.3.4. Latin America
6.3.5. Middle East and Africa

7. Global Mobile Value Added Services Market, By Vertical
7.1. Global Mobile Value Added Services Market Overview, by Vertical
7.1.1. Global Mobile Value Added Services Market Revenue Share, By Vertical, 2022 Vs 2030 (in %)
7.2. Media and Entertainment
7.2.1. Global Mobile Value Added Services Market, By Region, 2017-2030 (US$ Bn)
7.3. Healthcare
7.3.1. Global Mobile Value Added Services Market, By Region, 2017-2030 (US$ Bn)
7.4. Education
7.4.1. Global Mobile Value Added Services Market, By Region, 2017-2030 (US$ Bn)
7.5. Retail
7.5.1. Global Mobile Value Added Services Market, By Region, 2017-2030 (US$ Bn)
7.6. Government
7.6.1. Global Mobile Value Added Services Market, By Region, 2017-2030 (US$ Bn)
7.7. Telecom and IT
7.7.1. Global Mobile Value Added Services Market, By Region, 2017-2030 (US$ Bn)
7.8. Others
7.8.1. Global Mobile Value Added Services Market, By Region, 2017-2030 (US$ Bn)

8. Global Mobile Value Added Services Market, By Solution
8.1. Global Mobile Value Added Services Market Overview, by Solution
8.1.1. Global Mobile Value Added Services Market, By Solution, 2022 vs 2030 (in %)
8.2. Short Messaging Service (SMS)
8.2.1. Global Mobile Value Added Services Market, By Region, 2017-2030 (US$ Bn)
8.3. Multimedia Messaging Service (MMS)
8.3.1. Global Mobile Value Added Services Market, By Region, 2017-2030 (US$ Bn)
8.4. Location Based Services
8.4.1. Global Mobile Value Added Services Market, By Region, 2017-2030 (US$ Bn)
8.5. Mobile Email & IM
8.5.1. Global Mobile Value Added Services Market, By Region, 2017-2030 (US$ Bn)
8.6. Mobile Money
8.6.1. Global Mobile Value Added Services Market, By Region, 2017-2030 (US$ Bn)
8.7. Mobile Advertising
8.7.1. Global Mobile Value Added Services Market, By Region, 2017-2030 (US$ Bn)
8.8. Mobile Infotainment
8.8.1. Global Mobile Value Added Services Market, By Region, 2017-2030 (US$ Bn)
8.9. Others
8.9.1. Global Mobile Value Added Services Market, By Region, 2017-2030 (US$ Bn)

9. Global Mobile Value Added Services Market, by End-User, 2017-2030 (US$ Bn)
9.1. Global Mobile Value Added Services Market Overview, by End-User
9.1.1. Global Mobile Value Added Services Market, By End-User, 2022 vs 2030 (in%)
9.2. SMB
9.2.1. Global Mobile Value Added Services Market, By Region, 2017-2030 (US$ Bn)
9.3. Large Enterprises
9.3.1. Global Mobile Value Added Services Market, By Region, 2017-2030 (US$ Bn)

10. Global Mobile Value Added Services Market, By Region
10.1. Global Mobile Value Added Services Market Overview, by Region
10.1.1. Global Mobile Value Added Services Market, By Region, 2022 vs 2030 (in%)
10.2. Vertical
10.2.1. Global Mobile Value Added Services Market, By Vertical, 2017-2030 (US$ Bn)
10.3. Solution
10.3.1. Global Mobile Value Added Services Market, By Solution, 2017-2030 (US$ Bn)
10.4. End-User
10.4.1. Global Mobile Value Added Services Market, By End-User, 2017-2030 (US$ Bn)

11. North America Mobile Value Added Services Market Analysis
11.1. North America Mobile Value Added Services Market, by Vertical, 2017-2030(US$ Bn)
11.1.1. Overview
11.1.2. SRC Analysis
11.2. North America Mobile Value Added Services Market, by Solution, 2017-2030(US$ Bn)
11.2.1. Overview
11.2.2. SRC Analysis
11.3. North America Mobile Value Added Services Market, by End-User, 2017-2030(US$ Bn)
11.3.1. Overview
11.3.2. SRC Analysis
11.4. North America Mobile Value Added Services Market, by Country, 2017-2030 (US$ Bn)
11.4.1. North America Mobile Value Added Services Market, by Country, 2022 Vs 2030 (in%)
11.4.2. U.S.
11.4.2.1. U.S. Mobile Value Added Services Market Estimates and Forecast, 2017-2030 (US$ Bn)
11.4.2.2. U.S. Mobile Value Added Services, By Vertical, 2017-2030 (US$ Bn)
11.4.2.3. U.S. Mobile Value Added Services, By Solution, 2017-2030 (US$ Bn)
11.4.2.4. U.S. Mobile Value Added Services, By End-User, 2017-2030 (US$ Bn)
11.4.3. Canada
11.4.3.1. Canada Mobile Value Added Services Market Estimates and Forecast, 2017-2030 (US$ Bn)
11.4.3.2. Canada Mobile Value Added Services, By Vertical, 2017-2030 (US$ Bn)
11.4.3.3. Canada Mobile Value Added Services, By Solution, 2017-2030 (US$ Bn)
11.4.3.4. Canada Mobile Value Added Services, By End-User, 2017-2030 (US$ Bn)
11.4.4. Mexico
11.4.4.1. Mexico Mobile Value Added Services Market Estimates and Forecast, 2017-2030 (US$ Bn)
11.4.4.2. Mexico Mobile Value Added Services, By Vertical, 2017-2030 (US$ Bn)
11.4.4.3. Mexico Mobile Value Added Services, By Solution, 2017-2030 (US$ Bn)
11.4.4.4. Mexico Mobile Value Added Services, By End-User, 2017-2030 (US$ Bn)

12. Europe Mobile Value Added Services Market Analysis
12.1. Europe Mobile Value Added Services Market, by Vertical, 2017-2030(US$ Bn)
12.1.1. Overview
12.1.2. SRC Analysis
12.2. Europe Mobile Value Added Services Market, by Solution, 2017-2030(US$ Bn)
12.2.1. Overview
12.2.2. SRC Analysis
12.3. Europe Mobile Value Added Services Market, by End-User, 2017-2030(US$ Bn)
12.3.1. Overview
12.3.2. SRC Analysis
12.4. Europe Mobile Value Added Services Market, by Country, 2017-2030 (US$ Bn)
12.4.1. Europe Mobile Value Added Services Market, by Country, 2022 Vs 2030 (in%)
12.4.2. Germany
12.4.2.1. Germany Mobile Value Added Services Market Estimates and Forecast, 2017-2030 (US$ Bn)
12.4.2.2. Germany Mobile Value Added Services, By Vertical, 2017-2030 (US$ Bn)
12.4.2.3. Germany Mobile Value Added Services, By Solution, 2017-2030 (US$ Bn)
12.4.2.4. Germany Mobile Value Added Services, By End-User, 2017-2030 (US$ Bn)
12.4.3. France
12.4.3.1. France Mobile Value Added Services Market Estimates and Forecast, 2017-2030 (US$ Bn)
12.4.3.2. France Mobile Value Added Services, By Vertical, 2017-2030 (US$ Bn)
12.4.3.3. France Mobile Value Added Services, By Solution, 2017-2030 (US$ Bn)
12.4.3.4. France Mobile Value Added Services, By End-User, 2017-2030 (US$ Bn)
12.4.4. UK
12.4.4.1. UK Mobile Value Added Services Market Estimates and Forecast, 2017-2030 (US$ Bn)
12.4.4.2. UK Mobile Value Added Services, By Vertical, 2017-2030 (US$ Bn)
12.4.4.3. UK Mobile Value Added Services, By Solution, 2017-2030 (US$ Bn)
12.4.4.4. UK Mobile Value Added Services, By End-User, 2017-2030 (US$ Bn)
12.4.5. Italy
12.4.5.1. Italy Mobile Value Added Services Market Estimates and Forecast, 2017-2030 (US$ Bn)
12.4.5.2. Italy Mobile Value Added Services, By Vertical, 2017-2030 (US$ Bn)
12.4.5.3. Italy Mobile Value Added Services, By Solution, 2017-2030 (US$ Bn)
12.4.5.4. Italy Mobile Value Added Services, By End-User, 2017-2030 (US$ Bn)
12.4.6. Spain
12.4.6.1. Spain Mobile Value Added Services Market Estimates and Forecast, 2017-2030 (US$ Bn)
12.4.6.2. Spain Mobile Value Added Services, By Vertical, 2017-2030 (US$ Bn)
12.4.6.3. Spain Mobile Value Added Services, By Solution, 2017-2030 (US$ Bn)
12.4.6.4. Spain Mobile Value Added Services, By End-User, 2017-2030 (US$ Bn)
12.4.7. Rest of Europe
12.4.7.1. Rest of Europe Mobile Value Added Services Market Estimates and Forecast, 2017-2030 (US$ Bn)
12.4.7.2. Rest of Europe Mobile Value Added Services, By Vertical, 2017-2030 (US$ Bn)
12.4.7.3. Rest of Europe Mobile Value Added Services, By Solution, 2017-2030 (US$ Bn)
12.4.7.4. Rest of Europe Mobile Value Added Services, By End-User, 2017-2030 (US$ Bn)

13. Asia Pacific Mobile Value Added Services Market Analysis
13.1. Asia Pacific Mobile Value Added Services Market, by Vertical, 2017-2030(US$ Bn)
13.1.1. Overview
13.1.2. SRC Analysis
13.2. Asia Pacific Mobile Value Added Services Market, by Solution, 2017-2030(US$ Bn)
13.2.1. Overview
13.2.2. SRC Analysis
13.3. Asia Pacific Mobile Value Added Services Market, by End-User, 2017-2030(US$ Bn)
13.3.1. Overview
13.3.2. SRC Analysis
13.4. Asia Pacific Mobile Value Added Services Market, by Country, 2017-2030 (US$ Bn)
13.4.1. Asia Pacific Mobile Value Added Services Market, by Country, 2022 Vs 2030 (in%)
13.4.2. China
13.4.2.1. China Mobile Value Added Services Market Estimates and Forecast, 2017-2030 (US$ Bn)
13.4.2.2. China Mobile Value Added Services, By Vertical, 2017-2030 (US$ Bn)
13.4.2.3. China Mobile Value Added Services, By Solution, 2017-2030 (US$ Bn)
13.4.2.4. China Mobile Value Added Services, By End-User, 2017-2030 (US$ Bn)
13.4.3. Japan
13.4.3.1. Japan Mobile Value Added Services Market Estimates and Forecast, 2017-2030 (US$ Bn)
13.4.3.2. Japan Mobile Value Added Services, By Vertical, 2017-2030 (US$ Bn)
13.4.3.3. Japan Mobile Value Added Services, By Solution, 2017-2030 (US$ Bn)
13.4.3.4. Japan Mobile Value Added Services, By End-User, 2017-2030 (US$ Bn)
13.4.4. India
13.4.4.1. India Mobile Value Added Services Market Estimates and Forecast, 2017-2030 (US$ Bn)
13.4.4.2. India Mobile Value Added Services, By Vertical, 2017-2030 (US$ Bn)
13.4.4.3. India Mobile Value Added Services, By Solution, 2017-2030 (US$ Bn)
13.4.4.4. India Mobile Value Added Services, By End-User, 2017-2030 (US$ Bn)
13.4.5. South Korea
13.4.5.1. South Korea Mobile Value Added Services Market Estimates and Forecast, 2017-2030 (US$ Bn)
13.4.5.2. South Korea Mobile Value Added Services, By Vertical, 2017-2030 (US$ Bn)
13.4.5.3. South Korea Mobile Value Added Services, By Solution, 2017-2030 (US$ Bn)
13.4.5.4. South Korea Mobile Value Added Services, By End-User, 2017-2030 (US$ Bn)
13.4.6. South-East Asia
13.4.6.1. South-East Asia Mobile Value Added Services Market Estimates and Forecast, 2017-2030 (US$ Bn)
13.4.6.2. South-East Asia Mobile Value Added Services, By Vertical, 2017-2030 (US$ Bn)
13.4.6.3. South-East Asia Mobile Value Added Services, By Solution, 2017-2030 (US$ Bn)
13.4.6.4. South-East Asia Mobile Value Added Services, By End-User, 2017-2030 (US$ Bn)
13.4.7. Rest of Asia Pacific
13.4.7.1. Rest of Asia Pacific Mobile Value Added Services Market Estimates and Forecast, 2017-2030 (US$ Bn)
13.4.7.2. Rest of Asia Pacific Mobile Value Added Services, By Vertical, 2017-2030 (US$ Bn)
13.4.7.3. Rest of Asia Pacific Mobile Value Added Services, By Solution, 2017-2030 (US$ Bn)
13.4.7.4. Rest of Asia Pacific Mobile Value Added Services, By End-User, 2017-2030 (US$ Bn)

14. Latin America Mobile Value Added Services Market Analysis
14.1. Latin America Mobile Value Added Services Market, by Vertical, 2017-2030(US$ Bn)
14.1.1. Overview
14.1.2. SRC Analysis
14.2. Latin America Mobile Value Added Services Market, by Solution, 2017-2030(US$ Bn)
14.2.1. Overview
14.2.2. SRC Analysis
14.3. Latin America Mobile Value Added Services Market, by End-User, 2017-2030(US$ Bn)
14.3.1. Overview
14.3.2. SRC Analysis
14.4. Latin America Mobile Value Added Services Market, by Country, 2017-2030 (US$ Bn)
14.4.1. Latin America Mobile Value Added Services Market, by Country, 2022 Vs 2030 (in%)
14.4.2. Brazil
14.4.2.1. Brazil Mobile Value Added Services Market Estimates and Forecast, 2017-2030 (US$ Bn)
14.4.2.2. Brazil Mobile Value Added Services, By Vertical, 2017-2030 (US$ Bn)
14.4.2.3. Brazil Mobile Value Added Services, By Solution, 2017-2030 (US$ Bn)
14.4.2.4. Brazil Mobile Value Added Services, By End-User, 2017-2030 (US$ Bn)
14.4.3. Argentina
14.4.3.1. Argentina Mobile Value Added Services Market Estimates and Forecast, 2017-2030 (US$ Bn)
14.4.3.2. Argentina Mobile Value Added Services, By Vertical, 2017-2030 (US$ Bn)
14.4.3.3. Argentina Mobile Value Added Services, By Solution, 2017-2030 (US$ Bn)
14.4.3.4. Argentina Mobile Value Added Services, By End-User, 2017-2030 (US$ Bn)
14.4.4. Rest of Latin America
14.4.4.1. Rest of Latin America Mobile Value Added Services Market Estimates and Forecast, 2017-2030 (US$ Bn)
14.4.4.2. Rest of Latin America Mobile Value Added Services, By Vertical, 2017-2030 (US$ Bn)
14.4.4.3. Rest of Latin America Mobile Value Added Services, By Solution, 2017-2030 (US$ Bn)
14.4.4.4. Rest of Latin America Mobile Value Added Services, By End-User, 2017-2030 (US$ Bn)

15. Middle East and Africa Mobile Value Added Services Market Analysis
15.1. Middle East and Africa Mobile Value Added Services Market, by Vertical, 2017-2030(US$ Bn)
15.1.1. Overview
15.1.2. SRC Analysis
15.2. Middle East and Africa Mobile Value Added Services Market, by Solution, 2017-2030(US$ Bn)
15.2.1. Overview
15.2.2. SRC Analysis
15.3. Middle East and Africa Mobile Value Added Services Market, by End-User, 2017-2030(US$ Bn)
15.3.1. Overview
15.3.2. SRC Analysis
15.4. Middle East and Africa Mobile Value Added Services Market, by Country, 2017-2030 (US$ Bn)
15.4.1. Middle East and Africa Mobile Value Added Services Market, by Country, 2022 Vs 2030 (in%)
15.4.2. GCC Countries
15.4.2.1. GCC Countries Mobile Value Added Services Market Estimates and Forecast, 2017-2030 (US$ Bn)
15.4.2.2. GCC Countries Mobile Value Added Services, By Vertical, 2017-2030 (US$ Bn)
15.4.2.3. GCC Countries Mobile Value Added Services, By Solution, 2017-2030 (US$ Bn)
15.4.2.4. GCC Countries Mobile Value Added Services, By End-User, 2017-2030 (US$ Bn)
15.4.3. South Africa
15.4.3.1. South Africa Mobile Value Added Services Market Estimates and Forecast, 2017-2030 (US$ Bn)
15.4.3.2. South Africa Mobile Value Added Services, By Vertical, 2017-2030 (US$ Bn)
15.4.3.3. South Africa Mobile Value Added Services, By Solution, 2017-2030 (US$ Bn)
15.4.3.4. South Africa Mobile Value Added Services, By End-User, 2017-2030 (US$ Bn)
15.4.4. Rest of Middle East and Africa
15.4.4.1. Rest of Middle East and Africa Mobile Value Added Services Market Estimates and Forecast, 2017-2030 (US$ Bn)
15.4.4.2. Rest of Middle East and Africa Mobile Value Added Services, By Vertical, 2017-2030 (US$ Bn)
15.4.4.3. Rest of Middle East and Africa Mobile Value Added Services, By Solution, 2017-2030 (US$ Bn)
15.4.4.4. Rest of Middle East and Africa Mobile Value Added Services, By End-User, 2017-2030 (US$ Bn)

16. Company Profiles
16.1. Samsung Electronics Co. Ltd.
16.1.1. Company Overview
16.1.2. Products/Services Portfolio
16.1.3. Geographical Presence
16.1.4. Financial Summary
16.1.4.1. Market Revenue and Net Profit (2019-2022)
16.1.4.2. Business Segment Revenue Analysis
16.1.4.3. Geographical Revenue Analysis
16.2. Huawei Investment & Holding Co. Ltd.
16.3. One97 Communications
16.4. Alphabet Inc.
16.5. Vodafone Group plc
16.6. Mozat Pte Ltd
16.7. OnMobile Global Limited
16.8. Reliance Industries Ltd.
16.9. Apple Inc.
16.10. Comviva Technologies

List of Figures
FIG. 1 Global Mobile Value Added Services Market: Research Methodology
FIG. 2 Market Size Estimation – Top Down & Bottom up Approach
FIG. 3 Global Mobile Value Added Services Market Segmentation
FIG. 4 Global Mobile Value Added Services Market, by Vertical, 2022 (US$ Bn)
FIG. 5 Global Mobile Value Added Services Market, by Solution, 2022 (US$ Bn)
FIG. 6 Global Mobile Value Added Services Market, by End-User, 2022 (US$ Bn)
FIG. 7 Global Mobile Value Added Services Market, by Geography, 2022 (US$ Bn)
FIG. 8 Attractive Investment Proposition, by Vertical, 2022
FIG. 9 Attractive Investment Proposition, by Solution, 2022
FIG. 10 Attractive Investment Proposition, by End-User, 2022
FIG. 11 Attractive Investment Proposition, by Geography, 2022
FIG. 12 Global Market Share Analysis of Key Mobile Value Added Services Market Manufacturers, 2022
FIG. 13 Global Market Positioning of Key Mobile Value Added Services Market Manufacturers, 2022
FIG. 14 Global Mobile Value Added Services Market Value Contribution, By Vertical, 2022 & 2030 (Value %)
FIG. 15 Global Mobile Value Added Services Market, by Media and Entertainment, Value, 2017-2030 (US$ Bn)
FIG. 16 Global Mobile Value Added Services Market, by Healthcare, Value, 2017-2030 (US$ Bn)
FIG. 17 Global Mobile Value Added Services Market, by Education, Value, 2017-2030 (US$ Bn)
FIG. 18 Global Mobile Value Added Services Market, by Retail, Value, 2017-2030 (US$ Bn)
FIG. 19 Global Mobile Value Added Services Market, by Government, Value, 2017-2030 (US$ Bn)
FIG. 20 Global Mobile Value Added Services Market, by Telecom and IT, Value, 2017-2030 (US$ Bn)
FIG. 21 Global Mobile Value Added Services Market, by Others, Value, 2017-2030 (US$ Bn)
FIG. 22 Global Mobile Value Added Services Market Value Contribution, By Solution, 2022 & 2030 (Value %)
FIG. 23 Global Mobile Value Added Services Market, by Short Messaging Service (SMS), Value, 2017-2030 (US$ Bn)
FIG. 24 Global Mobile Value Added Services Market, by Multimedia Messaging Service (MMS), 2017-2030 (US$ Bn)
FIG. 25 Global Mobile Value Added Services Market, by Location Based Services, 2017-2030 (US$ Bn)
FIG. 26 Global Mobile Value Added Services Market, by Mobile Email & IM, 2017-2030 (US$ Bn)
FIG. 27 Global Mobile Value Added Services Market, by Mobile Money, 2017-2030 (US$ Bn)
FIG. 28 Global Mobile Value Added Services Market, by Mobile Advertising, 2017-2030 (US$ Bn)
FIG. 29 Global Mobile Value Added Services Market, by Mobile Infotainment, 2017-2030 (US$ Bn)
FIG. 30 Global Mobile Value Added Services Market, by Others, 2017-2030 (US$ Bn)
FIG. 31 Global Mobile Value Added Services Market Value Contribution, By End-User, 2022 & 2030 (Value %)
FIG. 32 Global Mobile Value Added Services Market, by SMB, Value, 2017-2030 (US$ Bn)
FIG. 33 Global Mobile Value Added Services Market, by Large Enterprises, 2017-2030 (US$ Bn)
FIG. 34 North America Mobile Value Added Services Market, 2017-2030 (US$ Bn)
FIG. 35 U.S. Mobile Value Added Services Market, 2017-2030 (US$ Bn)
FIG. 36 Canada Mobile Value Added Services Market, 2017-2030 (US$ Bn)
FIG. 37 Europe Mobile Value Added Services Market, 2017-2030 (US$ Bn)
FIG. 38 Germany Mobile Value Added Services Market, 2017-2030 (US$ Bn)
FIG. 39 France Mobile Value Added Services Market, 2017-2030 (US$ Bn)
FIG. 40 U.K. Mobile Value Added Services Market, 2017-2030 (US$ Bn)
FIG. 41 Italy Mobile Value Added Services Market, 2017-2030 (US$ Bn)
FIG. 42 Spain Mobile Value Added Services Market, 2017-2030 (US$ Bn)
FIG. 43 Rest of Europe Mobile Value Added Services Market, 2017-2030 (US$ Bn)
FIG. 44 Asia Pacific Mobile Value Added Services Market, 2017-2030 (US$ Bn)
FIG. 45 China Mobile Value Added Services Market, 2017-2030 (US$ Bn)
FIG. 46 Japan Mobile Value Added Services Market, 2017-2030 (US$ Bn)
FIG. 47 India Mobile Value Added Services Market, 2017-2030 (US$ Bn)
FIG. 48 South Korea Mobile Value Added Services Market, 2017-2030 (US$ Bn)
FIG. 49 South-East Asia Mobile Value Added Services Market, 2017-2030 (US$ Bn)
FIG. 50 Rest of Asia Pacific Mobile Value Added Services Market, 2017-2030 (US$ Bn)
FIG. 51 Latin America Mobile Value Added Services Market, 2017-2030 (US$ Bn)
FIG. 52 Brazil Mobile Value Added Services Market, 2017-2030 (US$ Bn)
FIG. 53 Mexico Mobile Value Added Services Market, 2017-2030 (US$ Bn)
FIG. 54 Rest of Latin America Mobile Value Added Services Market, 2017-2030 (US$ Bn)
FIG. 55 Middle East & Africa Mobile Value Added Services Market, 2017-2030 (US$ Bn)
FIG. 56 GCC Countries Mobile Value Added Services Market, 2017-2030 (US$ Bn)
FIG. 57 South Africa Mobile Value Added Services Market, 2017-2030 (US$ Bn)
FIG. 58 Rest of Middle East and Africa Mobile Value Added Services Market, 2017-2030 (US$ Bn)

List of Tables
TABLE 1 Market Snapshot: Global Mobile Value Added Services Market
TABLE 2 Global Mobile Value Added Services Market: Market Drivers Impact Analysis
TABLE 3 Global Mobile Value Added Services Market: Market Restraints Impact Analysis
TABLE 4 Global Mobile Value Added Services Market, by Competitive Benchmarking, 2022
TABLE 5 Global Mobile Value Added Services Market, by Geographical Presence Analysis, 2022
TABLE 6 Global Mobile Value Added Services Market, by Key Strategies Analysis, 2022
TABLE 7 Global Mobile Value Added Services Market, by Media and Entertainment, By Region, 2017-2022 (US$ Bn)
TABLE 8 Global Mobile Value Added Services Market, by Media and Entertainment, By Region, 2023-2030 (US$ Bn)
TABLE 9 Global Mobile Value Added Services Market, by Healthcare, By Region, 2017-2022 (US$ Bn)
TABLE 10 Global Mobile Value Added Services Market, by Healthcare, By Region, 2023-2030 (US$ Bn)
TABLE 11 Global Mobile Value Added Services Market, by Education, By Region, 2017-2022 (US$ Bn)
TABLE 12 Global Mobile Value Added Services Market, by Education, By Region, 2023-2030 (US$ Bn)
TABLE 13 Global Mobile Value Added Services Market, by Retail, By Region, 2017-2022 (US$ Bn)
TABLE 14 Global Mobile Value Added Services Market, by Retail, By Region, 2023-2030 (US$ Bn)
TABLE 15 Global Mobile Value Added Services Market, by Government, By Region, 2017-2022 (US$ Bn)
TABLE 16 Global Mobile Value Added Services Market, by Government, By Region, 2023-2030 (US$ Bn)
TABLE 17 Global Mobile Value Added Services Market, by Telecom and IT, By Region, 2017-2022 (US$ Bn)
TABLE 18 Global Mobile Value Added Services Market, by Telecom and IT, By Region, 2023-2030 (US$ Bn)
TABLE 19 Global Mobile Value Added Services Market, by Others, By Region, 2017-2022 (US$ Bn)
TABLE 20 Global Mobile Value Added Services Market, by Others, By Region, 2023-2030 (US$ Bn)
TABLE 21 Global Mobile Value Added Services Market, by Short Messaging Service (SMS), By Region, 2017-2022 (US$ Bn)
TABLE 22 Global Mobile Value Added Services Market, by Short Messaging Service (SMS), By Region, 2023-2030 (US$ Bn)
TABLE 23 Global Mobile Value Added Services Market, by Multimedia Messaging Service (MMS), By Region, 2017-2022 (US$ Bn)
TABLE 24 Global Mobile Value Added Services Market, by Multimedia Messaging Service (MMS), By Region, 2023-2030 (US$ Bn)
TABLE 25 Global Mobile Value Added Services Market, by Location Based Services, By Region, 2017-2022 (US$ Bn)
TABLE 26 Global Mobile Value Added Services Market, by Location Based Services, By Region, 2023-2030 (US$ Bn)
TABLE 27 Global Mobile Value Added Services Market, by Mobile Email & IM, By Region, 2017-2022 (US$ Bn)
TABLE 28 Global Mobile Value Added Services Market, by Mobile Email & IM, By Region, 2023-2030 (US$ Bn)
TABLE 29 Global Mobile Value Added Services Market, by Mobile Money, By Region, 2017-2022 (US$ Bn)
TABLE 30 Global Mobile Value Added Services Market, by Mobile Money, By Region, 2023-2030 (US$ Bn)
TABLE 31 Global Mobile Value Added Services Market, by Mobile Advertising, By Region, 2017-2022 (US$ Bn)
TABLE 32 Global Mobile Value Added Services Market, by Mobile Advertising, By Region, 2023-2030 (US$ Bn)
TABLE 33 Global Mobile Value Added Services Market, by Mobile Infotainment, By Region, 2017-2022 (US$ Bn)
TABLE 34 Global Mobile Value Added Services Market, by Mobile Infotainment, By Region, 2023-2030 (US$ Bn)
TABLE 35 Global Mobile Value Added Services Market, by Others, By Region, 2017-2022 (US$ Bn)
TABLE 36 Global Mobile Value Added Services Market, by Others, By Region, 2023-2030 (US$ Bn)
TABLE 37 Global Mobile Value Added Services Market, by SMB, By Region, 2017-2022 (US$ Bn)
TABLE 38 Global Mobile Value Added Services Market, by SMB, By Region, 2023-2030 (US$ Bn)
TABLE 39 Global Mobile Value Added Services Market, by Large Enterprises, By Region, 2017-2022 (US$ Bn)
TABLE 40 Global Mobile Value Added Services Market, by Large Enterprises, By Region, 2023-2030 (US$ Bn)
TABLE 41 Global Mobile Value Added Services Market, by Vertical, 2017-2022 (US$ Bn)
TABLE 42 Global Mobile Value Added Services Market, by Vertical, 2023-2030 (US$ Bn)
TABLE 43 Global Mobile Value Added Services Market, by Solution, 2017-2022 (US$ Bn)
TABLE 44 Global Mobile Value Added Services Market, by Solution, 2023-2030 (US$ Bn)
TABLE 45 Global Mobile Value Added Services Market, by End-User, 2017-2022 (US$ Bn)
TABLE 46 Global Mobile Value Added Services Market, by End-User, 2023-2030 (US$ Bn)
TABLE 47 Global Mobile Value Added Services Market, by Region, 2017-2022 (US$ Bn)
TABLE 48 Global Mobile Value Added Services Market, by Region, 2023-2030 (US$ Bn)
TABLE 49 North America Mobile Value Added Services Market, by Vertical, 2017-2022 (US$ Bn)
TABLE 50 North America Mobile Value Added Services Market, by Vertical, 2023-2030 (US$ Bn)
TABLE 51 North America Mobile Value Added Services Market, by Solution, 2017-2022 (US$ Bn)
TABLE 52 North America Mobile Value Added Services Market, by Solution, 2023-2030 (US$ Bn)
TABLE 53 North America Mobile Value Added Services Market, by End-User, 2017-2022 (US$ Bn)
TABLE 54 North America Mobile Value Added Services Market, by End-User, 2023-2030 (US$ Bn)
TABLE 55 North America Mobile Value Added Services Market, by Country, 2017-2022 (US$ Bn)
TABLE 56 North America Mobile Value Added Services Market, by Country, 2023-2030 (US$ Bn)
TABLE 57 United States Mobile Value Added Services Market, by Vertical, 2017-2022 (US$ Bn)
TABLE 58 United States Mobile Value Added Services Market, by Vertical, 2023-2030 (US$ Bn)
TABLE 59 United States Mobile Value Added Services Market, by Solution, 2017-2022 (US$ Bn)
TABLE 60 United States Mobile Value Added Services Market, by Solution, 2023-2030 (US$ Bn)
TABLE 61 United States Mobile Value Added Services Market, by End-User, 2017-2022 (US$ Bn)
TABLE 62 United States Mobile Value Added Services Market, by End-User, 2023-2030 (US$ Bn)
TABLE 63 Canada Mobile Value Added Services Market, by Vertical, 2017-2022 (US$ Bn)
TABLE 64 Canada Mobile Value Added Services Market, by Vertical, 2023-2030 (US$ Bn)
TABLE 65 Canada Mobile Value Added Services Market, by Solution, 2017-2022 (US$ Bn)
TABLE 66 Canada Mobile Value Added Services Market, by Solution, 2023-2030 (US$ Bn)
TABLE 67 Canada Mobile Value Added Services Market, by End-User, 2017-2022 (US$ Bn)
TABLE 68 Canada Mobile Value Added Services Market, by End-User, 2023-2030 (US$ Bn)
TABLE 69 Mexico Mobile Value Added Services Market, by Vertical, 2017-2022 (US$ Bn)
TABLE 70 Mexico Mobile Value Added Services Market, by Vertical, 2023-2030 (US$ Bn)
TABLE 71 Mexico Mobile Value Added Services Market, by Solution, 2017-2022 (US$ Bn)
TABLE 72 Mexico Mobile Value Added Services Market, by Solution, 2023-2030 (US$ Bn)
TABLE 73 Mexico Mobile Value Added Services Market, by End-User, 2017-2022 (US$ Bn)
TABLE 74 Mexico Mobile Value Added Services Market, by End-User, 2023-2030 (US$ Bn)
TABLE 75 Europe Mobile Value Added Services Market, by Vertical, 2017-2022 (US$ Bn)
TABLE 76 Europe Mobile Value Added Services Market, by Vertical, 2023-2030 (US$ Bn)
TABLE 77 Europe Mobile Value Added Services Market, by Solution, 2017-2022 (US$ Bn)
TABLE 78 Europe Mobile Value Added Services Market, by Solution, 2023-2030 (US$ Bn)
TABLE 79 Europe Mobile Value Added Services Market, by End-User, 2017-2022 (US$ Bn)
TABLE 80 Europe Mobile Value Added Services Market, by End-User, 2023-2030 (US$ Bn)
TABLE 81 Europe Mobile Value Added Services Market, by Country, 2017-2022 (US$ Bn)
TABLE 82 Europe Mobile Value Added Services Market, by Country, 2023-2030 (US$ Bn)
TABLE 83 Germany Mobile Value Added Services Market, by Vertical, 2017-2022 (US$ Bn)
TABLE 84 Germany Mobile Value Added Services Market, by Vertical, 2023-2030 (US$ Bn)
TABLE 85 Germany Mobile Value Added Services Market, by Solution, 2017-2022 (US$ Bn)
TABLE 86 Germany Mobile Value Added Services Market, by Solution, 2023-2030 (US$ Bn)
TABLE 87 Germany Mobile Value Added Services Market, by End-User, 2017-2022 (US$ Bn)
TABLE 88 Germany Mobile Value Added Services Market, by End-User, 2023-2030 (US$ Bn)
TABLE 89 France Mobile Value Added Services Market, by Vertical, 2017-2022 (US$ Bn)
TABLE 90 France Mobile Value Added Services Market, by Vertical, 2023-2030 (US$ Bn)
TABLE 91 France Mobile Value Added Services Market, by Solution, 2017-2022 (US$ Bn)
TABLE 92 France Mobile Value Added Services Market, by Solution, 2023-2030 (US$ Bn)
TABLE 93 France Mobile Value Added Services Market, by End-User, 2017-2022 (US$ Bn)
TABLE 94 France Mobile Value Added Services Market, by End-User, 2023-2030 (US$ Bn)
TABLE 95 United Kingdom Mobile Value Added Services Market, by Vertical, 2017-2022 (US$ Bn)
TABLE 96 United Kingdom Mobile Value Added Services Market, by Vertical, 2023-2030 (US$ Bn)
TABLE 97 United Kingdom Mobile Value Added Services Market, by Solution, 2017-2022 (US$ Bn)
TABLE 98 United Kingdom Mobile Value Added Services Market, by Solution, 2023-2030 (US$ Bn)
TABLE 99 United Kingdom Mobile Value Added Services Market, by End-User, 2017-2022 (US$ Bn)
TABLE 100 United Kingdom Mobile Value Added Services Market, by End-User, 2023-2030 (US$ Bn)
TABLE 101 Italy Mobile Value Added Services Market, by Vertical, 2017-2022 (US$ Bn)
TABLE 102 Italy Mobile Value Added Services Market, by Vertical, 2023-2030 (US$ Bn)
TABLE 103 Italy Mobile Value Added Services Market, by Solution, 2017-2022 (US$ Bn)
TABLE 104 Italy Mobile Value Added Services Market, by Solution, 2023-2030 (US$ Bn)
TABLE 105 Italy Mobile Value Added Services Market, by End-User, 2017-2022 (US$ Bn)
TABLE 106 Italy Mobile Value Added Services Market, by End-User, 2023-2030 (US$ Bn)
TABLE 107 Spain Mobile Value Added Services Market, by Vertical, 2017-2022 (US$ Bn)
TABLE 108 Spain Mobile Value Added Services Market, by Vertical, 2023-2030 (US$ Bn)
TABLE 109 Spain Mobile Value Added Services Market, by Solution, 2017-2022 (US$ Bn)
TABLE 110 Spain Mobile Value Added Services Market, by Solution, 2023-2030 (US$ Bn)
TABLE 111 Spain Mobile Value Added Services Market, by End-User, 2017-2022 (US$ Bn)
TABLE 112 Spain Mobile Value Added Services Market, by End-User, 2023-2030 (US$ Bn)
TABLE 113 Rest of Europe Mobile Value Added Services Market, by Vertical, 2017-2022 (US$ Bn)
TABLE 114 Rest of Europe Mobile Value Added Services Market, by Vertical, 2023-2030 (US$ Bn)
TABLE 115 Rest of Europe Mobile Value Added Services Market, by Solution, 2017-2022 (US$ Bn)
TABLE 116 Rest of Europe Mobile Value Added Services Market, by Solution, 2023-2030 (US$ Bn)
TABLE 117 Rest of Europe Mobile Value Added Services Market, by End-User, 2017-2022 (US$ Bn)
TABLE 118 Rest of Europe Mobile Value Added Services Market, by End-User, 2023-2030 (US$ Bn)
TABLE 119 Asia Pacific Mobile Value Added Services Market, by Vertical, 2017-2022 (US$ Bn)
TABLE 120 Asia Pacific Mobile Value Added Services Market, by Vertical, 2023-2030 (US$ Bn)
TABLE 121 Asia Pacific Mobile Value Added Services Market, by Solution, 2017-2022 (US$ Bn)
TABLE 122 Asia Pacific Mobile Value Added Services Market, by Solution, 2023-2030 (US$ Bn)
TABLE 123 Asia Pacific Mobile Value Added Services Market, by End-User, 2017-2022 (US$ Bn)
TABLE 124 Asia Pacific Mobile Value Added Services Market, by End-User, 2023-2030 (US$ Bn)
TABLE 125 China Mobile Value Added Services Market, by Vertical, 2017-2022 (US$ Bn)
TABLE 126 China Mobile Value Added Services Market, by Vertical, 2023-2030 (US$ Bn)
TABLE 127 China Mobile Value Added Services Market, by Solution, 2017-2022 (US$ Bn)
TABLE 128 China Mobile Value Added Services Market, by Solution, 2023-2030 (US$ Bn)
TABLE 129 China Mobile Value Added Services Market, by End-User, 2017-2022 (US$ Bn)
TABLE 130 China Mobile Value Added Services Market, by End-User, 2023-2030 (US$ Bn)
TABLE 131 Japan Mobile Value Added Services Market, by Vertical, 2017-2022 (US$ Bn)
TABLE 132 Japan Mobile Value Added Services Market, by Vertical, 2023-2030 (US$ Bn)
TABLE 133 Japan Mobile Value Added Services Market, by Solution, 2017-2022 (US$ Bn)
TABLE 134 Japan Mobile Value Added Services Market, by Solution, 2023-2030 (US$ Bn)
TABLE 135 Japan Mobile Value Added Services Market, by End-User, 2017-2022 (US$ Bn)
TABLE 136 Japan Mobile Value Added Services Market, by End-User, 2023-2030 (US$ Bn)
TABLE 137 India Mobile Value Added Services Market, by Vertical, 2017-2022 (US$ Bn)
TABLE 138 India Mobile Value Added Services Market, by Vertical, 2023-2030 (US$ Bn)
TABLE 139 India Mobile Value Added Services Market, by Solution, 2017-2022 (US$ Bn)
TABLE 140 India Mobile Value Added Services Market, by Solution, 2023-2030 (US$ Bn)
TABLE 141 India Mobile Value Added Services Market, by End-User, 2017-2022 (US$ Bn)
TABLE 142 India Mobile Value Added Services Market, by End-User, 2023-2030 (US$ Bn)
TABLE 143 South Korea Mobile Value Added Services Market, by Vertical, 2017-2022 (US$ Bn)
TABLE 144 South Korea Mobile Value Added Services Market, by Vertical, 2023-2030 (US$ Bn)
TABLE 145 South Korea Mobile Value Added Services Market, by Solution, 2017-2022 (US$ Bn)
TABLE 146 South Korea Mobile Value Added Services Market, by Solution, 2023-2030 (US$ Bn)
TABLE 147 South Korea Mobile Value Added Services Market, by End-User, 2017-2022 (US$ Bn)
TABLE 148 South Korea Mobile Value Added Services Market, by End-User, 2023-2030 (US$ Bn)
TABLE 149 South-East Asia Mobile Value Added Services Market, by Vertical, 2017-2022 (US$ Bn)
TABLE 150 South-East Asia Mobile Value Added Services Market, by Vertical, 2023-2030 (US$ Bn)
TABLE 151 South-East Asia Mobile Value Added Services Market, by Solution, 2017-2022 (US$ Bn)
TABLE 152 South-East Asia Mobile Value Added Services Market, by Solution, 2023-2030 (US$ Bn)
TABLE 153 South-East Asia Mobile Value Added Services Market, by End-User, 2017-2022 (US$ Bn)
TABLE 154 South-East Asia Mobile Value Added Services Market, by End-User, 2023-2030 (US$ Bn)
TABLE 155 Rest of Asia Pacific Mobile Value Added Services Market, by Vertical, 2017-2022 (US$ Bn)
TABLE 156 Rest of Asia Pacific Mobile Value Added Services Market, by Vertical, 2023-2030 (US$ Bn)
TABLE 157 Rest of Asia Pacific Mobile Value Added Services Market, by Solution, 2017-2022 (US$ Bn)
TABLE 158 Rest of Asia Pacific Mobile Value Added Services Market, by Solution, 2023-2030 (US$ Bn)
TABLE 159 Rest of Asia Pacific Mobile Value Added Services Market, by End-User, 2017-2022 (US$ Bn)
TABLE 160 Rest of Asia Pacific Mobile Value Added Services Market, by End-User, 2023-2030 (US$ Bn)
TABLE 161 Latin America Mobile Value Added Services Market, by Vertical, 2017-2022 (US$ Bn)
TABLE 162 Latin America Mobile Value Added Services Market, by Vertical, 2023-2030 (US$ Bn)
TABLE 163 Latin America Mobile Value Added Services Market, by Solution, 2017-2022 (US$ Bn)
TABLE 164 Latin America Mobile Value Added Services Market, by Solution, 2023-2030 (US$ Bn)
TABLE 165 Latin America Mobile Value Added Services Market, by End-User, 2017-2022 (US$ Bn)
TABLE 166 Latin America Mobile Value Added Services Market, by End-User, 2023-2030 (US$ Bn)
TABLE 167 Brazil Mobile Value Added Services Market, by Vertical, 2017-2022 (US$ Bn)
TABLE 168 Brazil Mobile Value Added Services Market, by Vertical, 2023-2030 (US$ Bn)
TABLE 169 Brazil Mobile Value Added Services Market, by Solution, 2017-2022 (US$ Bn)
TABLE 170 Brazil Mobile Value Added Services Market, by Solution, 2023-2030 (US$ Bn)
TABLE 171 Brazil Mobile Value Added Services Market, by End-User, 2017-2022 (US$ Bn)
TABLE 172 Brazil Mobile Value Added Services Market, by End-User, 2023-2030 (US$ Bn)
TABLE 173 Argentina Mobile Value Added Services Market, by Vertical, 2017-2022 (US$ Bn)
TABLE 174 Argentina Mobile Value Added Services Market, by Vertical, 2023-2030 (US$ Bn)
TABLE 175 Argentina Mobile Value Added Services Market, by Solution, 2017-2022 (US$ Bn)
TABLE 176 Argentina Mobile Value Added Services Market, by Solution, 2023-2030 (US$ Bn)
TABLE 177 Argentina Mobile Value Added Services Market, by End-User, 2017-2022 (US$ Bn)
TABLE 178 Argentina Mobile Value Added Services Market, by End-User, 2023-2030 (US$ Bn)
TABLE 179 Rest of Latin America Mobile Value Added Services Market, by Vertical, 2017-2022 (US$ Bn)
TABLE 180 Rest of Latin America Mobile Value Added Services Market, by Vertical, 2023-2030 (US$ Bn)
TABLE 181 Rest of Latin America Mobile Value Added Services Market, by Solution, 2017-2022 (US$ Bn)
TABLE 182 Rest of Latin America Mobile Value Added Services Market, by Solution, 2023-2030 (US$ Bn)
TABLE 183 Rest of Latin America Mobile Value Added Services Market, by End-User, 2017-2022 (US$ Bn)
TABLE 184 Rest of Latin America Mobile Value Added Services Market, by End-User, 2023-2030 (US$ Bn)
TABLE 185 Middle East and Africa Mobile Value Added Services Market, by Vertical, 2017-2022 (US$ Bn)
TABLE 186 Middle East and Africa Mobile Value Added Services Market, by Vertical, 2023-2030 (US$ Bn)
TABLE 187 Middle East and Africa Mobile Value Added Services Market, by Solution, 2017-2022 (US$ Bn)
TABLE 188 Middle East and Africa Mobile Value Added Services Market, by Solution, 2023-2030 (US$ Bn)
TABLE 189 Middle East and Africa Mobile Value Added Services Market, by End-User, 2017-2022 (US$ Bn)
TABLE 190 Middle East and Africa Mobile Value Added Services Market, by End-User, 2023-2030 (US$ Bn)
TABLE 191 GCC Countries Mobile Value Added Services Market, by Vertical, 2017-2022 (US$ Bn)
TABLE 192 GCC Countries Mobile Value Added Services Market, by Vertical, 2023-2030 (US$ Bn)
TABLE 193 GCC Countries Mobile Value Added Services Market, by Solution, 2017-2022 (US$ Bn)
TABLE 194 GCC Countries Mobile Value Added Services Market, by Solution, 2023-2030 (US$ Bn)
TABLE 195 GCC Countries Mobile Value Added Services Market, by End-User, 2017-2022 (US$ Bn)
TABLE 196 GCC Countries Mobile Value Added Services Market, by End-User, 2023-2030 (US$ Bn)
TABLE 197 South Africa Mobile Value Added Services Market, by Vertical, 2017-2022 (US$ Bn)
TABLE 198 South Africa Mobile Value Added Services Market, by Vertical, 2023-2030 (US$ Bn)
TABLE 199 South Africa Mobile Value Added Services Market, by Solution, 2017-2022 (US$ Bn)
TABLE 200 South Africa Mobile Value Added Services Market, by Solution, 2023-2030 (US$ Bn)
TABLE 201 South Africa Mobile Value Added Services Market, by End-User, 2017-2022 (US$ Bn)
TABLE 202 South Africa Mobile Value Added Services Market, by End-User, 2023-2030 (US$ Bn)
TABLE 203 Rest of Middle East and Africa Mobile Value Added Services Market, by Vertical, 2017-2022 (US$ Bn)
TABLE 204 Rest of Middle East and Africa Mobile Value Added Services Market, by Vertical, 2023-2030 (US$ Bn)
TABLE 205 Rest of Middle East and Africa Mobile Value Added Services Market, by Solution, 2017-2022 (US$ Bn)
TABLE 206 Rest of Middle East and Africa Mobile Value Added Services Market, by Solution, 2023-2030 (US$ Bn)
TABLE 207 Rest of Middle East and Africa Mobile Value Added Services Market, by End-User, 2017-2022 (US$ Bn)
TABLE 208 Rest of Middle East and Africa Mobile Value Added Services Market, by End-User, 2023-2030 (US$ Bn)

Frequently Asked Questions

What is the current size of the global mobile value added services market?

The global mobile value added services market was valued at USD 674.1 Billion in 2022.

What is the expected growth rate of the mobile value added services market between 2023 and 2030?

The mobile value added services market is expected to grow at a CAGR of 15.20% between 2023 and 2030, reaching USD 1815.1 Billion in 2030.

Which segment is leading the market share in terms of product?

Government category is the leading segment by product, holding over 21% share in terms of value in 2022.

Which solution segment governs the demand for mobile value added services in the world?

The mobile money segment governs the demand for mobile value added services in the world, holding a massive share of over 18% in 2022.

Which end-users segment is expected to post the highest CAGR during the forecast period?

The large enterprises segment is expected to post the highest CAGR during the forecast period.

Which region is fueling the growth of the mobile value added services industry?

Asia Pacific is fueling the growth of the mobile value added services industry, with over one-third share in 2022.

Who are the major players in the global mobile value added services market?

The top players include Samsung Electronics Co. Ltd., Huawei Investment & Holding Co. Ltd., One97 Communications, Alphabet Inc., Vodafone Group plc, Mozat Pte Ltd, OnMobile Global Limited, Reliance Industries Ltd., Apple Inc., and Comviva Technologies

What are the major market drivers of the mobile value added services industry?

The increased use of mobile applications and mobile web is one of the main drivers of the growth of the market for mobile value-added services.

What are the major market restraints of the mobile value added services industry?

Lack of regulations and rules for the various mobile value-added service (MVAS) market participants, who are responsible for consumer rights, data privacy, and legal obligations, may limit users and prevent them from using mobile value-added services.

What are the major market opportunities of the mobile value added services industry?

The advent of cloud-based VAS systems, improvements to the telecommunications infrastructure, and advances in 5G technology are anticipated to fuel market growth.

Supervisory Control and Data Acquisition (SCADA) Market

Published:
Report ID: 10131

India CCTV Camera Market

Published:
Report ID: 37170

Simulation Software Market

Published:
Report ID: 36908

Bioinformatics Market

Published:
Report ID: 14530

Fish Hook Sensor Market

Published:
Report ID: 36774

Big Data Services Market

Published:
Report ID: 3020

Saudi Arabia Managed Security Services Market

Published:
Report ID: 36393

Microwave Oven Market

Published:
Report ID: 36314

Inkjet Coders Market

Published:
Report ID: 6669

Rich Communication Services Market

Published:
Report ID: 35774

Middle East and Africa Real-Time Payments Market

Published:
Report ID: 35770

Vietnam Managed Security Services (MSS) Market

Published:
Report ID: 35766

Purchase Options

$2999
Delivery Format: Excel.
$4999
Designed for the individual purchaser.
$6999
Users located at a single corporate site or regional office.
$7999
Allowed for unlimited sharing globally within one company.
Smallform of Sample request

Have a question?

User Profile

Don’t settle for less – trust Mitul to help you find the best solution.

Report delivery within 24 to 48 hours

– Other Info –

What people say?-

User Review

I am very impressed with the information in this report. The author clearly did their research when they came up with this product and it has already given me a lot of ideas.

Jana Schmidt
CEDAR CX Technologies

– Connect with us –

Phone

+91 6232 49 3207


support

24/7 Research Support


sales@credenceresearch.com

– Research Methodology –

Going beyond the basics: advanced techniques in research methodology

– Trusted By –

Pepshi, LG, Nestle
Motorola, Honeywell, Johnson and johnson
LG Chem, SIEMENS, Pfizer
Unilever, Samsonite, QIAGEN