
Market Overview
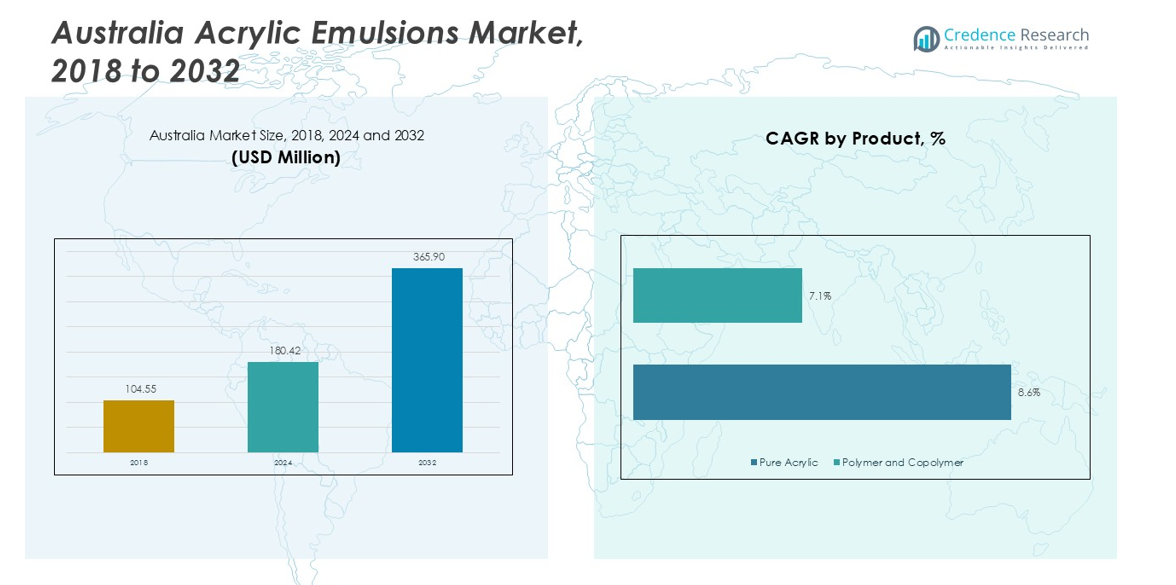
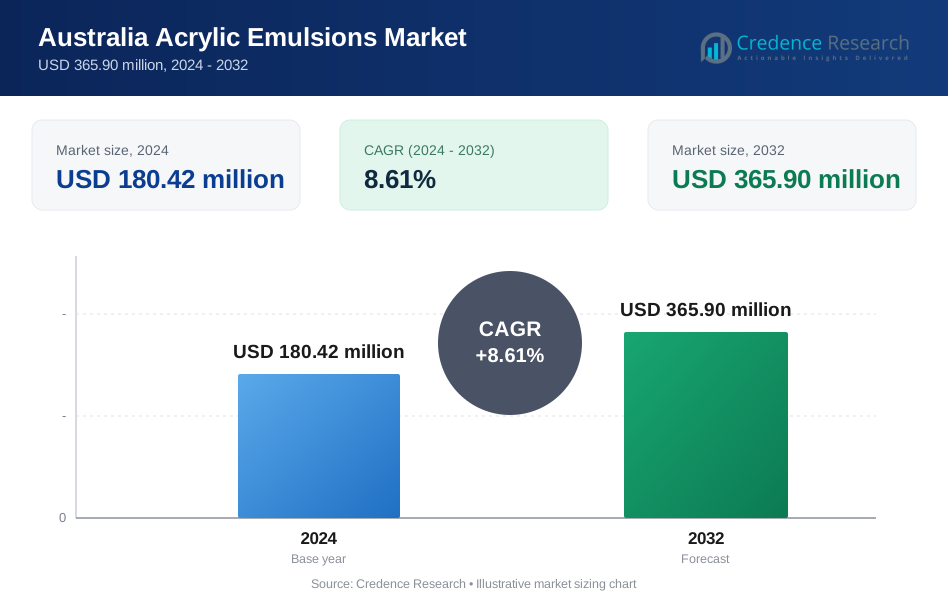
Australia Acrylic Emulsions Market was valued at USD 104.55 million in 2018 and grew to USD 180.42 million in 2024. It is anticipated to reach USD 365.90 million by 2032, exhibiting a CAGR of 8.61% during the forecast period.
| REPORT ATTRIBUTE | DETAILS |
|---|---|
| Historical Period | 2020-2023 |
| Base Year | 2024 |
| Forecast Period | 2025-2032 |
| Australia Acrylic Emulsions Market Size 2024 | USD 180.42 million |
| Australia Acrylic Emulsions Market, CAGR | 8.61% |
| Australia Acrylic Emulsions Market Size 2032 | USD 365.90 million |
The top players in the Australia Acrylic Emulsions market include Akzo Nobel N.V., BASF SE, Arkema, Synthomer plc, DIC Group, Trinseo PLC, Clariant AG, Dow, Celanese Corporation, and Avery Dennison, who dominate through innovation, product differentiation, and strong distribution networks. These companies focus on developing high-performance and eco-friendly acrylic emulsions tailored for paints, coatings, adhesives, and construction additives. New South Wales leads regional consumption with a market share of 28%, driven by residential, commercial, and industrial construction activities. Victoria follows with 22%, supported by urban development and infrastructure projects, while Queensland contributes 18%, reflecting strong demand for architectural and industrial applications. Together, these regions capture the majority of Australia’s market, with key players leveraging technological advancements and sustainability initiatives to maintain leadership, expand market penetration, and meet evolving regulatory and consumer requirements across diverse end-user segments.
Market Insights
- The Australia Acrylic Emulsions market was valued at USD 180.42 million in 2024 and is projected to reach USD 365.90 million by 2032, growing at a CAGR of 8.61%, driven by increasing demand across architectural, industrial, and commercial applications.
- Rapid expansion in residential and commercial construction, along with infrastructure development in urban regions, is fueling demand for high-performance paints, coatings, adhesives, and construction additives.
- The market is witnessing trends toward eco-friendly, low-VOC acrylic emulsions and technologically advanced polymer-copolymer formulations, supported by sustainability initiatives and consumer preference for long-lasting, high-quality finishes.
- Competition is intense with major players such as Akzo Nobel N.V., BASF SE, Arkema, Synthomer plc, and Dow focusing on innovation, product differentiation, and strategic partnerships to capture market share.
- Regionally, New South Wales leads with 28%, followed by Victoria 22% and Queensland 18%, while pure acrylic dominates the product segment and paints and coatings hold the largest application share.
Market Segmentation Analysis:
By Product Segment:
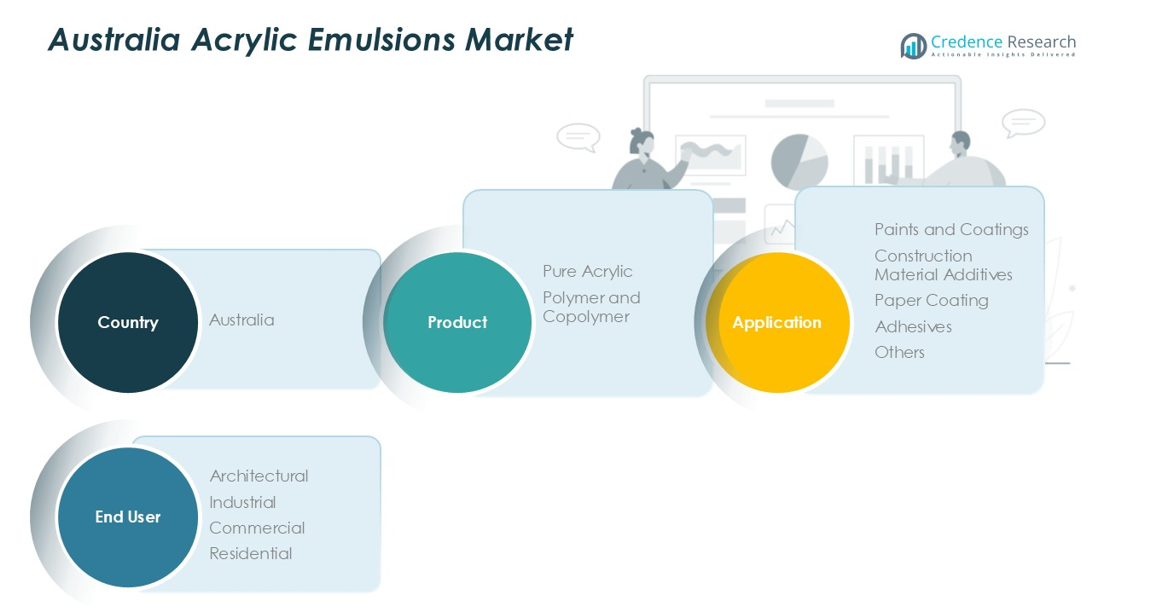
In the Australia Acrylic Emulsions market, the product segment is primarily divided into Pure Acrylic and Polymer and Copolymer. Pure Acrylic dominates the segment, accounting for approximately 60% of the market share, driven by its superior adhesion, flexibility, and resistance to UV and weathering, making it ideal for high-performance coatings and paints. Polymer and Copolymer follow closely, favored in specialized applications requiring tailored properties such as enhanced film formation and chemical resistance. The growing construction and industrial sectors fuel demand for versatile acrylic formulations, sustaining robust growth across both sub-segments.
- For instance, Dow’s PRIMAL™ AC-2337 pure acrylic emulsion polymer is used extensively in exterior house paints for its enhanced dirt pick-up resistance, superior gloss, and long-lasting wood protection.
By Application Segment:
The application segment encompasses Paints and Coatings, Construction Material Additives, Paper Coating, Adhesives, and Others, with Paints and Coatings holding the largest share at around 55%. This dominance is propelled by increased residential and commercial construction activities, as well as demand for durable, weather-resistant coatings. Construction Material Additives and Adhesives are also witnessing steady growth due to their role in improving product performance, such as water resistance and bonding strength. Innovations in eco-friendly and low-VOC acrylic formulations further strengthen the segment, appealing to environmentally conscious architects and builders.
- For instance, AkzoNobel's Interpon A1242 powder coating offers excellent corrosion and chip resistance, specifically designed for automotive suspension springs, illustrating the durability demanded in coatings.
By End User Segment:
The end-user segment includes Architectural, Industrial, Commercial, and Residential applications, where Architectural emerges as the leading sub-segment with roughly 50% market share. The growth is driven by rising urbanization, infrastructure development, and the demand for aesthetically superior and long-lasting finishes in both new and renovation projects. Industrial and Commercial segments contribute steadily as well, leveraging acrylic emulsions in adhesives, coatings, and specialty materials. Residential demand is rising due to DIY trends and increasing preference for high-performance, low-maintenance paint solutions in homes.
Key Growth Drivers
Rising Construction and Infrastructure Development
The rapid expansion of residential, commercial, and industrial construction projects in Australia is a primary growth driver for the acrylic emulsions market. Increasing demand for durable, weather-resistant coatings and construction material additives supports higher consumption of acrylic emulsions. Developers and architects are adopting high-performance paints and coatings to enhance building longevity and aesthetic appeal. This trend fuels demand for both pure acrylic and polymer-copolymer products, driving consistent revenue growth across architectural and industrial end-user segments, particularly in urban and suburban development zones.
- For instance, Arkema S.A. introduced ENCOR 2793, a functionalized pure acrylic binder formulated for primers and renovation paints, offering environmentally friendlier solutions without alkyl phenol ethoxylates or formaldehyde releasers.
Growing Demand for Eco-Friendly and Low-VOC Products
Environmental regulations and consumer preference for sustainable products have accelerated the adoption of low-VOC and eco-friendly acrylic emulsions. Manufacturers are investing in advanced formulations that reduce harmful emissions without compromising performance. This driver benefits paints, coatings, and adhesives applications, particularly in the architectural and residential segments. The trend toward environmentally responsible construction materials and coatings creates new market opportunities, positioning acrylic emulsions as a preferred solution for sustainable building projects and green initiatives across commercial and industrial sectors.
- For instance, Shandong Sanjiajuhe's Eco-Conscious Acrylic Emulsion Polymer Resin, which features a fast-drying formula and exceptional weatherability.
Expanding Industrial and Commercial Applications
The industrial sector’s increasing use of acrylic emulsions in adhesives, coatings, and specialty products is a significant growth driver. Industries such as automotive, packaging, and paper coating rely on acrylic emulsions for their adhesion, flexibility, and chemical resistance properties. Rising commercial renovation projects and packaging innovations further stimulate demand. As manufacturers continue to develop tailored formulations for specific industrial requirements, adoption expands across multiple verticals, solidifying acrylic emulsions’ role as a versatile, high-performance material in Australia’s industrial and commercial markets.
Key Trends & Opportunities
Technological Innovation and Product Customization
Manufacturers are increasingly focusing on developing customized acrylic emulsions to meet diverse application needs, including improved adhesion, faster drying, and enhanced chemical resistance. Innovations such as hybrid copolymers and specialty additives open opportunities in high-performance coatings and adhesives. This trend allows companies to differentiate their products in competitive markets, cater to industrial and commercial demand, and tap into specialized applications like paper coatings and construction additives, creating significant growth potential in Australia’s evolving coatings and adhesives landscape.
- For instance, BASF offers ACRONAL® 4000, a styrene-acrylic emulsion polymer with high elongation and excellent water resistance, widely used in construction and industrial coatings to meet demanding durability requirements.
Expansion in Residential and DIY Segments
The rise of DIY home improvement and residential remodeling projects presents opportunities for the acrylic emulsions market. Consumers increasingly prefer easy-to-use, high-performance paints and coatings that offer durability and aesthetic appeal. Companies are capitalizing on this trend by offering ready-to-use, eco-friendly acrylic products suitable for homeowners. Growth in residential end users, coupled with promotional strategies targeting DIY enthusiasts, expands market penetration and creates new revenue streams, especially in urban areas where home renovation activity is robust.
- For instance, Dulux developed Better Living Air Clean Biobased paint featuring Pure Air Technology that uses active bamboo charcoal and tea tree oil to purify indoor air, with 26% USDA-certified bio-based content and low VOC levels, enabling homeowners to improve both wall aesthetics and indoor air quality during DIY upgrades.
Key Challenges
Volatility in Raw Material Prices
Fluctuating prices of raw materials, including acrylic monomers and polymer additives, pose a significant challenge for manufacturers. Price volatility can impact profit margins, production costs, and pricing strategies for acrylic emulsions. Companies must balance cost efficiency with maintaining product quality and performance, particularly in competitive end-user segments like architectural and industrial applications. This challenge necessitates strategic sourcing, long-term supplier agreements, and operational efficiency measures to mitigate risks associated with input cost fluctuations.
Intense Market Competition
The Australia acrylic emulsions market is highly competitive, with multiple global and regional players vying for market share. Intense competition can pressure pricing, limit differentiation, and challenge new entrants. Established players must continuously innovate and offer value-added solutions, such as eco-friendly formulations or specialized copolymers, to maintain a competitive edge. Market saturation in mature segments like paints and coatings further complicates growth, requiring companies to focus on niche applications, technological advancements, and strategic partnerships to sustain profitability and market presence.
Regional Analysis
New South Wales
New South Wales holds a dominant position in the Australia Acrylic Emulsions market with a market share of 28%, driven by extensive residential, commercial, and industrial construction projects, particularly in Sydney and its surrounding urban centers. Architectural applications lead demand, fueled by growing urbanization and renovation activities. Paints, coatings, and construction material additives are widely adopted for their durability, weather resistance, and aesthetic appeal. Manufacturers are leveraging advanced formulations, including pure acrylic and polymer-copolymer emulsions, to meet performance requirements. Government initiatives promoting sustainable construction and low-VOC products further enhance market growth, solidifying New South Wales as a key contributor to national acrylic emulsion consumption.
Victoria
Victoria contributes 22% to the Australia Acrylic Emulsions market, supported by robust demand from Melbourne and regional cities for residential, commercial, and industrial construction projects. Architectural applications dominate, while industrial and commercial segments are expanding due to increased adoption of adhesives, coatings, and specialty paper products. Pure acrylic and polymer-copolymer products remain preferred for their high performance, UV resistance, and flexibility. Rising interest in eco-friendly, low-VOC formulations further stimulates growth. Manufacturers focus on technological innovations and product customization to address local climate conditions and end-user requirements, making Victoria a strategic market for acrylic emulsions in Australia with steadily increasing adoption across multiple segments.
Queensland
Queensland accounts for 18% of the Australia Acrylic Emulsions market, driven by demand from residential, commercial, and industrial projects in Brisbane and surrounding areas. Architectural applications dominate, supported by paints, coatings, and construction additives that provide durability and weather resistance. Industrial and commercial adoption is growing, particularly in adhesives and specialty coatings, benefiting from tailored polymer-copolymer and pure acrylic formulations. Urban development and government infrastructure projects further stimulate demand. Manufacturers are introducing climate-specific solutions to withstand Queensland’s tropical conditions. Combined with rising adoption of eco-friendly, low-VOC products, Queensland maintains a strong position in the national market and contributes significantly to overall acrylic emulsion consumption.
Western Australia
Western Australia holds 15% market share in the Australia Acrylic Emulsions market, driven by industrial, mining, and urban infrastructure projects in Perth and surrounding areas. Architectural and industrial applications dominate, supported by paints, coatings, adhesives, and specialty products designed for harsh environmental conditions. Polymer-copolymer emulsions are increasingly preferred due to their flexibility, chemical resistance, and high performance. Residential development also contributes to market expansion, supported by durable and aesthetically appealing finishes. Manufacturers focus on eco-friendly and low-VOC formulations to align with sustainability initiatives. These factors, combined with technological innovation, strengthen Western Australia’s role as a key market in the national acrylic emulsions landscape.
South Australia
South Australia contributes 9% to the Australia Acrylic Emulsions market, fueled by construction activity in Adelaide and regional centers. Architectural applications dominate, with paints, coatings, and construction additives preferred for durability, aesthetics, and weather resistance. Industrial usage is gradually expanding, particularly in adhesives and specialty coatings. Demand is supported by eco-friendly, low-VOC formulations, responding to environmental awareness among end users. Renovation projects and government infrastructure initiatives further drive market adoption. Manufacturers are focusing on performance-enhancing formulations to meet regional climatic requirements, while also introducing product customization to satisfy architectural and industrial needs. South Australia remains a growing contributor to national acrylic emulsion demand.
Market Segmentations:
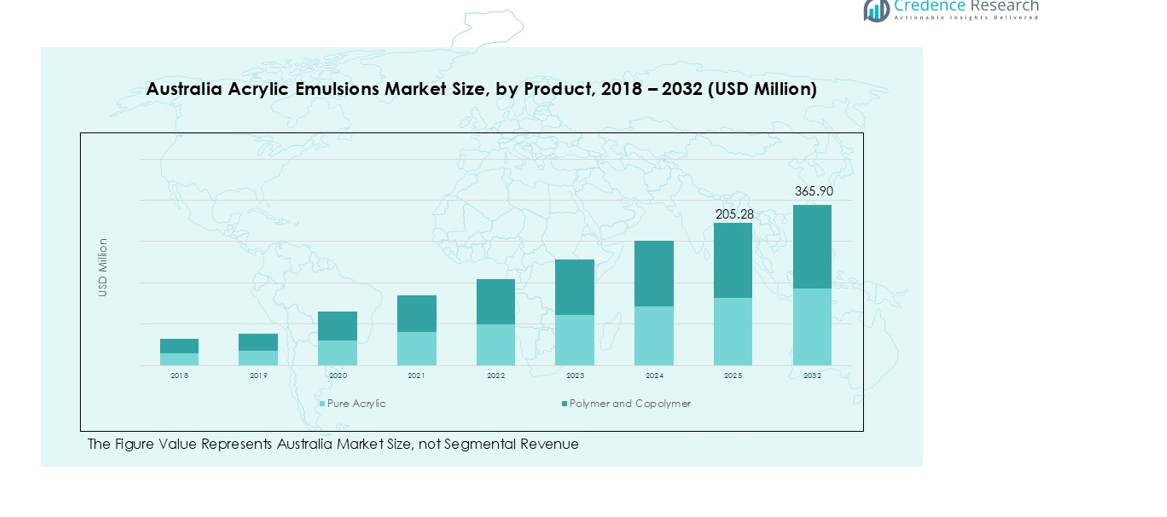
By Product:
- Pure Acrylic
- Polymer and Copolymer
By Application:
- Paints and Coatings
- Construction Material Additives
- Paper Coating
- Adhesives
- Others
By End User:
- Architectural
- Industrial
- Commercial
- Residential
By Region
- New Southwales
- Victoria
- Queensland
- Western Australia
- South Australia
Competitive Landscape
The competitive landscape of the Australia Acrylic Emulsions market features key players including Akzo Nobel N.V., BASF SE, Arkema, Synthomer plc, DIC Group, Trinseo PLC, Clariant AG, Dow, Celanese Corporation, and Avery Dennison. The market is highly competitive, driven by continuous innovation, product differentiation, and strategic expansion initiatives. Companies focus on developing eco-friendly, low-VOC, and high-performance formulations to meet growing demand from architectural, industrial, and commercial end users. Collaborations, mergers, and acquisitions are common strategies to strengthen market presence and distribution networks. Investment in R&D enables the introduction of specialized polymer-copolymer and pure acrylic emulsions tailored for specific applications, such as paints, coatings, adhesives, and construction additives. Market leaders also leverage sustainability trends and regulatory compliance to gain competitive advantage, while smaller players compete by offering niche products and cost-effective solutions, ensuring dynamic competition throughout the Australian acrylic emulsions market.
Key Player Analysis
- Akzo Nobel N.V.
- BASF SE
- Arkema
- Synthomer plc
- DIC Group
- Trinseo PLC
- Clariant AG
- Dow
- Celanese Corporation
- Avery Dennison
Recent Developments
- In April 2024, Lubrizol invested $20 million to expand its acrylic emulsion manufacturing capacity at its Gastonia, North Carolina facility, aiming to meet growing demand for innovative emulsions in coatings applications.
- In July 2023, Nippon Paint Holdings completed the acquisition of a 51% stake in N.P.T. s.r.l., an Italy-based manufacturer of sealants and adhesives, to strengthen its foothold in the European market.
- In March 2025, Axalta Coating Systems announced the acquisition of U-POL Australia and New Zealand. This strategic move enhances Axalta's portfolio in automotive refinishing products, including paints and coatings.
Report Coverage
The research report offers an in-depth analysis based on Type, Product, End User and Region. It details leading market players, providing an overview of their business, product offerings, investments, revenue streams, and key applications. Additionally, the report includes insights into the competitive environment, SWOT analysis, current market trends, as well as the primary drivers and constraints. Furthermore, it discusses various factors that have driven market expansion in recent years. The report also explores market dynamics, regulatory scenarios, and technological advancements that are shaping the industry. It assesses the impact of external factors and global economic changes on market growth. Lastly, it provides strategic recommendations for new entrants and established companies to navigate the complexities of the market.
Future Outlook
- Demand for high-performance acrylic emulsions will continue to rise across residential, commercial, and industrial applications.
- Eco-friendly and low-VOC formulations will see increasing adoption due to sustainability regulations and consumer preferences.
- Architectural applications will remain the largest end-user segment, driven by urbanization and renovation projects.
- Industrial and commercial sectors will expand demand for specialized adhesives, coatings, and paper coating solutions.
- Polymer-copolymer products will gain traction due to enhanced flexibility, chemical resistance, and durability.
- Technological innovation and product customization will become critical for market differentiation.
- Key players will focus on strategic partnerships, mergers, and acquisitions to strengthen market presence.
- Regional growth will remain concentrated in New South Wales, Victoria, and Queensland.
- Manufacturers will invest in research and development for climate-resilient and high-performance emulsions.
- Rising awareness of sustainable construction will create long-term opportunities for premium acrylic emulsion products.
Request a Free Sample
Fill in your details and we'll send you a free sample report.
- Sample data tables & charts
- Research methodology
Need a Custom Version of This Report?
Tailor the scope, geography, or segments to your exact requirements.
- Custom geography or segment scope
- Direct access to our analyst team
Frequently Asked Questions
What is the current market size for Australia Acrylic Emulsions market, and what is its projected size in 2032?
At what Compound Annual Growth Rate is the Australia Acrylic Emulsions market projected to grow between 2025 and 2032?
Which Australia Acrylic Emulsions market segment held the largest share in 2024?
What are the primary factors fueling the growth of the Australia Acrylic Emulsions market?
Who are the leading companies in the Australia Acrylic Emulsions market?
Table of Content
Chapter 1. Report Introduction
- 1.1 Report Description & Purpose
- 1.1.1 Report Title & Market Definition
- 1.1.2 Unique Selling Propositions (USP) & Key Differentiators
- 1.1.3 Value Proposition for Stakeholders
- 1.2 Research Objectives
- 1.2.1 Market Sizing Objectives (Volume & Revenue)
- 1.2.2 Segmentation Objectives
- 1.2.3 Competitive Intelligence Objectives
- 1.2.4 Forecast & Scenario Objectives
- 1.3 Report Scope
- 1.3.1 Australia Acrylic Emulsions Scope – Types & Subtypes Covered
- 1.3.2 Geographic Scope – Regions & Countries Covered
- 1.3.3 Historical Period, Base Year & Forecast Period (2024; forecast to 2032)
- 1.3.4 Inclusions & Exclusions
- 1.4 HS Code & Classification Framework
- 1.5 Currency, Units & Pricing Basis
- 1.6 Target Stakeholders
- 1.7 Limitations & Assumptions
Chapter 2. Executive Summary
- 2.1 Global Australia Acrylic Emulsions Market Snapshot
- 2.1.1 Market Size – Historical (2024) & Forecast (2024-2032) (2024: USD 180.42 million → 2032: USD 365.90 million)
- 2.1.2 Volume & Revenue – Global Totals
- 2.1.3 Key Market Highlights – Top Five Facts
- 2.2 Australia Acrylic Emulsions Market Segmentation Snapshot
- 2.2.1 Market Split by Region – 2024 vs. 2032
- 2.3 Competitive Snapshot
- 2.3.1 Top 10 Players by Revenue Share – 2024
- 2.3.2 Top 10 Players by Volume Share – 2024
- 2.3.3 Recent Strategic Developments (18-Month Summary)
- 2.4 Key Investment Highlights & Strategic Conclusions
Chapter 3. Australia Acrylic Emulsions Market Dynamics & Industry Analysis
- 3.1 Market Overview & Context
- 3.1.1 Australia Acrylic Emulsions Market Position in the Broader Automotive Value Chain
- 3.1.2 OEM vs. Replacement Market Dynamics
- 3.1.3 Market Maturity & Development Stage by Region
- 3.2 Australia Acrylic Emulsions Market Drivers
- 3.3 Australia Acrylic Emulsions Market Restraints & Challenges
- 3.4 Australia Acrylic Emulsions Market Opportunities
- 3.5 Porter's Five Forces Analysis
- 3.5.1 Threat of New Entrants
- 3.5.2 Bargaining Power of Suppliers
- 3.5.3 Bargaining Power of Buyers
- 3.5.4 Threat of Substitutes
- 3.5.5 Competitive Rivalry – Intensity Assessment
- 3.6 Australia Acrylic Emulsions Value Chain Analysis
- 3.6.1 Upstream – Raw Material/Input Suppliers
- 3.6.1.1 Raw Material/Input 1
- 3.6.1.2 Raw Material/Input 2
- 3.6.1.3 Raw Material/Input 3
- 3.6.2 Midstream – Production/Manufacturing/Service Delivery
- 3.6.2.1 Production/Process Overview
- 3.6.2.2 Key Facility Locations & Capacity by Manufacturer
- 3.6.3 Downstream – Distribution & End Consumer
- 3.6.3.1 Primary Channel – B2B/OEM
- 3.6.3.2 Secondary Channels – Dealer, Retail, Online, Direct
- 3.6.4 Value Chain Profitability Analysis
- 3.6.1 Upstream – Raw Material/Input Suppliers
- 3.7 PESTEL Analysis
- 3.7.1 Political Factors
- 3.7.2 Economic Factors
- 3.7.3 Social Factors
- 3.7.4 Technological Factors
- 3.7.5 Environmental Factors
- 3.7.6 Legal Factors
- 3.8 Australia Acrylic Emulsions Supply Chain Analysis
- 3.8.1 Raw Material/Input Supply Risk Assessment
- 3.8.2 Manufacturing Concentration Risk (Geographic Exposure)
- 3.8.3 Trade Disruption Impact Analysis
- 3.9 Regulatory & Policy Landscape
Note: The regulatory and policy landscape section covers regulations based on their applicability to the market, Australia Acrylic Emulsions category, geography, and scope of the study. Only regulatory frameworks with a material impact on operations, compliance, trade, sustainability, or market access are analyzed in detail.
Chapter 4. Key Investment Pockets & Opportunity Analysis
- 4.1 Australia Acrylic Emulsions Market Attractiveness Analysis
- 4.1.1 By Region – Investment Attractiveness Matrix (Volume × CAGR)
- 4.2 Absolute Revenue Growth Opportunity
- 4.2.1 By Region – Absolute USD Growth Through 2032
- 4.3 Incremental Volume Opportunity
- 4.3.1 By Region – Incremental Volume Through 2032
- 4.3.2 Segment – Incremental Volume
- 4.4 Emerging Submarket Opportunity Deep Dive (Subject to Applicability)
- 4.5 Emerging Market Opportunity Scorecards
- 4.5.1 United States
- 4.5.2 Europe
- 4.5.3 Asia
- 4.5.4 Middle East & Africa
Note: Emerging Market Opportunity Scorecards will be included based on relevance and strategic importance. Regions listed are indicative and may vary depending on data availability and market dynamics.
Chapter 5. Australia Acrylic Emulsions Import-Export Analysis & Trade Flows
- 5.1 Global Trade Overview
- 5.1.1 Global Export Value by Country (2024)
- 5.1.2 Global Export Volume by Country (2024)
- 5.1.3 Global Import Value by Country (2024)
- 5.1.4 Global Import Volume by Country (2024)
- 5.1.5 Net Trade Balance by Country (2024)
- 5.2 Export Analysis – Segment
- 5.2.1 Type 1 (HS Code)
- 5.2.2 Type 2 (HS Code)
- 5.2.3 Type 3 (HS Code)
- 5.2.4 Type 4 (HS Code)
- 5.2.5 Type 5 (HS Code)
- 5.3 Import Analysis – Segment
- 5.3.1 Type 1 (HS Code)
- 5.3.2 Type 2 (HS Code)
- 5.3.3 Type 3 (HS Code)
- 5.3.4 Type 4 (HS Code)
- 5.3.5 Type 5 (HS Code)
- 5.4 Average Unit Trade Prices
- 5.4.1 Average Export Price – Segment & Country
- 5.4.2 Average Import Price – Segment & Source Country
- 5.4.3 Price Trends (2024)
- 5.5 Key Trade Route Analysis
- 5.5.1 Trade Route 1
- 5.5.2 Trade Route 2
- 5.5.3 Trade Route 3
- 5.5.4 Trade Route 4
- 5.5.5 Trade Route 5
- 5.6 Trade Policy Impact Assessment
- 5.6.1 US Anti-Dumping & Section 301 Tariffs
- 5.6.2 EU Customs Union Impact
- 5.6.3 Major Free Trade Agreements
- 5.6.4 USMCA Rules of Origin
Note: Trade policy analysis will be included only where relevant to the Australia Acrylic Emulsions market.
Chapter 6. Competitive Landscape & Company Benchmarking
- 6.1 Australia Acrylic Emulsions Market Concentration & Structure
- 6.1.1 Herfindahl-Hirschman Index (HHI) – vs. 2024
- 6.1.2 Tier 1, Tier 2 & Tier 3 Market Structure
- 6.1.3 Global, Regional & Local Player Dynamics
- 6.2 Australia Acrylic Emulsions Market Share Analysis – 2024
- 6.2.1 Global Revenue Share by Company
- 6.2.2 Global Volume Share by Company
- 6.2.3 Regional Revenue Share
- 6.2.4 Market Share Evolution ( vs. 2024)
- 6.2.5 OEM Segment Share by Company
- 6.2.6 Replacement Segment Share by Company
- 6.3 Production/Delivery Capacity & Facility Analysis
- 6.3.1 Global Installed Capacity
- 6.3.2 Capacity Utilization Rates
- 6.3.3 Production/Output Volume
- 6.3.4 Facility Locations & Capacity Map
- 6.3.5 Planned Capacity Additions
- 6.4 Australia Acrylic Emulsions Competitive Benchmarking Matrix
- 6.4.1 Revenue, Volume, CAGR & Profitability Comparison
- 6.4.2 Channel Revenue Mix
- 6.4.3 Geographic Revenue Exposure
- 6.4.4 R&D Intensity
- 6.4.5 Sustainability Maturity
- 6.5 Strategic Developments in Australia Acrylic Emulsions (Last 24 Months)
- 6.5.1 Mergers, Acquisitions & Divestments
- 6.5.2 New Australia Acrylic Emulsions Launches
- 6.5.3 Facility Expansions
- 6.5.4 Strategic Alliances, Joint Ventures & Partnerships
- 6.5.5 Distribution Expansion & Market Entry
- 6.5.6 Sustainability & ESG Initiatives
- 6.6 Competitive Strategy Mapping
- 6.6.1 Leader, Challenger, Follower & Niche Classification
- 6.6.2 Pricing Strategy Comparison
- 6.6.3 Channel Strategy Matrix
Note: Strategic developments are included based on their materiality and the availability of reliable information.
Chapter 7. Global Australia Acrylic Emulsions Market – By Distribution Channel
- 7.1 Segment Overview
- 7.1.1 Volume & Revenue Split by Channel (2024 & 2032)
- 7.1.2 Channel Mix Evolution (2024-2032)
Chapter 8. Regional Market Analysis – Global Overview
- 8.1 Global Regional Overview
- 8.1.1 Regional Volume Share
- 8.1.2 Regional Revenue Share
- 8.1.3 Regional Volume by Region
- 8.1.4 Regional Revenue by Region
- 8.1.5 Regional Forecast Through 2032
- 8.2 Cross-Regional Segment Analysis
- 8.2.1 By Distribution Channel
- 8.2.2 By Brand/Price Tier
Chapter 9. North America Australia Acrylic Emulsions Market
- 9.1 United States
- 9.2 Canada
- 9.3 Mexico
Chapter 10. Europe Australia Acrylic Emulsions Market
- 10.1 Germany
- 10.2 France
- 10.3 Italy
- 10.4 United Kingdom
- 10.5 Spain
- 10.6 Poland
- 10.7 Russia
- 10.8 Netherlands
- 10.9 Belgium
- 10.10 Sweden
- 10.11 Denmark
- 10.12 Norway
- 10.13 Rest of Europe
Chapter 11. Asia Pacific Australia Acrylic Emulsions Market
- 11.1 China
- 11.2 India
- 11.3 Japan
- 11.4 South Korea
- 11.5 Thailand
- 11.6 Indonesia
- 11.7 Vietnam
- 11.8 Malaysia
- 11.9 Australia
- 11.10 Rest of Asia Pacific
Chapter 12. Latin America Australia Acrylic Emulsions Market
- 12.1 Brazil
- 12.2 Argentina
- 12.3 Colombia
- 12.4 Chile
- 12.5 Rest of Latin America
Chapter 13. Middle East Australia Acrylic Emulsions Market
- 13.1 Saudi Arabia
- 13.2 United Arab Emirates
- 13.3 Turkey
- 13.4 Israel
- 13.5 Iran
- 13.6 Rest of the Middle East
Chapter 14. Africa Australia Acrylic Emulsions Market
- 14.1 South Africa
- 14.2 Egypt
- 14.3 Nigeria
- 14.4 Morocco
- 14.5 Rest of Africa
Chapter 15. Australia Acrylic Emulsions Company Profiles
- 15.1 [Company 01]
- 15.1.1 Company Overview
- 15.1.2 Key Management Personnel
- 15.1.3 Products & Services Portfolio
- 15.1.4 Financial Performance
- 15.1.5 Key Market Focus & Geographic Presence
- 15.1.6 Recent Developments & Strategic Initiatives
Note: The company profile list is preliminary and may change based on research findings, market developments, data availability, and client requirements.
Chapter 16. Appendices
- Appendix A – List of Abbreviations & Acronyms
- Appendix B – Industry Classification Code Reference – Full Series
- Appendix C – Production & Capacity Data Tables
- Appendix D – End-Use & Demand Base Tables
- Appendix E – Consumption & Replacement Rate Assumptions
- Appendix F – ASP Reference Tables
- Appendix G – Manufacturing & Facility Database
- Appendix H – Import-Export Data Tables
- Appendix I – Regulatory Summary Tables
- Appendix J – Primary Research Participant List (Anonymized)
- Appendix K – Primary Research Questionnaire Framework
- Appendix L – Data Sources & Bibliography
- Appendix M – Market Size Divergence & Source Comparison
Chapter 17. Research Methodology
- 17.1 Research Framework & Philosophy
- 17.2 Secondary Research – Sources, Hierarchy & Data Extraction
- 17.3 Data Modeling – Bottom-Up & Top-Down Market Sizing
- 17.4 Primary Research – Stakeholder Framework, LOI & Sample Sizes
- 17.5 Forecast Methodology – Regression, Scenario & Sensitivity Analysis
- 17.6 Quality Control – Four-Layer Validation Framework
- 17.7 Limitations & Standard Assumptions
- 17.8 Disclaimer
