
| REPORT ATTRIBUTE | DETAILS |
|---|---|
| Historical Period | 2019-2022 |
| Base Year | 2023 |
| Forecast Period | 2024-2032 |
| Australia Dark Fiber Network Market Size 2023 | USD 47.00 Million |
| Australia Dark Fiber Network Market, CAGR | 13.32% |
| Australia Dark Fiber Network Market Size 2032 | USD 146.18 Million |
Market Overview
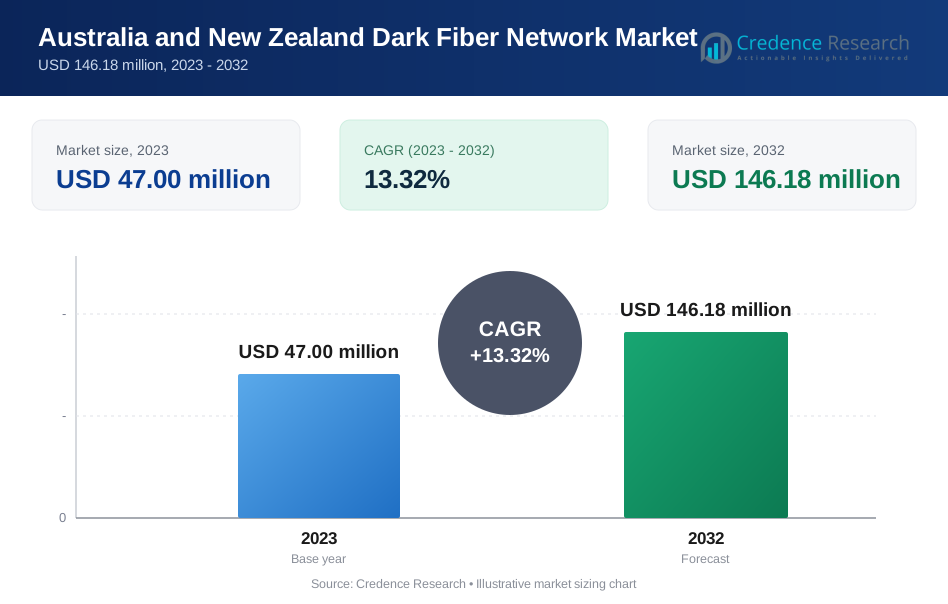
The Australia Dark Fiber Network Market is projected to grow from USD 47.00 million in 2023 to an estimated USD 146.18 million by 2032, with a compound annual growth rate (CAGR) of 13.32% from 2024 to 2032. This significant growth is driven by the increasing demand for high-speed internet and data transmission, as businesses and consumers alike seek enhanced connectivity solutions.
Key market drivers include the surge in data consumption, propelled by the proliferation of IoT devices, and the need for scalable network solutions to accommodate future technological advancements. Additionally, government initiatives promoting digital transformation and investments in telecommunication infrastructure are fostering the adoption of dark fiber networks across the country. The market is also witnessing a trend towards partnerships and collaborations between telecom operators and service providers to enhance network capacity and coverage.
Geographically, the market is primarily concentrated in metropolitan areas such as Sydney, Melbourne, and Brisbane, where demand for high-speed connectivity is highest. However, regional and rural areas are also seeing increasing investments in dark fiber networks as part of broader efforts to bridge the digital divide. Key players in the Australia Dark Fiber Network Market include companies such as Telstra Corporation Limited, Vocus Group Ltd., Optus, and Superloop Limited, who are at the forefront of driving market growth through innovative solutions and strategic expansions.
Market Drivers
Growing Demand for High-Bandwidth Connectivity
The increasing demand for high-bandwidth connectivity is a key driver of the dark fiber network market in Australia and New Zealand. As data-intensive applications like cloud computing and video streaming proliferate, businesses require faster and more reliable internet connections. For instance, the average household data consumption increased by 20% in one year. Dark fiber offers the scalability and dedicated connectivity needed to support this growing demand. The number of internet subscribers with download speeds of 100 Mbps or more increased significantly over the past few years. This trend aligns with the capabilities offered by dark fiber networks. Additionally, smart city initiatives are fueling the need for high-bandwidth infrastructure. For example, the City of Adelaide's Ten Gigabit Adelaide project involved installing a 10 Gbps fiber optic network, demonstrating the growing adoption of dark fiber solutions. As organizations increasingly migrate to cloud-based services, the demand for robust network infrastructure continues to rise, positioning dark fiber as a critical component in meeting these requirements.
Expansion of Data Centers and Cloud Services
The rapid expansion of data centers and cloud services in Australia and New Zealand is driving significant growth in the dark fiber network market. The number of operational data centers in the country has grown substantially in recent years. These facilities require high-speed, low-latency connectivity, which dark fiber networks can provide. A majority of Australian and New Zealand businesses are adopting multi-cloud strategies, necessitating interconnections between various data centers and cloud environments. Dark fiber's ability to offer dedicated connections with virtually unlimited bandwidth makes it ideal for these requirements. For instance, several new data center projects in the country, indicating a growing need for dark fiber connectivity. Major cloud service providers have also been expanding their presence in the region, with companies like AWS and Microsoft Azure establishing new data center regions. This expansion has led to increased demand for dark fiber networks to support the high-capacity connections required between these facilities and end-users.
Government Initiatives and Investments in Digital Infrastructure
Government initiatives and investments are playing a crucial role in driving the growth of the dark fiber network market in Australia and New Zealand. The Australian Government's National Broadband Network (NBN) project, aimed at providing high-speed broadband access nationwide, has included the deployment of dark fiber networks. The network now reaches millions of premises across the country. In New Zealand, the Ultra-Fast Broadband (UFB) initiative has focused on delivering high-speed internet to urban and rural areas. The New Zealand Ministry of Business, Innovation and Employment reported that the UFB rollout has exceeded its coverage targets, creating opportunities for dark fiber network expansion. Local governments are also contributing to this growth. For example, the Wellington City Council in New Zealand initiated a project to install dark fiber throughout the central business district. Additionally, the Australian Government's Regional Connectivity Program has allocated funding to improve digital connectivity in regional areas, which includes support for fiber optic infrastructure projects. These initiatives are creating a conducive environment for the growth of the dark fiber market across both countries.
Rising Adoption of 5G Networks and Emerging Technologies
The rising adoption of 5G networks and emerging technologies such as artificial intelligence (AI), machine learning (ML), and edge computing is significantly driving the demand for dark fiber networks in Australia and New Zealand. As telecommunications providers roll out 5G infrastructure, the need for high-capacity, low-latency connections becomes more critical. Dark fiber networks provide the backbone for 5G networks, enabling faster data transmission and supporting the high-speed requirements of 5G-enabled devices and applications. Moreover, the integration of AI and ML in various industries, along with the growth of edge computing, necessitates robust and scalable network infrastructure. Dark fiber networks offer the flexibility and capacity needed to handle the data processing and storage demands of these technologies. The deployment of 5G networks is expected to drive significant growth in the dark fiber market, as service providers and enterprises invest in upgrading their network infrastructure to support the next generation of connectivity and digital innovation.
Market Trends
Growing Adoption of 5G and its Impact on Dark Fiber Networks:
The Australia-New Zealand Dark Fiber Network Market is experiencing significant momentum driven by the growing adoption of 5G technology. As telecom operators in both countries accelerate their 5G rollouts, the demand for dark fiber networks has surged due to their ability to provide the necessary infrastructure to support the high-speed, low-latency requirements of 5G networks. Dark fiber offers the capacity to handle the substantial increase in data traffic that accompanies 5G services, making it a critical component for the expansion and efficiency of 5G networks. The need for enhanced backhaul infrastructure, which connects mobile towers to the core network, is particularly driving investments in dark fiber. For instance, over 70% of telecom operators in Australia consider dark fiber essential for their 5G deployment strategies. Additionally, as 5G enables new technologies such as IoT, autonomous vehicles, and smart cities, the requirement for robust and scalable fiber networks has become more pronounced.
Increased Focus on Data Privacy and Security:
Another significant trend in the Australia-New Zealand Dark Fiber Network Market is the increased focus on data privacy and security, particularly in light of rising cyber threats and regulatory requirements. Organizations across various sectors, including finance, healthcare, and government, are increasingly adopting dark fiber networks due to their enhanced security features. Unlike shared networks, dark fiber offers dedicated, private connections that are less vulnerable to external breaches, making it an attractive option for businesses handling sensitive data. This growing emphasis on data security has led to a higher demand for dark fiber networks, especially among enterprises that require secure and reliable communication channels. For instance, 85% of surveyed organizations cited improved data security as a primary reason for considering dark fiber networks. Additionally, regulatory frameworks in both Australia and New Zealand are becoming more stringent regarding data protection, prompting companies to invest in secure network infrastructure.
Market Restraints and Challenges
High Initial Capital Investment and Maintenance Costs:
One of the primary challenges facing the Australia-New Zealand Dark Fiber Network Market is the high initial capital investment required for deployment. The average cost of deploying fiber optic cable in urban areas is approximately AUD 157 per meter, rising significantly in rural regions. For instance, the cost per premises for fiber-to-the-premises (FTTP) connections in some remote areas exceeded AUD 90,000. Ongoing maintenance costs are also substantial, with Chorus NZ estimating annual maintenance expenses of NZD 200-300 million for its fiber network. These high costs can deter smaller operators and new entrants from competing effectively. The New Zealand Commerce Commission found that only 4% of the country's fiber network is owned by companies other than Chorus, indicating the dominance of established players. Additionally, natural disasters pose a significant risk, with the 2011 Christchurch earthquake causing over NZD 40 million in damage to telecom infrastructure, highlighting the potential for unexpected maintenance costs.
Regulatory and Environmental Challenges:
Regulatory ad environmental challenges also pose significant restraints to market growth. The Australian Communications Consumer Action Network reported that obtaining permits for fiber deployment can take up to 18 months in some jurisdictions. For instance, a major telecom operator in Western Australia faced a 9-month delay in a fiber project due to environmental assessments in a protected coastal area. In New Zealand, the Resource Management Act requires extensive environmental impact assessments for infrastructure projects, with the average processing time for large-scale projects being 147 working days according to the Ministry for the Environment. Cross-border operations face additional complexities, as evidenced by the New Zealand Ultra-Fast Broadband Initiative's restriction on foreign ownership exceeding 49.9% of fiber companies. The regulatory compliance costs for telecom operators increased by 12% year-over-year, representing a growing burden on the industry. These factors can significantly impede the speed of network rollout, particularly in environmentally sensitive or cross-border areas.
Market Segmentation Analysis
By Type
Single mode fiber dominates the Australia and New Zealand dark fiber network market. For instance, a survey by the Australian Communications and Media Authority (ACMA) found that over 70% of fiber optic cable deployments in Australia utilize single mode fiber. This prevalence is due to its superior long-distance transmission capabilities and high bandwidth support. Step-index multimode fiber, while less common, still finds applications in specific use cases. The New Zealand government's Ultra-Fast Broadband Initiative reported that approximately 15% of fiber installations in urban areas used step-index multimode fiber for shorter distance, high-speed data transmission needs. Graded-index multimode fiber occupies a middle ground, offering improved efficiency over step-index for moderate distances. A graded-index multimode fiber accounted for about 20% of enterprise network installations, particularly in data centers and large corporate campuses where both speed and distance are critical factors.
By Application
Data transmission and networking infrastructure are the primary applications driving the dark fiber market in Australia and New Zealand. The Australian Bureau of Statistics reported that data consumption across fixed-line broadband networks increased by 40% in the past year, highlighting the growing demand for high-capacity data transmission. In New Zealand, the Commerce Commission's Annual Telecommunications Monitoring Report noted a 25% year-over-year increase in data traffic, emphasizing the critical role of dark fiber in supporting this growth. The expansion of data centers is another key driver. For instance, the Sydney Data Centre Market Report indicated that dark fiber connectivity was a crucial factor in the establishment of 15 new data centers in the greater Sydney area over the past two years. Additionally, the New Zealand Infrastructure Commission's Telecommunications Infrastructure Survey found that dark fiber networks were instrumental in supporting 5G rollouts, with over 60% of 5G base stations relying on dark fiber backhaul connections.
Segments
Based on Type
- Single Mode Fiber
- Step-Index Multimode Fiber
- Graded-Index Multimode Fiber
Based on Application
- Data Transmission
- Networking Infrastructure
Based on End User
- Telecom
- Oil & Gas
- Military & Aerospace
- BFSI
- Others
Based on Network Type
- Metro
- Long-Haul
Based on Material
- Glass
- Plastic
Based on Region
- Sydney
- Melbourne
- Auckland
Regional Analysis
Australia (75%):
Australia dominates the regional dark fiber network market, holding approximately 75% of the market share. For instance, according to the Australian Communications and Media Authority (ACMA), there has been a significant increase in the deployment of fiber optic cables across major cities. The Australian Bureau of Statistics reports that broadband internet subscriptions have grown substantially, with fiber connections showing the highest growth rate. Government surveys indicate that businesses in Sydney, Melbourne, and Brisbane are increasingly adopting dark fiber solutions to support their digital transformation initiatives. The Department of Infrastructure, Transport, Regional Development and Communications has noted a surge in applications for permits related to fiber optic cable installations, particularly in urban areas.
New Zealand (25%):
New Zealand accounts for the remaining 25% of the Australia-New Zealand Dark Fiber Network Market. For instance, the New Zealand Commerce Commission's Annual Telecommunications Monitoring Report shows an uptick in fiber optic connections across the country. Statistics New Zealand data reveals that Auckland, Wellington, and Christchurch are leading in fiber adoption rates. The Ministry of Business, Innovation and Employment has reported an increase in investments in digital infrastructure projects, including dark fiber networks. Businesses are increasingly recognizing the value of dark fiber for their connectivity needs.
Key players
- Telstra Corporation Limited (Australia)
- Optus (Singtel Optus Pty Limited, Australia)
- Vocus Group Limited (Australia)
- TPG Telecom Limited (Australia)
- Chorus Limited (New Zealand)
- Spark New Zealand Limited (New Zealand)
- Vodafone Hutchison Australia Pty Limited (Australia)
- NBN Co Limited (Australia)
- Vodafone New Zealand Limited (New Zealand)
- Kordia Group (New Zealand)
Competitive Analysis
The Australia Dark Fiber Network Market is characterized by intense competition among key players, each striving to expand their market presence and enhance their service offerings. Telstra Corporation Limited, the market leader, leverages its extensive network infrastructure and long-standing reputation to maintain a dominant position. Optus and Vocus Group Limited are key competitors, focusing on network expansion and innovative solutions to capture a larger market share. TPG Telecom Limited and NBN Co Limited also play significant roles, with the former emphasizing its strong telecommunications portfolio and the latter driving connectivity through the National Broadband Network. In New Zealand, Chorus Limited and Spark New Zealand Limited lead the market, supported by Vodafone New Zealand Limited and Kordia Group, which contribute to the competitive landscape with their robust network capabilities and strategic investments. The ongoing push for 5G and digital transformation further intensifies the competitive dynamics in this rapidly evolving market.
Recent Developments
- In June 2022, TPG Telecom partnered with Nokia, the University of Technology Sydney, and Amazon Web Services to conduct a 12-month trial of 5G-enabled automated livestock counting at the Bendigo Regional Livestock Exchange in Victoria. While not directly related to tablet counting, this project demonstrates the potential for 5G networks to enable high-quality video streams and real-time data processing, which could have applications in pharmaceutical manufacturing and quality control.
- In May 2023, NBN Co announced the completion of its network upgrade to enable up to 10 Gbps wholesale download speeds for enterprise customers. This enhanced connectivity could benefit pharmaceutical companies by supporting advanced manufacturing processes and data-intensive applications.
- In March 2023, Vodafone NZ (now operating under the One NZ brand) launched a 5G network expansion project to cover 90% of New Zealand's population by the end of 2024. This improved connectivity could support the adoption of advanced technologies in various industries, including pharmaceutical manufacturing.
Market Concentration and Characteristics
The Australia and New Zealand Dark Fiber Network Market is moderately concentrated, with a few key players dominating the landscape, including Telstra Corporation Limited, Optus, Vocus Group Limited, and Spark New Zealand Limited. These companies leverage their extensive network infrastructures and established market positions to maintain a competitive edge. The market is characterized by high entry barriers due to the significant capital investment required for network deployment and the complex regulatory environment. Despite the presence of a few dominant players, there is room for growth and competition, particularly as demand for high-speed connectivity and the adoption of 5G technology continue to rise. The market's characteristics include a focus on scalability, reliability, and security, with an increasing trend towards private and hybrid dark fiber networks tailored to the needs of enterprises across various industries.
Report Coverage
The research report offers an in-depth analysis based on Type, Application, End User, Network Type, Material and Region. It details leading market players, providing an overview of their business, product offerings, investments, revenue streams, and key applications. Additionally, the report includes insights into the competitive environment, SWOT analysis, current market trends, as well as the primary drivers and constraints. Furthermore, it discusses various factors that have driven market expansion in recent years. The report also explores market dynamics, regulatory scenarios, and technological advancements that are shaping the industry. It assesses the impact of external factors and global economic changes on market growth. Lastly, it provides strategic recommendations for new entrants and established companies to navigate the complexities of the market.
Future Outlook
- Investments in dark fiber infrastructure are expected to accelerate, driven by the rising demand for high-speed connectivity across urban and rural regions.
- The rollout of 5G networks will further boost the demand for dark fiber, as telecom operators seek to enhance network capacity and coverage to support next-generation services.
- As more data centers are established, the need for secure, high-capacity dark fiber links will grow, facilitating seamless data transmission and redundancy.
- Smart city initiatives in both countries will increasingly rely on dark fiber networks to support the vast array of connected devices and systems essential for urban digitalization.
- The growing adoption of IoT devices and edge computing will drive demand for low-latency dark fiber networks to ensure efficient data processing and transmission.
- As more players enter the dark fiber market, competition will intensify, leading to improved service offerings, innovative solutions, and competitive pricing.
- Continued government support and favorable policies will encourage the expansion of dark fiber networks, particularly in underserved and remote areas.
- Sustainability concerns will push the development of energy-efficient dark fiber networks, reducing environmental impact while maintaining high performance.
- Strategic collaborations between telecom operators, data center providers, and tech companies will drive market growth, ensuring robust and expansive network coverage.
- With increasing cyber threats, there will be a stronger focus on enhancing the security of dark fiber networks, making them more resilient to attacks and data breaches.
Request a Free Sample
Fill in your details and we'll send you a free sample report.
- Sample data tables & charts
- Research methodology
Need a Custom Version of This Report?
Tailor the scope, geography, or segments to your exact requirements.
- Custom geography or segment scope
- Direct access to our analyst team
Frequently Asked Questions
What is the projected growth of the Australia and New Zealand Dark Fiber Network Market?
What factors are driving the growth of the dark fiber network market in these regions?
How are government initiatives influencing the dark fiber network market?
Which areas in Australia and New Zealand are seeing the most investment in dark fiber networks?
Who are the key players in the Australia and New Zealand Dark Fiber Network Market?
Table of Content
Chapter 1. Report Introduction
- 1.1 Report Description & Purpose
- 1.1.1 Report Title & Market Definition
- 1.1.2 Unique Selling Propositions (USP) & Key Differentiators
- 1.1.3 Value Proposition for Stakeholders
- 1.2 Research Objectives
- 1.2.1 Market Sizing Objectives (Volume & Revenue)
- 1.2.2 Segmentation Objectives
- 1.2.3 Competitive Intelligence Objectives
- 1.2.4 Forecast & Scenario Objectives
- 1.3 Report Scope
- 1.3.1 Australia and New Zealand Dark Fiber Network Scope – Types & Subtypes Covered
- 1.3.2 Geographic Scope – Regions & Countries Covered
- 1.3.3 Historical Period, Base Year & Forecast Period (2023; forecast to 2032)
- 1.3.4 Inclusions & Exclusions
- 1.4 HS Code & Classification Framework
- 1.5 Currency, Units & Pricing Basis
- 1.6 Target Stakeholders
- 1.7 Limitations & Assumptions
Chapter 2. Executive Summary
- 2.1 Global Australia and New Zealand Dark Fiber Network Market Snapshot
- 2.1.1 Market Size – Historical (2023) & Forecast (2023-2032) (2023: USD 47.00 million → 2032: USD 146.18 million)
- 2.1.2 Volume & Revenue – Global Totals
- 2.1.3 Key Market Highlights – Top Five Facts
- 2.2 Australia and New Zealand Dark Fiber Network Market Segmentation Snapshot
- 2.2.1 Market Split by Region – 2023 vs. 2032
- 2.3 Competitive Snapshot
- 2.3.1 Top 10 Players by Revenue Share – 2023
- 2.3.2 Top 10 Players by Volume Share – 2023
- 2.3.3 Recent Strategic Developments (18-Month Summary)
- 2.4 Key Investment Highlights & Strategic Conclusions
Chapter 3. Australia and New Zealand Dark Fiber Network Market Dynamics & Industry Analysis
- 3.1 Market Overview & Context
- 3.1.1 Australia and New Zealand Dark Fiber Network Market Position in the Broader Automotive Value Chain
- 3.1.2 OEM vs. Replacement Market Dynamics
- 3.1.3 Market Maturity & Development Stage by Region
- 3.2 Australia and New Zealand Dark Fiber Network Market Drivers
- 3.3 Australia and New Zealand Dark Fiber Network Market Restraints & Challenges
- 3.4 Australia and New Zealand Dark Fiber Network Market Opportunities
- 3.5 Porter's Five Forces Analysis
- 3.5.1 Threat of New Entrants
- 3.5.2 Bargaining Power of Suppliers
- 3.5.3 Bargaining Power of Buyers
- 3.5.4 Threat of Substitutes
- 3.5.5 Competitive Rivalry – Intensity Assessment
- 3.6 Australia and New Zealand Dark Fiber Network Value Chain Analysis
- 3.6.1 Upstream – Raw Material/Input Suppliers
- 3.6.1.1 Raw Material/Input 1
- 3.6.1.2 Raw Material/Input 2
- 3.6.1.3 Raw Material/Input 3
- 3.6.2 Midstream – Production/Manufacturing/Service Delivery
- 3.6.2.1 Production/Process Overview
- 3.6.2.2 Key Facility Locations & Capacity by Manufacturer
- 3.6.3 Downstream – Distribution & End Consumer
- 3.6.3.1 Primary Channel – B2B/OEM
- 3.6.3.2 Secondary Channels – Dealer, Retail, Online, Direct
- 3.6.4 Value Chain Profitability Analysis
- 3.6.1 Upstream – Raw Material/Input Suppliers
- 3.7 PESTEL Analysis
- 3.7.1 Political Factors
- 3.7.2 Economic Factors
- 3.7.3 Social Factors
- 3.7.4 Technological Factors
- 3.7.5 Environmental Factors
- 3.7.6 Legal Factors
- 3.8 Australia and New Zealand Dark Fiber Network Supply Chain Analysis
- 3.8.1 Raw Material/Input Supply Risk Assessment
- 3.8.2 Manufacturing Concentration Risk (Geographic Exposure)
- 3.8.3 Trade Disruption Impact Analysis
- 3.9 Regulatory & Policy Landscape
Note: The regulatory and policy landscape section covers regulations based on their applicability to the market, Australia and New Zealand Dark Fiber Network category, geography, and scope of the study. Only regulatory frameworks with a material impact on operations, compliance, trade, sustainability, or market access are analyzed in detail.
Chapter 4. Key Investment Pockets & Opportunity Analysis
- 4.1 Australia and New Zealand Dark Fiber Network Market Attractiveness Analysis
- 4.1.1 By Region – Investment Attractiveness Matrix (Volume × CAGR)
- 4.2 Absolute Revenue Growth Opportunity
- 4.2.1 By Region – Absolute USD Growth Through 2032
- 4.3 Incremental Volume Opportunity
- 4.3.1 By Region – Incremental Volume Through 2032
- 4.3.2 Segment – Incremental Volume
- 4.4 Emerging Submarket Opportunity Deep Dive (Subject to Applicability)
- 4.5 Emerging Market Opportunity Scorecards
- 4.5.1 United States
- 4.5.2 Europe
- 4.5.3 Asia
- 4.5.4 Middle East & Africa
Note: Emerging Market Opportunity Scorecards will be included based on relevance and strategic importance. Regions listed are indicative and may vary depending on data availability and market dynamics.
Chapter 5. Australia and New Zealand Dark Fiber Network Import-Export Analysis & Trade Flows
- 5.1 Global Trade Overview
- 5.1.1 Global Export Value by Country (2023)
- 5.1.2 Global Export Volume by Country (2023)
- 5.1.3 Global Import Value by Country (2023)
- 5.1.4 Global Import Volume by Country (2023)
- 5.1.5 Net Trade Balance by Country (2023)
- 5.2 Export Analysis – Segment
- 5.2.1 Type 1 (HS Code)
- 5.2.2 Type 2 (HS Code)
- 5.2.3 Type 3 (HS Code)
- 5.2.4 Type 4 (HS Code)
- 5.2.5 Type 5 (HS Code)
- 5.3 Import Analysis – Segment
- 5.3.1 Type 1 (HS Code)
- 5.3.2 Type 2 (HS Code)
- 5.3.3 Type 3 (HS Code)
- 5.3.4 Type 4 (HS Code)
- 5.3.5 Type 5 (HS Code)
- 5.4 Average Unit Trade Prices
- 5.4.1 Average Export Price – Segment & Country
- 5.4.2 Average Import Price – Segment & Source Country
- 5.4.3 Price Trends (2023)
- 5.5 Key Trade Route Analysis
- 5.5.1 Trade Route 1
- 5.5.2 Trade Route 2
- 5.5.3 Trade Route 3
- 5.5.4 Trade Route 4
- 5.5.5 Trade Route 5
- 5.6 Trade Policy Impact Assessment
- 5.6.1 US Anti-Dumping & Section 301 Tariffs
- 5.6.2 EU Customs Union Impact
- 5.6.3 Major Free Trade Agreements
- 5.6.4 USMCA Rules of Origin
Note: Trade policy analysis will be included only where relevant to the Australia and New Zealand Dark Fiber Network market.
Chapter 6. Competitive Landscape & Company Benchmarking
- 6.1 Australia and New Zealand Dark Fiber Network Market Concentration & Structure
- 6.1.1 Herfindahl-Hirschman Index (HHI) – vs. 2023
- 6.1.2 Tier 1, Tier 2 & Tier 3 Market Structure
- 6.1.3 Global, Regional & Local Player Dynamics
- 6.2 Australia and New Zealand Dark Fiber Network Market Share Analysis – 2023
- 6.2.1 Global Revenue Share by Company
- 6.2.2 Global Volume Share by Company
- 6.2.3 Regional Revenue Share
- 6.2.4 Market Share Evolution ( vs. 2023)
- 6.2.5 OEM Segment Share by Company
- 6.2.6 Replacement Segment Share by Company
- 6.3 Production/Delivery Capacity & Facility Analysis
- 6.3.1 Global Installed Capacity
- 6.3.2 Capacity Utilization Rates
- 6.3.3 Production/Output Volume
- 6.3.4 Facility Locations & Capacity Map
- 6.3.5 Planned Capacity Additions
- 6.4 Australia and New Zealand Dark Fiber Network Competitive Benchmarking Matrix
- 6.4.1 Revenue, Volume, CAGR & Profitability Comparison
- 6.4.2 Channel Revenue Mix
- 6.4.3 Geographic Revenue Exposure
- 6.4.4 R&D Intensity
- 6.4.5 Sustainability Maturity
- 6.5 Strategic Developments in Australia and New Zealand Dark Fiber Network (Last 24 Months)
- 6.5.1 Mergers, Acquisitions & Divestments
- 6.5.2 New Australia and New Zealand Dark Fiber Network Launches
- 6.5.3 Facility Expansions
- 6.5.4 Strategic Alliances, Joint Ventures & Partnerships
- 6.5.5 Distribution Expansion & Market Entry
- 6.5.6 Sustainability & ESG Initiatives
- 6.6 Competitive Strategy Mapping
- 6.6.1 Leader, Challenger, Follower & Niche Classification
- 6.6.2 Pricing Strategy Comparison
- 6.6.3 Channel Strategy Matrix
Note: Strategic developments are included based on their materiality and the availability of reliable information.
Chapter 7. Global Australia and New Zealand Dark Fiber Network Market – By Distribution Channel
- 7.1 Segment Overview
- 7.1.1 Volume & Revenue Split by Channel (2023 & 2032)
- 7.1.2 Channel Mix Evolution (2023-2032)
Chapter 8. Regional Market Analysis – Global Overview
- 8.1 Global Regional Overview
- 8.1.1 Regional Volume Share
- 8.1.2 Regional Revenue Share
- 8.1.3 Regional Volume by Region
- 8.1.4 Regional Revenue by Region
- 8.1.5 Regional Forecast Through 2032
- 8.2 Cross-Regional Segment Analysis
- 8.2.1 By Distribution Channel
- 8.2.2 By Brand/Price Tier
Chapter 9. North America Australia and New Zealand Dark Fiber Network Market
- 9.1 United States
- 9.2 Canada
- 9.3 Mexico
Chapter 10. Europe Australia and New Zealand Dark Fiber Network Market
- 10.1 Germany
- 10.2 France
- 10.3 Italy
- 10.4 United Kingdom
- 10.5 Spain
- 10.6 Poland
- 10.7 Russia
- 10.8 Netherlands
- 10.9 Belgium
- 10.10 Sweden
- 10.11 Denmark
- 10.12 Norway
- 10.13 Rest of Europe
Chapter 11. Asia Pacific Australia and New Zealand Dark Fiber Network Market
- 11.1 China
- 11.2 India
- 11.3 Japan
- 11.4 South Korea
- 11.5 Thailand
- 11.6 Indonesia
- 11.7 Vietnam
- 11.8 Malaysia
- 11.9 Australia
- 11.10 Rest of Asia Pacific
Chapter 12. Latin America Australia and New Zealand Dark Fiber Network Market
- 12.1 Brazil
- 12.2 Argentina
- 12.3 Colombia
- 12.4 Chile
- 12.5 Rest of Latin America
Chapter 13. Middle East Australia and New Zealand Dark Fiber Network Market
- 13.1 Saudi Arabia
- 13.2 United Arab Emirates
- 13.3 Turkey
- 13.4 Israel
- 13.5 Iran
- 13.6 Rest of the Middle East
Chapter 14. Africa Australia and New Zealand Dark Fiber Network Market
- 14.1 South Africa
- 14.2 Egypt
- 14.3 Nigeria
- 14.4 Morocco
- 14.5 Rest of Africa
Chapter 15. Australia and New Zealand Dark Fiber Network Company Profiles
- 15.1 [Company 01]
- 15.1.1 Company Overview
- 15.1.2 Key Management Personnel
- 15.1.3 Products & Services Portfolio
- 15.1.4 Financial Performance
- 15.1.5 Key Market Focus & Geographic Presence
- 15.1.6 Recent Developments & Strategic Initiatives
Note: The company profile list is preliminary and may change based on research findings, market developments, data availability, and client requirements.
Chapter 16. Appendices
- Appendix A – List of Abbreviations & Acronyms
- Appendix B – Industry Classification Code Reference – Full Series
- Appendix C – Production & Capacity Data Tables
- Appendix D – End-Use & Demand Base Tables
- Appendix E – Consumption & Replacement Rate Assumptions
- Appendix F – ASP Reference Tables
- Appendix G – Manufacturing & Facility Database
- Appendix H – Import-Export Data Tables
- Appendix I – Regulatory Summary Tables
- Appendix J – Primary Research Participant List (Anonymized)
- Appendix K – Primary Research Questionnaire Framework
- Appendix L – Data Sources & Bibliography
- Appendix M – Market Size Divergence & Source Comparison
Chapter 17. Research Methodology
- 17.1 Research Framework & Philosophy
- 17.2 Secondary Research – Sources, Hierarchy & Data Extraction
- 17.3 Data Modeling – Bottom-Up & Top-Down Market Sizing
- 17.4 Primary Research – Stakeholder Framework, LOI & Sample Sizes
- 17.5 Forecast Methodology – Regression, Scenario & Sensitivity Analysis
- 17.6 Quality Control – Four-Layer Validation Framework
- 17.7 Limitations & Standard Assumptions
- 17.8 Disclaimer
