
Driving Apparel Market Overview:
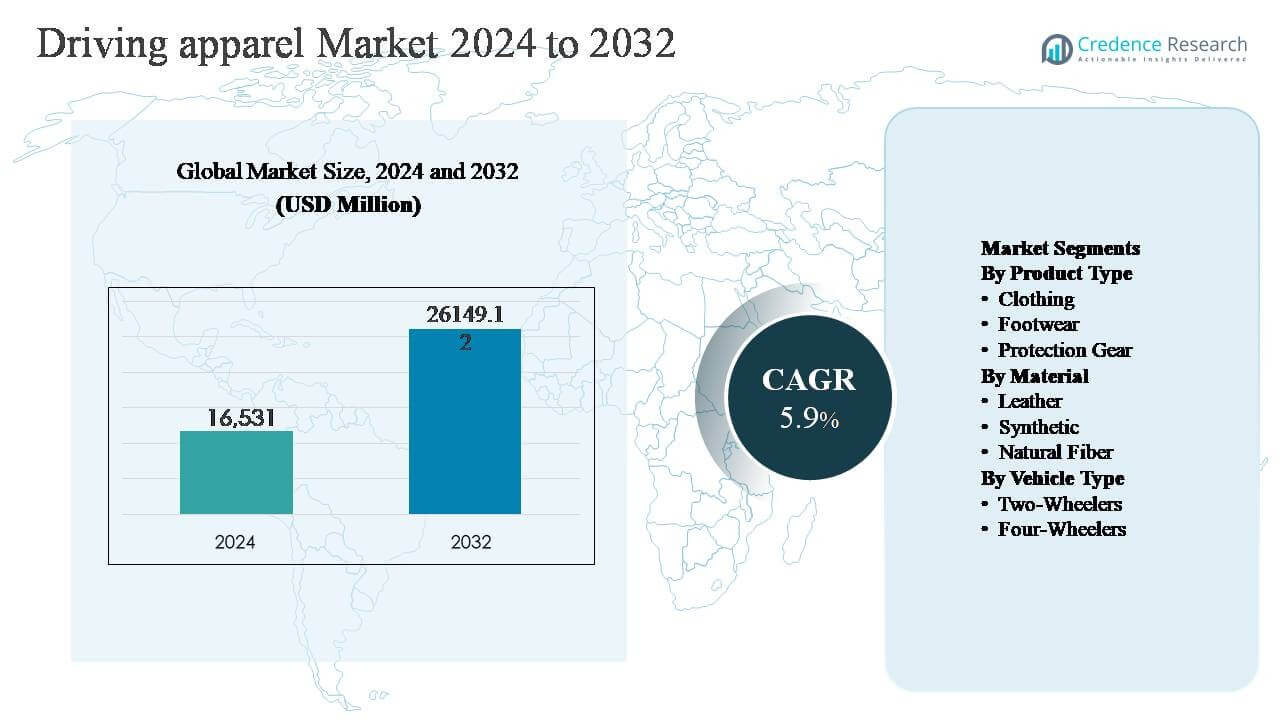
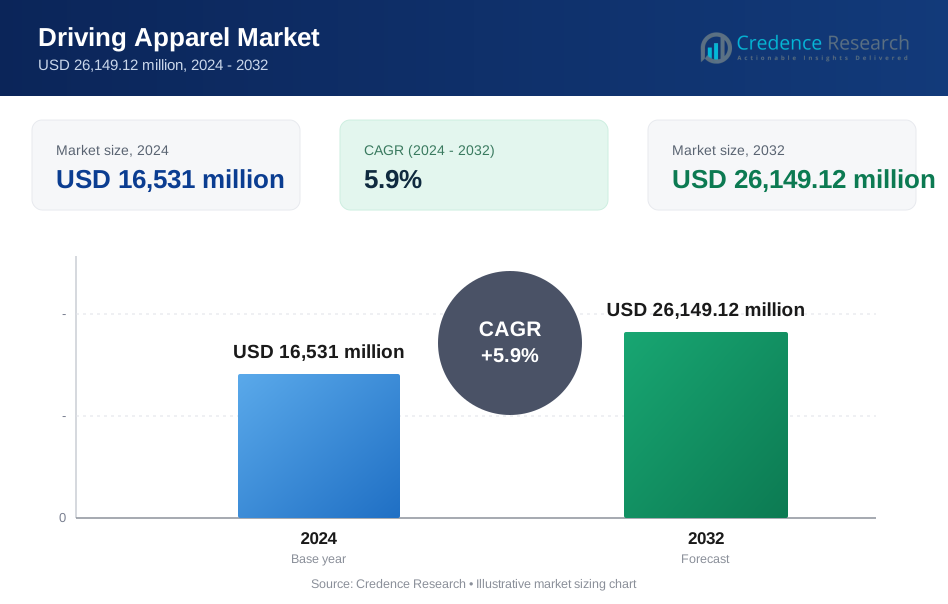
The global driving apparel market was valued at USD 16,531 million in 2024 and is projected to reach USD 26,149.12 million by 2032, expanding at a compound annual growth rate (CAGR) of 5.9% during the forecast period.
| REPORT ATTRIBUTE | DETAILS |
|---|---|
| Historical Period | 2020-2023 |
| Base Year | 2024 |
| Forecast Period | 2025-2032 |
| Driving Apparel Market Size 2024 | USD 16,531 million |
| Driving Apparel Market , CAGR | 5.9% |
| Driving Apparel Market Size 2032 | USD 26,149.12 million |
Driving Apparel Market Insights
- Market growth is driven by rising road safety awareness, increasing enforcement of protective gear regulations for two-wheelers, and growing participation in motorsports and recreational driving, with clothing emerging as the dominant segment holding around 46-48% share due to high replacement rates and broad usage.
- Key trends include premiumization of driving jackets, gloves, and footwear, integration of advanced synthetic and hybrid materials, and strong growth of e-commerce channels, while leather remains the leading material segment with about 50-55% share.
- The competitive landscape is marked by global sportswear brands and specialized safety gear manufacturers competing on certification standards, material innovation, lifestyle positioning, and direct-to-consumer strategies.
- Regionally, Asia Pacific leads with nearly 33% share, driven by high two-wheeler usage, followed by North America at ~29% and Europe at ~27%, supported by premium adoption and motorsports culture.
Driving Apparel Market Segmentation Analysis:
By Product Type
By product type, clothing represents the dominant sub-segment in the driving apparel market, accounting for an estimated 45-48% of total market share. This dominance is driven by high demand for driving jackets, suits, gloves, and base layers that combine safety, comfort, and style. Increasing participation in motorsports, touring, and recreational driving has accelerated adoption of performance-oriented clothing with abrasion resistance, thermal regulation, and ergonomic tailoring. Footwear follows, supported by rising interest in specialized driving shoes for pedal control and comfort, while protection gear grows steadily due to regulatory emphasis on safety standards and rising consumer awareness.
- For instance, "Leatt Corporation utilizes 3DF AirFit impact foam, which is CE certified to Level 2 (EN 1621-2) standards for back protection, requiring average transmitted impact forces to remain below 9 kN. Simultaneously, Racing Force S.p.A. (through brands like OMP) produces racing suits homologated to the FIA 8856-2018 standard, which mandates a minimum of 12 seconds of heat transmission protection to prevent second-degree burns."
By Material
By material, leather remains the leading sub-segment, holding approximately 50-55% market share, driven by its superior abrasion resistance, durability, and premium perception. Leather is widely preferred in jackets, suits, gloves, and boots for both professional and enthusiast drivers. Synthetic materials are gaining traction due to advancements in high-performance textiles offering lighter weight, weather resistance, and cost efficiency, particularly in mid-range products. Natural fibers maintain a niche presence, primarily in inner layers and casual driving apparel, supported by growing interest in breathability, comfort, and sustainable material sourcing.
- For instance, Adidas AG has sourced 100% of its cotton from more sustainable sources, a target it successfully maintained through 2024. These sources include organic and recycled cotton, though the vast majority (98.9% as of 2024) is sourced as Better Cotton via a mass-balance system.
By Vehicle Type
By vehicle type, two-wheelers dominate the driving apparel market, accounting for nearly 60-65% of overall demand, driven by higher safety requirements and broader daily usage among motorcyclists. Mandatory protective gear regulations, combined with rising motorcycle ownership in urban and emerging markets, strongly support this segment. Four-wheelers follow, supported by motorsports participation, premium car culture, and recreational driving activities. Growth in the four-wheeler segment is further driven by increasing demand for branded driving gloves, jackets, and footwear that emphasize comfort, control, and lifestyle-oriented performance attributes.
Key Growth Drivers
Rising Emphasis on Road Safety and Protective Regulations
The driving apparel market is strongly driven by increasing awareness of road safety and the gradual tightening of protective gear regulations, particularly for two-wheeler riders. Governments and transport authorities across multiple regions are enforcing helmet, jacket, glove, and footwear standards to reduce accident-related injuries. This regulatory push is complemented by insurance norms and rider education programs that highlight the importance of certified protective apparel. Consumers increasingly perceive driving apparel not as optional accessories but as essential safety equipment. Manufacturers respond by integrating impact-resistant armor, abrasion-tested materials, and ergonomic protection zones, thereby improving product credibility. This heightened safety consciousness significantly supports consistent demand across commuter, touring, and professional riding segments.
- For instance, Racing Force S.p.A. produces FIA-homologated racing suits that deliver a minimum of 12 seconds of heat and flame protection under the current FIA 8856-2018 standard.
Growth in Motorsports, Recreational Riding, and Premium Vehicle Ownership
Expanding participation in motorsports, adventure touring, and recreational driving activities is a major driver for driving apparel demand. Track racing, rally events, and long-distance touring culture have transitioned from niche to mainstream in several markets, encouraging enthusiasts to invest in specialized apparel. Simultaneously, rising ownership of premium motorcycles and performance cars fuels demand for high-quality, brand-driven driving apparel that aligns with lifestyle aspirations. Driving jackets, gloves, footwear, and suits increasingly serve both functional and identity-related purposes. This convergence of performance and lifestyle appeal strengthens repeat purchases and drives premiumization across product categories.
- For instance, Puma SE develops motorsport gloves that are constructed on a pre-curved last to ergonomically fit the fingers in a driving position, featuring external seam construction to enhance steering-wheel grip and comfort for professional racers.
Advancements in Apparel Technology and Material Innovation
Continuous innovation in materials and garment engineering significantly accelerates market growth. Manufacturers are incorporating advanced synthetics, composite reinforcements, breathable membranes, and thermal management layers to enhance comfort and protection. Lightweight armor systems, moisture-wicking liners, and weather-adaptive fabrics improve usability across diverse riding conditions. These innovations expand the addressable consumer base by making driving apparel more comfortable for daily commuting as well as long-duration rides. Technological differentiation also allows brands to introduce tiered product offerings, supporting wider price segmentation and improved market penetration.
Key Trends & Opportunities
Premiumization and Lifestyle-Oriented Product Positioning
A prominent trend in the driving apparel market is the shift toward premium, lifestyle-oriented products that blend safety with aesthetics. Consumers increasingly seek apparel that transitions seamlessly from riding environments to casual settings without compromising protection. This trend creates opportunities for brands to develop minimalist designs, retro-inspired collections, and collaboration-based product lines. Premium leather apparel, branded footwear, and customized gear are gaining traction among urban riders and performance car enthusiasts. This lifestyle integration strengthens brand loyalty and enables higher margins through differentiated design and craftsmanship.
- For instance, VF Corporation, through its premium outdoor and performance brands like The North Face and Timberland, integrates seam constructions using advanced manufacturing techniques and adheres to rigorous internal and industry-recognized testing standards to ensure durability and long-term wearability.
Expansion of E-Commerce and Direct-to-Consumer Channels
The rapid expansion of digital retail platforms presents a major opportunity for driving apparel manufacturers. Online channels allow brands to reach geographically dispersed consumers, showcase detailed safety certifications, and offer size customization tools. Direct-to-consumer models improve brand control, data-driven personalization, and customer engagement. Digital platforms also support limited-edition launches and influencer-led marketing strategies, particularly among younger consumers. As online purchasing confidence increases for technical apparel, e-commerce continues to emerge as a critical growth enabler for both established and emerging brands.
- For instance, "ASICS India Pvt. Ltd. utilizes its FOOT ID™ digital fitting system, which employs a 3D foot scanning device featuring 4 lasers and 8 cameras to capture detailed anatomical data, including foot length, ball girth, and arch height, to recommend precise footwear sizing for performance applications."
Key Challenges
High Product Costs and Price Sensitivity in Emerging Markets
One of the key challenges facing the driving apparel market is the relatively high cost of certified protective gear. Premium materials, safety testing, and compliance with international standards significantly increase production costs. In price-sensitive and emerging markets, this limits adoption beyond essential items such as helmets. Consumers often opt for low-cost, non-certified alternatives, impacting the penetration of high-quality apparel. Manufacturers must balance safety, affordability, and performance while maintaining margins, which remains a persistent challenge in mass-market expansion.
Counterfeit Products and Lack of Standardization
The presence of counterfeit and substandard driving apparel poses a significant challenge to market credibility. Uncertified products often imitate premium designs without meeting safety requirements, misleading consumers and undermining trust in branded offerings. Additionally, variations in safety standards across regions create complexity for manufacturers operating globally. Lack of uniform enforcement allows inferior products to circulate, particularly through informal retail channels. Addressing this challenge requires stronger regulatory enforcement, consumer education, and clear certification labeling to protect both end-users and brand integrity.
Regional Analysis
North America
North America accounts for approximately 28-30% of the global driving apparel market, driven by strong motorsports culture, high motorcycle ownership, and premium car enthusiasm. The region benefits from strict safety awareness, well-established riding communities, and high consumer spending on certified protective gear. Demand is particularly strong for premium leather jackets, performance gloves, and specialized footwear used in touring and track-based activities. E-commerce penetration and direct-to-consumer strategies further enhance accessibility. The presence of established global brands and frequent motorsport events continues to support stable demand across both two-wheeler and four-wheeler driving apparel segments.
Europe
Europe represents around 26-28% of the global market, supported by stringent safety regulations, mature automotive culture, and strong adoption of certified riding gear. Countries such as Germany, Italy, France, and the UK drive demand through motorsports participation, touring culture, and premium vehicle ownership. European consumers emphasize quality, certification standards, and material performance, favoring leather and advanced synthetic apparel. Sustainability trends also influence material choices and product design. The region benefits from established manufacturing hubs and brand heritage, which strengthen export activity and reinforce Europe’s position as a key innovation-driven market.
Asia Pacific
Asia Pacific dominates the driving apparel market with a share of approximately 32-34%, driven by high two-wheeler population, rapid urbanization, and rising disposable incomes. Countries such as India, China, Japan, and Southeast Asian nations contribute significantly due to daily motorcycle commuting and growing recreational riding culture. Increasing enforcement of safety norms and rising awareness of protective apparel accelerate adoption beyond helmets to jackets, gloves, and footwear. Expanding middle-class consumers and strong local manufacturing capabilities support volume growth, while premium segments are gaining traction in developed markets like Japan and Australia.
Latin America
Latin America holds an estimated 6-7% market share, supported by growing motorcycle usage for commuting and delivery services. Brazil, Mexico, and Colombia are key contributors, driven by urban mobility needs and rising safety awareness. Demand is primarily concentrated in functional and mid-priced driving apparel, particularly protective clothing and footwear for two-wheeler riders. While premium adoption remains limited, gradual regulatory improvements and expanding organized retail channels support market development. Increasing participation in recreational riding and motorsport events further enhances long-term growth prospects across the region.
Middle East & Africa
The Middle East & Africa region accounts for approximately 4-5% of the global driving apparel market, driven by niche demand in premium automotive culture and expanding motorcycle adoption in select countries. In the Middle East, high-income consumers support demand for premium driving gloves, jackets, and footwear aligned with luxury vehicle ownership. In Africa, growth is primarily volume-driven, supported by rising two-wheeler usage for mobility and commercial purposes. Limited regulatory enforcement and price sensitivity restrain premium penetration, but improving safety awareness and expanding urbanization present gradual growth opportunities.
Driving Apparel Market Segmentations:
By Product Type
- Clothing
- Footwear
- Protection Gear
By Material
- Leather
- Synthetic
- Natural Fiber
By Vehicle Type
- Two-Wheelers
- Four-Wheelers
By Geography
- North America
- U.S.
- Canada
- Mexico
- Europe
- Germany
- France
- U.K.
- Italy
- Spain
- Rest of Europe
- Asia Pacific
- China
- Japan
- India
- South Korea
- South-east Asia
- Rest of Asia Pacific
- Latin America
- Brazil
- Argentina
- Rest of Latin America
- Middle East & Africa
- GCC Countries
- South Africa
- Rest of the Middle East and Africa
Competitive Landscape
The competitive landscape of the driving apparel market is characterized by the presence of established global brands and specialized manufacturers competing through product innovation, safety compliance, and brand positioning. Leading players focus on expanding their portfolios across driving jackets, suits, gloves, footwear, and protection gear to address both professional and recreational users. Competition is increasingly shaped by investments in advanced materials, ergonomic design, and certified safety technologies that enhance impact resistance and rider comfort. Premium brands emphasize leather craftsmanship, motorsport heritage, and lifestyle appeal, while mid-range players compete on affordability and functional performance. Strategic partnerships with motorsport teams, driving schools, and automotive brands strengthen visibility and credibility. Additionally, companies are expanding direct-to-consumer and e-commerce channels to improve margins and customer engagement. Regional manufacturers maintain strong positions in price-sensitive markets, intensifying competition and driving continuous innovation across the industry.
Key Player Analysis
- Adidas AG
- Nike, Inc.
- Puma SE
- VF Corporation
- ASICS India Pvt. Ltd.
- SCOTT Sports SA
- Leatt Corporation
- Racing Force S.p.A
- STUDDS Accessories Ltd.
Recent Developments
- In November 2025, STUDDS Accessories Ltd. reported strong operational and strategic developments marked by its Initial Public Offering (IPO) listing and expansion initiatives. The company successfully launched its IPO which opened for subscription and later listed on stock exchanges, representing a major milestone in its corporate growth strategy. Studds also progressed its capacity expansion plan with the first phase adding 1.5 million units of two-wheeler helmets and boxes capacity expected to be operational by Q1 FY27, supporting enhanced fulfillment capability for domestic and export markets.
- In August 2024, Leatt advanced its protective apparel offerings by launching next-generation riding gear integrating low-profile 3DF impact protection and improved ergonomic paneling, designed to deliver certified protection while maintaining flexibility and comfort for extended on-road and off-road driving use.
Report Coverage
The research report offers an in-depth analysis based on Product type, Material, Vehicle type and Geography. It details leading market players, providing an overview of their business, product offerings, investments, revenue streams, and key applications. Additionally, the report includes insights into the competitive environment, SWOT analysis, current market trends, as well as the primary drivers and constraints. Furthermore, it discusses various factors that have driven market expansion in recent years. The report also explores market dynamics, regulatory scenarios, and technological advancements that are shaping the industry. It assesses the impact of external factors and global economic changes on market growth. Lastly, it provides strategic recommendations for new entrants and established companies to navigate the complexities of the market.
Request a Free Sample
Fill in your details and we'll send you a free sample report.
- Sample data tables & charts
- Research methodology
Need a Custom Version of This Report?
Tailor the scope, geography, or segments to your exact requirements.
- Custom geography or segment scope
- Direct access to our analyst team
Frequently Asked Questions
What is the current market size for driving apparel, and what is its projected size in 2032?
At what Compound Annual Growth Rate is the driving apparel market projected to grow between 2024 and 2032?
Which driving apparel segment held the largest share in 2024?
What are the primary factors fueling the growth of the driving apparel market?
Who are the leading companies in the driving apparel market?
Which region commanded the largest share of the driving apparel market in 2024?
Table of Content
Chapter 1. Report Introduction
- 1.1 Report Description & Purpose
- 1.1.1 Report Title & Market Definition
- 1.1.2 Unique Selling Propositions (USP) & Key Differentiators
- 1.1.3 Value Proposition for Stakeholders
- 1.2 Research Objectives
- 1.2.1 Market Sizing Objectives (Volume & Revenue)
- 1.2.2 Segmentation Objectives
- 1.2.3 Competitive Intelligence Objectives
- 1.2.4 Forecast & Scenario Objectives
- 1.3 Report Scope
- 1.3.1 Driving Apparel Scope – Types & Subtypes Covered
- 1.3.2 Geographic Scope – Regions & Countries Covered
- 1.3.3 Historical Period, Base Year & Forecast Period (2024; forecast to 2032)
- 1.3.4 Inclusions & Exclusions
- 1.4 HS Code & Classification Framework
- 1.5 Currency, Units & Pricing Basis
- 1.6 Target Stakeholders
- 1.7 Limitations & Assumptions
Chapter 2. Executive Summary
- 2.1 Global Driving Apparel Market Snapshot
- 2.1.1 Market Size – Historical (2024) & Forecast (2024-2032) (2024: USD 16,531 million → 2032: USD 26,149.12 million)
- 2.1.2 Volume & Revenue – Global Totals
- 2.1.3 Key Market Highlights – Top Five Facts
- 2.2 Driving Apparel Market Segmentation Snapshot
- 2.2.1 Market Split by Region – 2024 vs. 2032
- 2.3 Competitive Snapshot
- 2.3.1 Top 10 Players by Revenue Share – 2024
- 2.3.2 Top 10 Players by Volume Share – 2024
- 2.3.3 Recent Strategic Developments (18-Month Summary)
- 2.4 Key Investment Highlights & Strategic Conclusions
Chapter 3. Driving Apparel Market Dynamics & Industry Analysis
- 3.1 Market Overview & Context
- 3.1.1 Driving Apparel Market Position in the Broader Automotive Value Chain
- 3.1.2 OEM vs. Replacement Market Dynamics
- 3.1.3 Market Maturity & Development Stage by Region
- 3.2 Driving Apparel Market Drivers
- 3.3 Driving Apparel Market Restraints & Challenges
- 3.4 Driving Apparel Market Opportunities
- 3.5 Porter's Five Forces Analysis
- 3.5.1 Threat of New Entrants
- 3.5.2 Bargaining Power of Suppliers
- 3.5.3 Bargaining Power of Buyers
- 3.5.4 Threat of Substitutes
- 3.5.5 Competitive Rivalry – Intensity Assessment
- 3.6 Driving Apparel Value Chain Analysis
- 3.6.1 Upstream – Raw Material/Input Suppliers
- 3.6.1.1 Raw Material/Input 1
- 3.6.1.2 Raw Material/Input 2
- 3.6.1.3 Raw Material/Input 3
- 3.6.2 Midstream – Production/Manufacturing/Service Delivery
- 3.6.2.1 Production/Process Overview
- 3.6.2.2 Key Facility Locations & Capacity by Manufacturer
- 3.6.3 Downstream – Distribution & End Consumer
- 3.6.3.1 Primary Channel – B2B/OEM
- 3.6.3.2 Secondary Channels – Dealer, Retail, Online, Direct
- 3.6.4 Value Chain Profitability Analysis
- 3.6.1 Upstream – Raw Material/Input Suppliers
- 3.7 PESTEL Analysis
- 3.7.1 Political Factors
- 3.7.2 Economic Factors
- 3.7.3 Social Factors
- 3.7.4 Technological Factors
- 3.7.5 Environmental Factors
- 3.7.6 Legal Factors
- 3.8 Driving Apparel Supply Chain Analysis
- 3.8.1 Raw Material/Input Supply Risk Assessment
- 3.8.2 Manufacturing Concentration Risk (Geographic Exposure)
- 3.8.3 Trade Disruption Impact Analysis
- 3.9 Regulatory & Policy Landscape
Note: The regulatory and policy landscape section covers regulations based on their applicability to the market, Driving Apparel category, geography, and scope of the study. Only regulatory frameworks with a material impact on operations, compliance, trade, sustainability, or market access are analyzed in detail.
Chapter 4. Key Investment Pockets & Opportunity Analysis
- 4.1 Driving Apparel Market Attractiveness Analysis
- 4.1.1 By Region – Investment Attractiveness Matrix (Volume × CAGR)
- 4.2 Absolute Revenue Growth Opportunity
- 4.2.1 By Region – Absolute USD Growth Through 2032
- 4.3 Incremental Volume Opportunity
- 4.3.1 By Region – Incremental Volume Through 2032
- 4.3.2 Segment – Incremental Volume
- 4.4 Emerging Submarket Opportunity Deep Dive (Subject to Applicability)
- 4.5 Emerging Market Opportunity Scorecards
- 4.5.1 United States
- 4.5.2 Europe
- 4.5.3 Asia
- 4.5.4 Middle East & Africa
Note: Emerging Market Opportunity Scorecards will be included based on relevance and strategic importance. Regions listed are indicative and may vary depending on data availability and market dynamics.
Chapter 5. Driving Apparel Import-Export Analysis & Trade Flows
- 5.1 Global Trade Overview
- 5.1.1 Global Export Value by Country (2024)
- 5.1.2 Global Export Volume by Country (2024)
- 5.1.3 Global Import Value by Country (2024)
- 5.1.4 Global Import Volume by Country (2024)
- 5.1.5 Net Trade Balance by Country (2024)
- 5.2 Export Analysis – Segment
- 5.2.1 Type 1 (HS Code)
- 5.2.2 Type 2 (HS Code)
- 5.2.3 Type 3 (HS Code)
- 5.2.4 Type 4 (HS Code)
- 5.2.5 Type 5 (HS Code)
- 5.3 Import Analysis – Segment
- 5.3.1 Type 1 (HS Code)
- 5.3.2 Type 2 (HS Code)
- 5.3.3 Type 3 (HS Code)
- 5.3.4 Type 4 (HS Code)
- 5.3.5 Type 5 (HS Code)
- 5.4 Average Unit Trade Prices
- 5.4.1 Average Export Price – Segment & Country
- 5.4.2 Average Import Price – Segment & Source Country
- 5.4.3 Price Trends (2024)
- 5.5 Key Trade Route Analysis
- 5.5.1 Trade Route 1
- 5.5.2 Trade Route 2
- 5.5.3 Trade Route 3
- 5.5.4 Trade Route 4
- 5.5.5 Trade Route 5
- 5.6 Trade Policy Impact Assessment
- 5.6.1 US Anti-Dumping & Section 301 Tariffs
- 5.6.2 EU Customs Union Impact
- 5.6.3 Major Free Trade Agreements
- 5.6.4 USMCA Rules of Origin
Note: Trade policy analysis will be included only where relevant to the Driving Apparel market.
Chapter 6. Competitive Landscape & Company Benchmarking
- 6.1 Driving Apparel Market Concentration & Structure
- 6.1.1 Herfindahl-Hirschman Index (HHI) – vs. 2024
- 6.1.2 Tier 1, Tier 2 & Tier 3 Market Structure
- 6.1.3 Global, Regional & Local Player Dynamics
- 6.2 Driving Apparel Market Share Analysis – 2024
- 6.2.1 Global Revenue Share by Company
- 6.2.2 Global Volume Share by Company
- 6.2.3 Regional Revenue Share
- 6.2.4 Market Share Evolution ( vs. 2024)
- 6.2.5 OEM Segment Share by Company
- 6.2.6 Replacement Segment Share by Company
- 6.3 Production/Delivery Capacity & Facility Analysis
- 6.3.1 Global Installed Capacity
- 6.3.2 Capacity Utilization Rates
- 6.3.3 Production/Output Volume
- 6.3.4 Facility Locations & Capacity Map
- 6.3.5 Planned Capacity Additions
- 6.4 Driving Apparel Competitive Benchmarking Matrix
- 6.4.1 Revenue, Volume, CAGR & Profitability Comparison
- 6.4.2 Channel Revenue Mix
- 6.4.3 Geographic Revenue Exposure
- 6.4.4 R&D Intensity
- 6.4.5 Sustainability Maturity
- 6.5 Strategic Developments in Driving Apparel (Last 24 Months)
- 6.5.1 Mergers, Acquisitions & Divestments
- 6.5.2 New Driving Apparel Launches
- 6.5.3 Facility Expansions
- 6.5.4 Strategic Alliances, Joint Ventures & Partnerships
- 6.5.5 Distribution Expansion & Market Entry
- 6.5.6 Sustainability & ESG Initiatives
- 6.6 Competitive Strategy Mapping
- 6.6.1 Leader, Challenger, Follower & Niche Classification
- 6.6.2 Pricing Strategy Comparison
- 6.6.3 Channel Strategy Matrix
Note: Strategic developments are included based on their materiality and the availability of reliable information.
Chapter 7. Global Driving Apparel Market – By Distribution Channel
- 7.1 Segment Overview
- 7.1.1 Volume & Revenue Split by Channel (2024 & 2032)
- 7.1.2 Channel Mix Evolution (2024-2032)
Chapter 8. Regional Market Analysis – Global Overview
- 8.1 Global Regional Overview
- 8.1.1 Regional Volume Share
- 8.1.2 Regional Revenue Share
- 8.1.3 Regional Volume by Region
- 8.1.4 Regional Revenue by Region
- 8.1.5 Regional Forecast Through 2032
- 8.2 Cross-Regional Segment Analysis
- 8.2.1 By Distribution Channel
- 8.2.2 By Brand/Price Tier
Chapter 9. North America Driving Apparel Market
- 9.1 United States
- 9.2 Canada
- 9.3 Mexico
Chapter 10. Europe Driving Apparel Market
- 10.1 Germany
- 10.2 France
- 10.3 Italy
- 10.4 United Kingdom
- 10.5 Spain
- 10.6 Poland
- 10.7 Russia
- 10.8 Netherlands
- 10.9 Belgium
- 10.10 Sweden
- 10.11 Denmark
- 10.12 Norway
- 10.13 Rest of Europe
Chapter 11. Asia Pacific Driving Apparel Market
- 11.1 China
- 11.2 India
- 11.3 Japan
- 11.4 South Korea
- 11.5 Thailand
- 11.6 Indonesia
- 11.7 Vietnam
- 11.8 Malaysia
- 11.9 Australia
- 11.10 Rest of Asia Pacific
Chapter 12. Latin America Driving Apparel Market
- 12.1 Brazil
- 12.2 Argentina
- 12.3 Colombia
- 12.4 Chile
- 12.5 Rest of Latin America
Chapter 13. Middle East Driving Apparel Market
- 13.1 Saudi Arabia
- 13.2 United Arab Emirates
- 13.3 Turkey
- 13.4 Israel
- 13.5 Iran
- 13.6 Rest of the Middle East
Chapter 14. Africa Driving Apparel Market
- 14.1 South Africa
- 14.2 Egypt
- 14.3 Nigeria
- 14.4 Morocco
- 14.5 Rest of Africa
Chapter 15. Driving Apparel Company Profiles
- 15.1 [Company 01]
- 15.1.1 Company Overview
- 15.1.2 Key Management Personnel
- 15.1.3 Products & Services Portfolio
- 15.1.4 Financial Performance
- 15.1.5 Key Market Focus & Geographic Presence
- 15.1.6 Recent Developments & Strategic Initiatives
Note: The company profile list is preliminary and may change based on research findings, market developments, data availability, and client requirements.
Chapter 16. Appendices
- Appendix A – List of Abbreviations & Acronyms
- Appendix B – Industry Classification Code Reference – Full Series
- Appendix C – Production & Capacity Data Tables
- Appendix D – End-Use & Demand Base Tables
- Appendix E – Consumption & Replacement Rate Assumptions
- Appendix F – ASP Reference Tables
- Appendix G – Manufacturing & Facility Database
- Appendix H – Import-Export Data Tables
- Appendix I – Regulatory Summary Tables
- Appendix J – Primary Research Participant List (Anonymized)
- Appendix K – Primary Research Questionnaire Framework
- Appendix L – Data Sources & Bibliography
- Appendix M – Market Size Divergence & Source Comparison
Chapter 17. Research Methodology
- 17.1 Research Framework & Philosophy
- 17.2 Secondary Research – Sources, Hierarchy & Data Extraction
- 17.3 Data Modeling – Bottom-Up & Top-Down Market Sizing
- 17.4 Primary Research – Stakeholder Framework, LOI & Sample Sizes
- 17.5 Forecast Methodology – Regression, Scenario & Sensitivity Analysis
- 17.6 Quality Control – Four-Layer Validation Framework
- 17.7 Limitations & Standard Assumptions
- 17.8 Disclaimer
