
X-ray Tire Inspection System Market Overview:
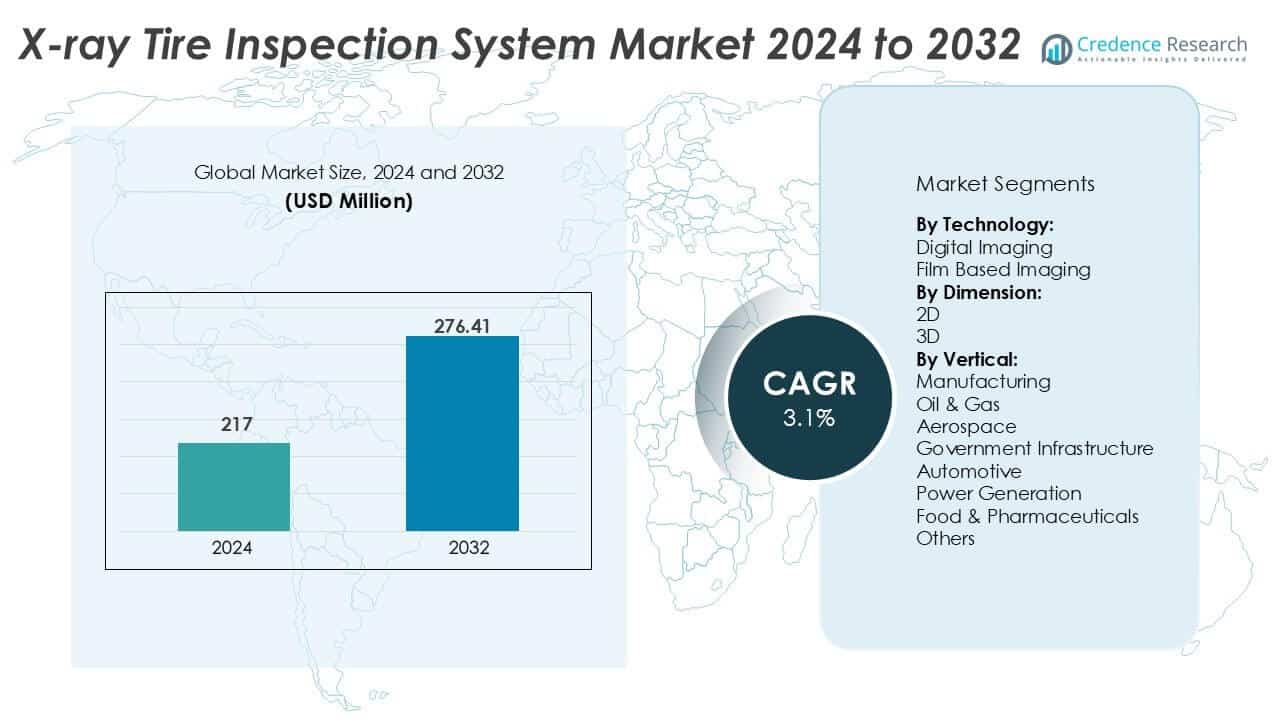
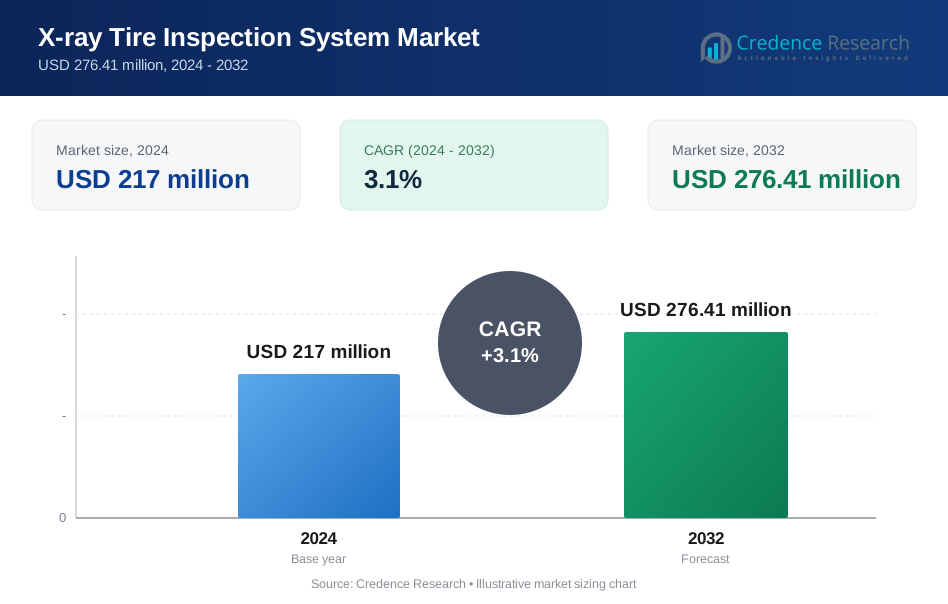
The X-ray Tire Inspection System market size was valued at USD 217 million in 2024 and is anticipated to reach USD 276.41 million by 2032, at a CAGR of 3.1% during the forecast period.
| REPORT ATTRIBUTE | DETAILS |
|---|---|
| Historical Period | 2020-2024 |
| Base Year | 2025 |
| Forecast Period | 2026-2032 |
| X-ray Tire Inspection System Market Size 2024 | USD 217 million |
| X-ray Tire Inspection System Market, CAGR | 3.1% |
| X-ray Tire Inspection System Market Size 2032 | USD 276.41 million |
X-ray Tire Inspection System Market Insights
- Rising regulatory pressure on tire quality and growing automation in manufacturing are key market drivers.
- Digital imaging dominates the technology segment with over 65% share, offering fast, precise, and cost-effective defect detection.
- Asia Pacific leads the global market with a 35% share, followed by North America at 30% and Europe at 25%, driven by automotive and aerospace applications.
- High initial investment and complex regulatory compliance for radiation-based systems remain major restraints, limiting adoption in small and mid-sized production setups.
X-ray Tire Inspection System Market Segmentation Analysis:
By Technology:
Digital imaging leads the X-ray tire inspection system market, accounting for over 65% of the revenue share in 2024. Its dominance stems from rapid processing, high-resolution output, and improved defect detection. Manufacturers prefer digital systems for automated workflows and lower operational costs. The technology enables real-time analysis and remote diagnostics, enhancing quality control. Film-based imaging remains relevant in regions with limited digital infrastructure but continues to lose ground. The shift toward Industry 4.0 and non-destructive testing automation further accelerates digital imaging adoption across tire production plants.
- For instance, Comet Yxlon’s Y.MTIS digital X-ray system delivers a detector resolution of 500 microns and high-speed scan times capable of supporting production cycle requirements, often processing a tire in under 15 to 30 seconds depending on the specific model and tire type.
By Dimension:
2D X-ray inspection dominates the market with nearly 70% share in 2024 due to its cost-effectiveness and wide industrial use. It supports high-throughput environments with reliable detection of structural flaws in sidewalls, treads, and belts. The technology suits mass production lines requiring fast, accurate imaging. However, 3D inspection is gaining traction in high-end applications requiring in-depth volumetric analysis. Automotive OEMs and aerospace suppliers increasingly deploy 3D systems to ensure precision and compliance. Growth in electric vehicle (EV) tires and complex designs supports rising 3D system demand.
- For instance, VJ Technologies’ 2D X-ray systems for tire production, typically operating at 160 kV, are designed for high-volume environments with a throughput of up to 1,200 tires per shift.
By Vertical:
The automotive sector holds the largest share in 2024, contributing over 40% to the market. X-ray tire inspection systems play a crucial role in ensuring tire uniformity, defect detection, and structural integrity for passenger and commercial vehicles. Stringent safety regulations and OEM quality standards drive continuous investment in automated inspection systems. The aerospace sector follows, using high-precision systems to detect air-pocket defects and material inconsistencies. Manufacturing and power generation verticals also adopt these systems for equipment tires and heavy-duty applications. Expanding industrial automation supports adoption across additional sectors.
Key Growth Drivers
Rising Focus on Tire Quality and Safety Compliance
Global regulatory bodies continue to tighten safety norms for passenger and commercial vehicle tires. OEMs and tire manufacturers must adhere to stricter defect detection standards to avoid recalls, warranty claims, and legal liabilities. X-ray tire inspection systems support non-destructive testing (NDT), enabling real-time imaging of internal flaws like separations, air pockets, or belt misalignment. The growing demand for consistent product quality and zero-defect manufacturing drives adoption across large tire production facilities. In high-speed mobility and autonomous vehicle development, safety remains critical, further encouraging investments in automated inspection technologies. Government regulations such as the U.S. DOT tire performance standards and EU labeling laws accelerate this trend.
- For example, Comet Yxlon’s MU2000-D tire inspection system is designed to detect internal structural deviations, such as belt misalignment, using digital flat-panel detectors with a pixel size of 200 microns to ensure high-resolution detail detectability.
Increasing Automation in Tire Manufacturing Plants
Smart factories are deploying advanced inspection systems to reduce manual labor, minimize errors, and increase throughput. X-ray tire inspection systems align with Industry 4.0 initiatives, integrating with robotic handling and AI-based analytics for defect classification. Automation allows consistent inspection of high-volume outputs, reducing reliance on operator expertise. Manufacturers benefit from traceable inspection records, predictive maintenance data, and overall efficiency gains. Automated systems also reduce rework rates and ensure higher customer satisfaction. Growing labor shortages and rising wages in developed countries further reinforce this automation shift, encouraging global tire producers to adopt X-ray systems as part of their digital transformation.
- For instance, VJ Technologies’ automated tire inspection cells integrate 160 kV X-ray sources with robotic loaders handling over 1,000 tires per shift.
Growing Tire Demand from Automotive and Aviation Sectors
The automotive sector’s steady expansion, especially in emerging economies, is driving higher tire production volumes. Growing electric vehicle (EV) adoption, which requires specialty tires, adds to this demand. Aviation fleets also require precise tire inspections for safety assurance and flight readiness. Retreaded tires in commercial and aviation sectors must undergo rigorous non-destructive inspections, boosting demand for reliable X-ray imaging systems. OEMs and MRO (Maintenance, Repair, and Overhaul) providers rely on these systems to ensure safety, reduce downtime, and extend tire service life. This demand supports sustained growth in the X-ray tire inspection system market globally.
Key Trends & Opportunities
Integration of AI and Machine Learning in Defect Detection
Manufacturers are embedding AI and machine learning into X-ray tire inspection systems to improve defect recognition and reduce false positives. AI models learn from defect datasets, allowing systems to distinguish between critical faults and harmless anomalies. This ensures better quality control and reduces unnecessary rejections. Real-time AI feedback enhances operator efficiency and supports faster decision-making. Tire producers are exploring AI-driven insights to predict equipment wear and schedule maintenance. This trend also helps in reducing operational downtime and improving plant efficiency. As AI algorithms evolve, the systems become smarter and offer self-learning capabilities, making them attractive for smart manufacturing setups.
- For instance, Yxlon integrates deep learning modules in its tire inspection software trained on over 100,000 labeled X-ray images to classify belt edge cracks and air entrapment.
Demand Surge in EV Tire Inspection and Specialty Tires
Electric vehicles introduce unique tire design challenges, including higher torque, weight distribution, and lower rolling resistance. These specialty tires require advanced inspection to ensure structural integrity and performance under different stress conditions. X-ray inspection systems play a critical role in verifying sidewall strength, tread bond, and belt alignment in EV-specific tires. Additionally, rising demand for high-performance and run-flat tires in luxury vehicles creates new opportunities. Manufacturers investing in EV production lines also upgrade their inspection capabilities to ensure precision. This segment offers long-term growth potential for X-ray tire inspection system vendors catering to premium and evolving tire categories.
Key Challenges
High Initial Investment and Operational Costs
X-ray tire inspection systems involve significant capital expenditure for hardware, shielding enclosures, and software. Small- and mid-sized tire manufacturers may struggle to justify the ROI, especially in price-sensitive markets. Maintenance, operator training, and regulatory compliance around radiation safety add to operating costs. This limits adoption in developing regions with fragmented tire production setups. Cost barriers often lead companies to rely on manual or visual inspection methods, despite their limitations. Price-conscious buyers may also opt for lower-end or refurbished systems, affecting new unit sales. Addressing affordability through modular or scalable systems could help expand the market footprint.
Radiation Safety Regulations and Handling Complexity
X-ray systems require strict adherence to radiation safety standards to protect workers and maintain compliance. Handling and operating these systems involve specialized training and licensing in many jurisdictions. Regular inspections, shielding audits, and safety protocols increase the complexity of operations. Non-compliance can result in heavy penalties or shutdowns. Concerns over radiation exposure, especially in older facilities without proper shielding, slow adoption. Some manufacturers prefer non-radiative inspection alternatives due to perceived risks and regulatory burdens. Vendors must continuously invest in safety enhancements and user-friendly interfaces to ease regulatory navigation and operational acceptance.
Regional Analysis
North America
North America holds approximately 30% market share in the X-ray tire inspection system market in 2024, driven by strong demand from automotive OEMs and aviation sectors in the U.S. and Canada. High safety regulations, advanced manufacturing capabilities, and strong adoption of automation support system deployment. The region benefits from established players offering AI-integrated inspection solutions. Aerospace and defense industries further boost adoption due to stringent tire safety protocols. Growing investment in electric vehicle (EV) production lines increases the need for reliable tire quality control systems, maintaining steady demand across the region.
Europe
Europe accounts for nearly 25% of the global market, led by Germany, France, and the UK. The region’s mature automotive industry and strict regulatory framework for tire safety fuel demand for automated X-ray inspection systems. Manufacturers adopt advanced non-destructive testing (NDT) tools to ensure compliance with EU tire labeling laws. The aerospace sector also contributes significantly, requiring high-precision inspections for aircraft tires. Sustainability goals drive interest in retreaded tire inspection. Innovation in AI-based defect detection and focus on manufacturing excellence maintain Europe’s steady adoption rate across multiple verticals.
Asia Pacific
Asia Pacific dominates the global market with a 35% share in 2024, supported by large-scale tire production in China, India, Japan, and South Korea. Rapid industrialization, strong export volumes, and expansion of automotive OEMs and EV manufacturers fuel demand. China leads regional adoption due to its vast tire manufacturing base and increasing focus on automated quality control. Government incentives for smart manufacturing further drive technology penetration. Growth in aerospace and transportation sectors adds to inspection system requirements. The region offers long-term growth potential, especially in low-cost automation and emerging EV production hubs.
Latin America
Latin America contributes around 5% to the global X-ray tire inspection system market. Brazil and Mexico lead regional adoption due to their established automotive assembly operations. However, limited infrastructure and budget constraints slow broader market penetration. Adoption remains concentrated among large manufacturers and export-oriented tire plants. Growth in local vehicle production and the expansion of commercial fleets are expected to improve future demand. As regional players modernize their inspection systems, opportunities emerge for scalable and cost-effective digital imaging solutions tailored to mid-tier production lines.
Middle East & Africa (MEA)
MEA holds nearly 5% market share, with emerging adoption across the UAE, South Africa, and Saudi Arabia. The region’s demand is primarily driven by infrastructure development, defense sectors, and a growing automotive aftermarket. Government focus on industrial diversification and logistics expansion supports interest in automated inspection systems. However, adoption is still in early stages due to limited awareness and high equipment costs. Tire imports dominate in many countries, reducing domestic production-based inspection demand. As local manufacturing increases and regulations evolve, X-ray inspection solutions are likely to see wider use, especially in key logistics and industrial zones.
X-ray Tire Inspection System Market Segmentations:
By Technology:
- Digital Imaging
- Film Based Imaging
By Dimension:
- 2D
- 3D
By Vertical:
- Manufacturing
- Oil & Gas
- Aerospace
- Government Infrastructure
- Automotive
- Power Generation
- Food & Pharmaceuticals
- Others
By Geography:
- North America
- U.S.
- Canada
- Mexico
- Europe
- Germany
- France
- U.K.
- Italy
- Spain
- Rest of Europe
- Asia Pacific
- China
- Japan
- India
- South Korea
- South-east Asia
- Rest of Asia Pacific
- Latin America
- Brazil
- Argentina
- Rest of Latin America
- Middle East & Africa
- GCC Countries
- South Africa
- Rest of the Middle East and Africa
Competitive Landscape
The X-ray tire inspection system market remains moderately consolidated, with leading players focusing on technology innovation and strategic partnerships. Companies like Mettler Toledo, Nordson Corporation, and Comet Group hold significant market share due to their broad NDT product portfolios and strong R&D investments. Japanese players such as Anritsu, Omron, and Toshiba IT & Control Systems Corporation offer compact, automated solutions suited for high-speed tire inspection lines. Nikon Corporation and North Star Imaging lead in precision imaging, particularly for aerospace and specialty tire applications. European firms like Viscom AG and Ishida Co. Ltd. drive demand with AI-integrated systems for quality control and traceability. Key strategies include product upgrades, AI integration, and service-based offerings to improve defect detection and operational efficiency. Collaborations with automotive OEMs and tire manufacturers help these companies maintain long-term contracts. Regional expansion and customization also remain central to sustaining competitive advantage in this evolving industrial automation space.
Key Player Analysis
- Mettler Toledo (US)
- Nordson Corporation (US)
- Comet Group (Switzerland)
- Anritsu (Japan)
- Viscom AG (Germany)
- North Star Imaging Inc. (US)
- Nikon Corporation (Japan)
- Ishida Co. Ltd. (Japan)
- Omron Corporation (Japan)
- Toshiba IT & Control Systems Corporation (Japan)
Recent Developments
- In July 2023, Nikon Americas Inc, the United States subsidiary of Nikon Corporation, has acquired Avonix Imaging LLC, a US-based company located in Maple Grove, Minnesota. Avonix has served as a strategic manufacturing partner for X-ray CT (computed tomography) equipment to Nikon's Industrial Metrology Business Unit (IMBU) since 2015.
- In May 2023, Mettler Toledo Product Inspection has introduced the X2 Series of high-performance X-ray systems, aimed at elevating product safety while maintaining an affordable price range accessible to all food manufacturers. With two X-ray systems currently included in the X2 Series, X-ray inspection is now within reach for manufacturers across different budget ranges. These systems also provide manufacturers with long-lasting and superior-performing software.
- In April 2023, Nikon Corporation has launched VOXLS 40 C 450 which is able to examine objects of varying sizes and densities both internally and externally, making it highly versatile for a wide range of applications across industries, inspection agencies, and academic institution
Report Coverage
The research report offers an in-depth analysis based on Technology, Dimension, Vertical and Geography. It details leading market players, providing an overview of their business, product offerings, investments, revenue streams, and key applications. Additionally, the report includes insights into the competitive environment, SWOT analysis, current market trends, as well as the primary drivers and constraints. Furthermore, it discusses various factors that have driven market expansion in recent years. The report also explores market dynamics, regulatory scenarios, and technological advancements that are shaping the industry. It assesses the impact of external factors and global economic changes on market growth. Lastly, it provides strategic recommendations for new entrants and established companies to navigate the complexities of the market.
Future Outlook
- Demand will grow with rising focus on tire quality and road safety standards.
- Adoption of AI-integrated inspection systems will increase across advanced manufacturing lines.
- EV tire production will drive new demand for high-precision inspection systems.
- 3D X-ray imaging will see faster adoption in premium and aerospace tire applications.
- Manufacturers will invest in automation to reduce inspection time and labor dependency.
- Regional expansion by key players will improve system availability in emerging markets.
- Film-based systems will continue to decline in favor of digital solutions.
- Cloud-based data integration will support remote monitoring and predictive maintenance.
- Tier-2 and Tier-3 manufacturers will adopt modular, cost-effective inspection systems.
- Strategic partnerships between OEMs and system providers will shape long-term market growth.
Request a Free Sample
Fill in your details and we'll send you a free sample report.
- Sample data tables & charts
- Research methodology
Need a Custom Version of This Report?
Tailor the scope, geography, or segments to your exact requirements.
- Custom geography or segment scope
- Direct access to our analyst team
Frequently Asked Questions
What is the current market size for X-ray Tire Inspection System market, and what is its projected size in 2032?
At what Compound Annual Growth Rate is the X-ray Tire Inspection System market projected to grow between 2024 and 2032?
Which X-ray Tire Inspection System market segment held the largest share in 2024?
What are the primary factors fueling the growth of the X-ray Tire Inspection System market?
Who are the leading companies in the X-ray Tire Inspection System market?
Which region commanded the largest share of the X-ray Tire Inspection System market in 2024?
Table of Content
Chapter 1. Report Introduction
- 1.1 Report Description & Purpose
- 1.1.1 Report Title & Market Definition
- 1.1.2 Unique Selling Propositions (USP) & Key Differentiators
- 1.1.3 Value Proposition for Stakeholders
- 1.2 Research Objectives
- 1.2.1 Market Sizing Objectives (Volume & Revenue)
- 1.2.2 Segmentation Objectives
- 1.2.3 Competitive Intelligence Objectives
- 1.2.4 Forecast & Scenario Objectives
- 1.3 Report Scope
- 1.3.1 X-ray Tire Inspection System Scope – Types & Subtypes Covered
- 1.3.2 Geographic Scope – Regions & Countries Covered
- 1.3.3 Historical Period, Base Year & Forecast Period (2024; forecast to 2032)
- 1.3.4 Inclusions & Exclusions
- 1.4 HS Code & Classification Framework
- 1.5 Currency, Units & Pricing Basis
- 1.6 Target Stakeholders
- 1.7 Limitations & Assumptions
Chapter 2. Executive Summary
- 2.1 Global X-ray Tire Inspection System Market Snapshot
- 2.1.1 Market Size – Historical (2024) & Forecast (2024-2032) (2024: USD 217 million → 2032: USD 276.41 million)
- 2.1.2 Volume & Revenue – Global Totals
- 2.1.3 Key Market Highlights – Top Five Facts
- 2.2 X-ray Tire Inspection System Market Segmentation Snapshot
- 2.2.1 Market Split by Region – 2024 vs. 2032
- 2.3 Competitive Snapshot
- 2.3.1 Top 10 Players by Revenue Share – 2024
- 2.3.2 Top 10 Players by Volume Share – 2024
- 2.3.3 Recent Strategic Developments (18-Month Summary)
- 2.4 Key Investment Highlights & Strategic Conclusions
Chapter 3. X-ray Tire Inspection System Market Dynamics & Industry Analysis
- 3.1 Market Overview & Context
- 3.1.1 X-ray Tire Inspection System Market Position in the Broader Automotive Value Chain
- 3.1.2 OEM vs. Replacement Market Dynamics
- 3.1.3 Market Maturity & Development Stage by Region
- 3.2 X-ray Tire Inspection System Market Drivers
- 3.3 X-ray Tire Inspection System Market Restraints & Challenges
- 3.4 X-ray Tire Inspection System Market Opportunities
- 3.5 Porter's Five Forces Analysis
- 3.5.1 Threat of New Entrants
- 3.5.2 Bargaining Power of Suppliers
- 3.5.3 Bargaining Power of Buyers
- 3.5.4 Threat of Substitutes
- 3.5.5 Competitive Rivalry – Intensity Assessment
- 3.6 X-ray Tire Inspection System Value Chain Analysis
- 3.6.1 Upstream – Raw Material/Input Suppliers
- 3.6.1.1 Raw Material/Input 1
- 3.6.1.2 Raw Material/Input 2
- 3.6.1.3 Raw Material/Input 3
- 3.6.2 Midstream – Production/Manufacturing/Service Delivery
- 3.6.2.1 Production/Process Overview
- 3.6.2.2 Key Facility Locations & Capacity by Manufacturer
- 3.6.3 Downstream – Distribution & End Consumer
- 3.6.3.1 Primary Channel – B2B/OEM
- 3.6.3.2 Secondary Channels – Dealer, Retail, Online, Direct
- 3.6.4 Value Chain Profitability Analysis
- 3.6.1 Upstream – Raw Material/Input Suppliers
- 3.7 PESTEL Analysis
- 3.7.1 Political Factors
- 3.7.2 Economic Factors
- 3.7.3 Social Factors
- 3.7.4 Technological Factors
- 3.7.5 Environmental Factors
- 3.7.6 Legal Factors
- 3.8 X-ray Tire Inspection System Supply Chain Analysis
- 3.8.1 Raw Material/Input Supply Risk Assessment
- 3.8.2 Manufacturing Concentration Risk (Geographic Exposure)
- 3.8.3 Trade Disruption Impact Analysis
- 3.9 Regulatory & Policy Landscape
Note: The regulatory and policy landscape section covers regulations based on their applicability to the market, X-ray Tire Inspection System category, geography, and scope of the study. Only regulatory frameworks with a material impact on operations, compliance, trade, sustainability, or market access are analyzed in detail.
Chapter 4. Key Investment Pockets & Opportunity Analysis
- 4.1 X-ray Tire Inspection System Market Attractiveness Analysis
- 4.1.1 By Region – Investment Attractiveness Matrix (Volume × CAGR)
- 4.2 Absolute Revenue Growth Opportunity
- 4.2.1 By Region – Absolute USD Growth Through 2032
- 4.3 Incremental Volume Opportunity
- 4.3.1 By Region – Incremental Volume Through 2032
- 4.3.2 Segment – Incremental Volume
- 4.4 Emerging Submarket Opportunity Deep Dive (Subject to Applicability)
- 4.5 Emerging Market Opportunity Scorecards
- 4.5.1 United States
- 4.5.2 Europe
- 4.5.3 Asia
- 4.5.4 Middle East & Africa
Note: Emerging Market Opportunity Scorecards will be included based on relevance and strategic importance. Regions listed are indicative and may vary depending on data availability and market dynamics.
Chapter 5. X-ray Tire Inspection System Import-Export Analysis & Trade Flows
- 5.1 Global Trade Overview
- 5.1.1 Global Export Value by Country (2024)
- 5.1.2 Global Export Volume by Country (2024)
- 5.1.3 Global Import Value by Country (2024)
- 5.1.4 Global Import Volume by Country (2024)
- 5.1.5 Net Trade Balance by Country (2024)
- 5.2 Export Analysis – Segment
- 5.2.1 Type 1 (HS Code)
- 5.2.2 Type 2 (HS Code)
- 5.2.3 Type 3 (HS Code)
- 5.2.4 Type 4 (HS Code)
- 5.2.5 Type 5 (HS Code)
- 5.3 Import Analysis – Segment
- 5.3.1 Type 1 (HS Code)
- 5.3.2 Type 2 (HS Code)
- 5.3.3 Type 3 (HS Code)
- 5.3.4 Type 4 (HS Code)
- 5.3.5 Type 5 (HS Code)
- 5.4 Average Unit Trade Prices
- 5.4.1 Average Export Price – Segment & Country
- 5.4.2 Average Import Price – Segment & Source Country
- 5.4.3 Price Trends (2024)
- 5.5 Key Trade Route Analysis
- 5.5.1 Trade Route 1
- 5.5.2 Trade Route 2
- 5.5.3 Trade Route 3
- 5.5.4 Trade Route 4
- 5.5.5 Trade Route 5
- 5.6 Trade Policy Impact Assessment
- 5.6.1 US Anti-Dumping & Section 301 Tariffs
- 5.6.2 EU Customs Union Impact
- 5.6.3 Major Free Trade Agreements
- 5.6.4 USMCA Rules of Origin
Note: Trade policy analysis will be included only where relevant to the X-ray Tire Inspection System market.
Chapter 6. Competitive Landscape & Company Benchmarking
- 6.1 X-ray Tire Inspection System Market Concentration & Structure
- 6.1.1 Herfindahl-Hirschman Index (HHI) – vs. 2024
- 6.1.2 Tier 1, Tier 2 & Tier 3 Market Structure
- 6.1.3 Global, Regional & Local Player Dynamics
- 6.2 X-ray Tire Inspection System Market Share Analysis – 2024
- 6.2.1 Global Revenue Share by Company
- 6.2.2 Global Volume Share by Company
- 6.2.3 Regional Revenue Share
- 6.2.4 Market Share Evolution ( vs. 2024)
- 6.2.5 OEM Segment Share by Company
- 6.2.6 Replacement Segment Share by Company
- 6.3 Production/Delivery Capacity & Facility Analysis
- 6.3.1 Global Installed Capacity
- 6.3.2 Capacity Utilization Rates
- 6.3.3 Production/Output Volume
- 6.3.4 Facility Locations & Capacity Map
- 6.3.5 Planned Capacity Additions
- 6.4 X-ray Tire Inspection System Competitive Benchmarking Matrix
- 6.4.1 Revenue, Volume, CAGR & Profitability Comparison
- 6.4.2 Channel Revenue Mix
- 6.4.3 Geographic Revenue Exposure
- 6.4.4 R&D Intensity
- 6.4.5 Sustainability Maturity
- 6.5 Strategic Developments in X-ray Tire Inspection System (Last 24 Months)
- 6.5.1 Mergers, Acquisitions & Divestments
- 6.5.2 New X-ray Tire Inspection System Launches
- 6.5.3 Facility Expansions
- 6.5.4 Strategic Alliances, Joint Ventures & Partnerships
- 6.5.5 Distribution Expansion & Market Entry
- 6.5.6 Sustainability & ESG Initiatives
- 6.6 Competitive Strategy Mapping
- 6.6.1 Leader, Challenger, Follower & Niche Classification
- 6.6.2 Pricing Strategy Comparison
- 6.6.3 Channel Strategy Matrix
Note: Strategic developments are included based on their materiality and the availability of reliable information.
Chapter 7. Global X-ray Tire Inspection System Market – By Distribution Channel
- 7.1 Segment Overview
- 7.1.1 Volume & Revenue Split by Channel (2024 & 2032)
- 7.1.2 Channel Mix Evolution (2024-2032)
Chapter 8. Regional Market Analysis – Global Overview
- 8.1 Global Regional Overview
- 8.1.1 Regional Volume Share
- 8.1.2 Regional Revenue Share
- 8.1.3 Regional Volume by Region
- 8.1.4 Regional Revenue by Region
- 8.1.5 Regional Forecast Through 2032
- 8.2 Cross-Regional Segment Analysis
- 8.2.1 By Distribution Channel
- 8.2.2 By Brand/Price Tier
Chapter 9. North America X-ray Tire Inspection System Market
- 9.1 United States
- 9.2 Canada
- 9.3 Mexico
Chapter 10. Europe X-ray Tire Inspection System Market
- 10.1 Germany
- 10.2 France
- 10.3 Italy
- 10.4 United Kingdom
- 10.5 Spain
- 10.6 Poland
- 10.7 Russia
- 10.8 Netherlands
- 10.9 Belgium
- 10.10 Sweden
- 10.11 Denmark
- 10.12 Norway
- 10.13 Rest of Europe
Chapter 11. Asia Pacific X-ray Tire Inspection System Market
- 11.1 China
- 11.2 India
- 11.3 Japan
- 11.4 South Korea
- 11.5 Thailand
- 11.6 Indonesia
- 11.7 Vietnam
- 11.8 Malaysia
- 11.9 Australia
- 11.10 Rest of Asia Pacific
Chapter 12. Latin America X-ray Tire Inspection System Market
- 12.1 Brazil
- 12.2 Argentina
- 12.3 Colombia
- 12.4 Chile
- 12.5 Rest of Latin America
Chapter 13. Middle East X-ray Tire Inspection System Market
- 13.1 Saudi Arabia
- 13.2 United Arab Emirates
- 13.3 Turkey
- 13.4 Israel
- 13.5 Iran
- 13.6 Rest of the Middle East
Chapter 14. Africa X-ray Tire Inspection System Market
- 14.1 South Africa
- 14.2 Egypt
- 14.3 Nigeria
- 14.4 Morocco
- 14.5 Rest of Africa
Chapter 15. X-ray Tire Inspection System Company Profiles
- 15.1 [Company 01]
- 15.1.1 Company Overview
- 15.1.2 Key Management Personnel
- 15.1.3 Products & Services Portfolio
- 15.1.4 Financial Performance
- 15.1.5 Key Market Focus & Geographic Presence
- 15.1.6 Recent Developments & Strategic Initiatives
Note: The company profile list is preliminary and may change based on research findings, market developments, data availability, and client requirements.
Chapter 16. Appendices
- Appendix A – List of Abbreviations & Acronyms
- Appendix B – Industry Classification Code Reference – Full Series
- Appendix C – Production & Capacity Data Tables
- Appendix D – End-Use & Demand Base Tables
- Appendix E – Consumption & Replacement Rate Assumptions
- Appendix F – ASP Reference Tables
- Appendix G – Manufacturing & Facility Database
- Appendix H – Import-Export Data Tables
- Appendix I – Regulatory Summary Tables
- Appendix J – Primary Research Participant List (Anonymized)
- Appendix K – Primary Research Questionnaire Framework
- Appendix L – Data Sources & Bibliography
- Appendix M – Market Size Divergence & Source Comparison
Chapter 17. Research Methodology
- 17.1 Research Framework & Philosophy
- 17.2 Secondary Research – Sources, Hierarchy & Data Extraction
- 17.3 Data Modeling – Bottom-Up & Top-Down Market Sizing
- 17.4 Primary Research – Stakeholder Framework, LOI & Sample Sizes
- 17.5 Forecast Methodology – Regression, Scenario & Sensitivity Analysis
- 17.6 Quality Control – Four-Layer Validation Framework
- 17.7 Limitations & Standard Assumptions
- 17.8 Disclaimer
