Beneficial Insects Market Overview:
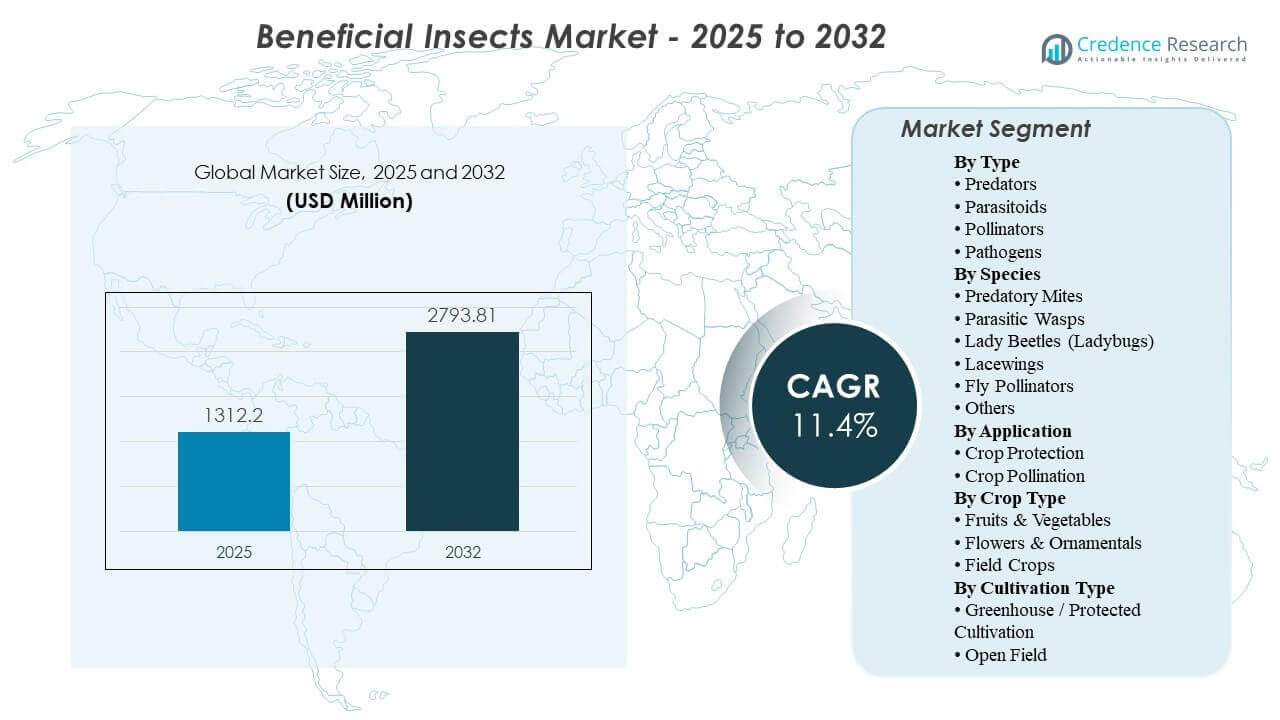
The global Beneficial Insects market size was estimated at USD 1,312.2 million in 2025 and is expected to reach USD 2,793.81 million by 2032, growing at a CAGR of 11.4% from 2025 to 2032. Growth is primarily supported by the accelerating shift toward integrated pest management programs as growers reduce reliance on conventional chemistries and adopt biological control for consistent pest suppression and residue compliance. Demand is further supported by increasing protected cultivation and high-value horticulture expansion, where biological control programs are implemented more intensively.
| REPORT ATTRIBUTE |
DETAILS |
| Historical Period |
2020-2023 |
| Base Year |
2024 |
| Forecast Period |
2025-2032 |
| Beneficial Insects Market Size 2025 |
USD 1,312.2 million |
| Beneficial Insects Market, CAGR |
11.4% |
| Beneficial Insects Market Size 2032 |
USD 2,793.81 million |
Key Market Trends & Insights
- The Beneficial Insects Market is projected to expand at an 11.4% CAGR during 2025–2032, reflecting strong structural adoption of biological control in mainstream crop protection programs.
- North America accounted for 35.96% in 2025, supported by established commercial-scale greenhouse production and broader biologicals penetration in high-value crops.
- Predators accounted for the largest share of 36.7% in 2025, supported by rapid visible pest suppression and repeat-release compatibility in protected systems.
- Crop Protection accounted for 58.4% in 2025, indicating that pest management remains the dominant commercial use case versus pollination-focused deployment.
- Fruits & Vegetables accounted for 46.6% in 2025, reflecting higher residue sensitivity and greater economic justification for biological control in premium produce supply chains.
Segment Analysis
The Beneficial Insects Market is shaped by grower preference for reliable, program-based biological control that fits integrated pest management workflows across horticulture and protected cultivation. Adoption is strongest where pest pressure is frequent and quality specifications penalize chemical residues, which increases the commercial value of preventive and curative biological approaches. Wider availability of standardized release protocols and advisory support has improved repeatability across production cycles, supporting sustained purchasing.
Market demand also reflects the operational advantages of beneficials in controlled environments, where scouting intensity, climate stability, and cropping density improve the consistency of biological outcomes. As protected cultivation footprints expand and sustainability requirements tighten across food value chains, beneficial insect deployment increasingly shifts from trial use to routine seasonal planning. Product performance consistency, supply reliability, and technical support remain critical determinants of buyer retention and scale-up.
Access crucial information at unmatched prices!
Request your sample report today & start making informed decisions powered by Credence Research Inc.!
Download Sample
By Type Insights
Predators accounted for the largest share of 36.7% in 2025. Predators typically deliver immediate pest reduction, which supports fast response during outbreak conditions in high-value crops. Commercial programs commonly rely on repeat introductions, and predator products often align well with routine scouting and threshold-based release practices. Adoption is also supported by familiarity among growers and advisors, which strengthens repeat purchasing across production cycles.
By Species Insights
Predatory mites accounted for the largest share of 33.6% in 2025. Predatory mites are widely used in greenhouse vegetables and ornamentals where mite pests and thrips create persistent management needs. The species category benefits from strong commercial availability, predictable application routines, and compatibility with protected cultivation systems that favor biological control intensity. Outcomes are strengthened by structured monitoring and well-established technical guidance, supporting scalable and repeatable deployment.
By Application Insights
Crop Protection accounted for the largest share of 58.4% in 2025. Crop protection demand leads because pest management remains the most frequent and economically material use case across crops and cultivation systems. Biological control programs reduce chemical residue risk and support resistance management strategies within integrated pest management. The segment also benefits from growing retailer and export standards that reinforce lower-chemical production expectations.
By Crop Type Insights
Fruits & Vegetables accounted for the largest share of 46.6% in 2025. Fruits and vegetables typically face higher residue scrutiny and quality requirements, which increases biological control adoption compared with broad-acre crops. High crop value strengthens willingness to invest in preventive pest management programs and structured release schedules. Protected cultivation exposure within greenhouse vegetables further elevates beneficial insect intensity per hectare.
By Cultivation Type Insights
Greenhouse and protected cultivation environments tend to support higher beneficial insect utilization because planned releases, tighter scouting, and controlled conditions improve biological program consistency. High crop value in protected systems also increases tolerance for input costs when return on investment is supported by quality and yield protection. Open-field deployment remains meaningful, but adoption can be more variable due to weather exposure, broader pest migration pressure, and uneven monitoring intensity. Expansion of protected cultivation acreage continues to strengthen program-based purchasing across multiple production cycles.
Beneficial Insects Market Drivers
Expansion of integrated pest management adoption
Integrated pest management adoption is increasing across many crop systems as growers seek sustainable pest control with predictable outcomes. Beneficial insects fit IPM programs by enabling biological suppression and lowering dependence on single-mode chemical solutions. Wider advisor support and program standardization are improving confidence in operational execution. Premium crop segments increasingly treat biological control as part of routine production planning rather than discretionary trials.
- For instance, Koppert announced a 3,500 m² fully climate-controlled flour moth (Ephestia) breeding facility in Berkel en Rodenrijs, describing it as a “world first” at this scale for biological insect production and noting it is intended to stabilize and improve efficiency in its biological production chain.
Rising residue and compliance requirements across food value chains
Food supply chains increasingly emphasize residue compliance and sustainable production expectations, especially for export-oriented and branded produce. Beneficial insects support residue-sensitive production by reducing reliance on conventional chemistries during critical harvest windows. Quality-driven crops typically justify the use of preventive biological programs to protect market access and pricing. Compliance-driven procurement practices reinforce long-term demand for biological control inputs.
Growth in protected cultivation and high-value horticulture
Protected cultivation expansion increases beneficial insect usage intensity due to higher cropping density and recurring pest pressure in controlled environments. Greenhouse systems also allow structured scouting and planned releases that improve program reliability. High-value horticulture supports regular replenishment cycles, strengthening repeat purchases. The expansion of greenhouse vegetables and ornamentals acts as a demand amplifier for predators and parasitoids.
- For instance, Biobest specifies its Standard Hive (B.t.) for greenhouse pollination as providing 6–8 weeks of activity with more than 80 bumblebee workers per hive, and includes an extendable ventilation design intended to keep colonies cool when temperatures exceed 26°C.
Improved availability, logistics, and technical support
Commercial growth is supported by improved mass-rearing capacity, product availability, and advisory services that lower execution risk for growers. Distribution networks and technical support strengthen adoption by improving release timing and integration with compatible crop inputs. Product portfolios are also expanding to address more pest targets and crop contexts. These improvements collectively increase repeatability and retention across growing seasons.
Beneficial Insects Market Challenges
Supply reliability and biological performance variability remain constraints, particularly where logistics and storage conditions reduce viable organism quality. Outcomes can differ based on pest pressure, microclimate, scouting discipline, and application timing, which increases perceived risk for new adopters. Limited on-farm expertise can reduce program effectiveness when monitoring and release protocols are inconsistent. Price sensitivity can also emerge in lower-value crops where economic return is less direct.
- For instance, Biobest’s Premium Hive is engineered with an extendable ventilation system to keep the hive cool when temperatures exceed 26°C, and the company specifies that bumblebees perform best at 8–32°C and 50–80% humidity; each hive contains 110+ workers showing how tightly biological performance is tied to quantified handling and microclimate conditions.
Competitive pressure from alternative biologicals and selective chemistries can create substitution risk in certain pest scenarios. Some growers continue to rely on chemical programs due to familiarity and perceived speed of results, particularly in open-field contexts. Regulatory complexity for live organism movement across borders can slow commercialization in certain markets. These factors can increase the need for stronger advisory coverage and localized production.
Beneficial Insects Market Trends and Opportunities
Biological control programs increasingly integrate complementary tools such as monitoring systems, decision support, and attract-and-kill approaches to improve efficacy and reduce deployment uncertainty. Portfolio bundling and program design services are becoming more important as growers seek outcome-based solutions rather than individual products. Increased focus on sustainability metrics and documentation also supports expanded adoption in premium supply chains. Standardized protocols and improved forecasting can increase deployment confidence across more crop systems.
Opportunities are expanding through protected cultivation growth and increasing penetration into diversified crop portfolios beyond traditional greenhouse segments. Broader adoption in open-field fruits and vegetables presents an addressable expansion area where program design and timing improvements raise success rates. Localization of production and distribution can improve supply consistency and product availability in emerging regions. Continued product innovation and technical partnerships can strengthen differentiation and customer retention.
- For instance, a Hawaii papaya orchard study comparing GF-120 bait stations vs foliar bait sprays reported infestation reductions of 71.4% (bait stations) and 63.1% (foliar sprays) versus control at six weeks after first bait spray, illustrating how attract-and-kill format and timing can materially change outcomes in open-field fruit systems.
Regional Insights
North America
North America accounted for the largest share of 35.96% in 2025. Demand is supported by strong adoption of biological control in high-value crops and established protected cultivation infrastructure. Technical advisory networks and commercial-scale distribution support repeat deployments across production cycles. The region also benefits from residue-sensitive produce markets that reinforce biological adoption.
Europe
Europe accounted for 27.85% in 2025. Adoption is supported by sustainability priorities and established greenhouse and horticulture production systems. Biological control programs are widely embedded in commercial practice across multiple crop categories. Mature supply chains and technical support strengthen program reliability and repeat purchasing.
Asia Pacific
Asia Pacific accounted for 24.55% in 2025. Regional growth is supported by expanding protected cultivation footprints and increasing horticulture intensity in key producing countries. Demand is strengthened by rising focus on food safety and export-grade quality requirements. Scaling advisory support and improving supply networks remain important for broader penetration.
Latin America
Latin America accounted for 8.65% in 2025. Demand is driven by export-oriented horticulture and increasing interest in integrated pest management for residue compliance. Adoption tends to concentrate in higher-value crops where biological return on investment is clear. Expansion opportunities improve as distribution networks and technical service coverage deepen.
Middle East & Africa
Middle East & Africa accounted for 3.00% in 2025. Regional adoption is supported by greenhouse clusters and high-value crop production in select countries. Penetration remains lower due to uneven access to product supply and technical support across broader geographies. Localized production, training, and program services can improve adoption consistency.
Competitive Landscape
Competition in the Beneficial Insects Market centers on portfolio breadth, rearing capacity, supply reliability, and technical advisory services that help growers execute consistent biological programs. Providers differentiate through pest-target coverage, crop-specific release protocols, and service-led program design that improves field outcomes. Companies also compete through regional production footprints and distribution partnerships to improve delivery quality for live organisms. Program effectiveness, customer retention, and repeat purchases depend heavily on advisory support and supply chain consistency.
Koppert Biological Systems is positioned around a broad biological control portfolio and service-driven deployment models that support program adoption across horticulture and protected cultivation. The company focus typically emphasizes integrated solutions, pairing beneficial organisms with guidance on scouting, timing, and compatibility with crop inputs. Commercial differentiation is supported by expertise in program design and grower training that improves repeatability across seasons. Expansion through partnerships and distribution strength supports broader customer reach across key crop regions.
Shape Your Report to Specific Countries or Regions & Enjoy 30% Off!
The industry research and growth report includes detailed analyses of the competitive landscape of the market and information about key companies, including:
- Koppert Biological Systems
- Biobest Group NV
- Applied Bio-nomics Ltd.
- Andermatt Biocontrol AG (Andermatt Group)
- BioBee Biological Systems (BioBee Ltd.)
- Bioline AgroSciences Ltd.
- Fargro Limited
- ARBICO Organics
- Bionema Ltd.
- Tip Top Bio-Control
- BASF SE
- Syngenta Group
- Bayer AG
- Corteva
Qualitative and quantitative analysis of companies has been conducted to help clients understand the wider business environment as well as the strengths and weaknesses of key industry players. Data is qualitatively analyzed to categorize companies as pure play, category-focused, industry-focused, and diversified; it is quantitatively analyzed to categorize companies as dominant, leading, strong, tentative, and weak.
Recent Developments
- In August 2025, Koppert was featured in industry coverage for its “Chrysopa” predatory lacewing offering for aphid and pest control, dated 01 August 2025 (New Delhi), positioning it as an eco-friendly tool within integrated pest management (IPM) programs.
- In June 2025, Koppert signed a strategic partnership with Insect Science in the Netherlands, naming Insect Science as Koppert’s preferred supplier for semiochemical solutions.
- In January 2025, Andermatt Nederland B.V. (Andermatt Group) announced it would acquire Entocare C.V.’s beneficial insect business, effective January 1, 2025, to expand its biological plant protection portfolio and strengthen capabilities in beneficial insects.
Report Scope
| Report Attribute |
Details |
| Market size value in 2025 |
USD 1,312.2 million |
| Revenue forecast in 2032 |
USD 2,793.81 million |
| Growth rate (CAGR) |
11.4% (2025–2032) |
| Base year |
2025 |
| Forecast period |
2026–2032 |
| Quantitative units |
USD million |
| Segments covered |
By Type: Predators; Parasitoids; Pollinators; Pathogens | By Species: Predatory Mites; Parasitic Wasps; Lady Beetles (Ladybugs); Lacewings; Fly Pollinators; Others | By Application: Crop Protection; Crop Pollination | By Crop Type: Fruits & Vegetables; Flowers & Ornamentals; Field Crops | By Cultivation Type: Greenhouse / Protected Cultivation; Open Field |
| Regional scope |
North America; Europe; Asia Pacific; Latin America; Middle East & Africa |
| Key companies profiled |
Koppert Biological Systems; Biobest Group NV; Applied Bio-nomics Ltd.; Andermatt Biocontrol AG (Andermatt Group); BioBee Biological Systems (BioBee Ltd.); Bioline AgroSciences Ltd.; Fargro Limited; ARBICO Organics; Bionema Ltd.; Tip Top Bio-Control; BASF SE; Syngenta Group; Bayer AG; Corteva |
| No. of pages |
335 |
Segmentation
BY TYPE
- Predators
- Parasitoids
- Pollinators
- Pathogens
BY SPECIES
- Predatory Mites
- Parasitic Wasps
- Lady Beetles (Ladybugs)
- Lacewings
- Fly Pollinators
- Others
BY APPLICATION
- Crop Protection
- Crop Pollination
BY CROP TYPE
- Fruits & Vegetables
- Flowers & Ornamentals
- Field Crops
BY CULTIVATION TYPE
- Greenhouse / Protected Cultivation
- Open Field
BY REGION
- North America
- Europe
- Germany
- France
- U.K.
- Italy
- Spain
- Rest of Europe
- Asia Pacific
- China
- Japan
- India
- South Korea
- South-east Asia
- Rest of Asia Pacific
- Latin America
- Brazil
- Argentina
- Rest of Latin America
- Middle East & Africa
- GCC Countries
- South Africa
- Rest of the Middle East and Africa


