
Sugarcane ethanol and drop-in polyethylene set demand
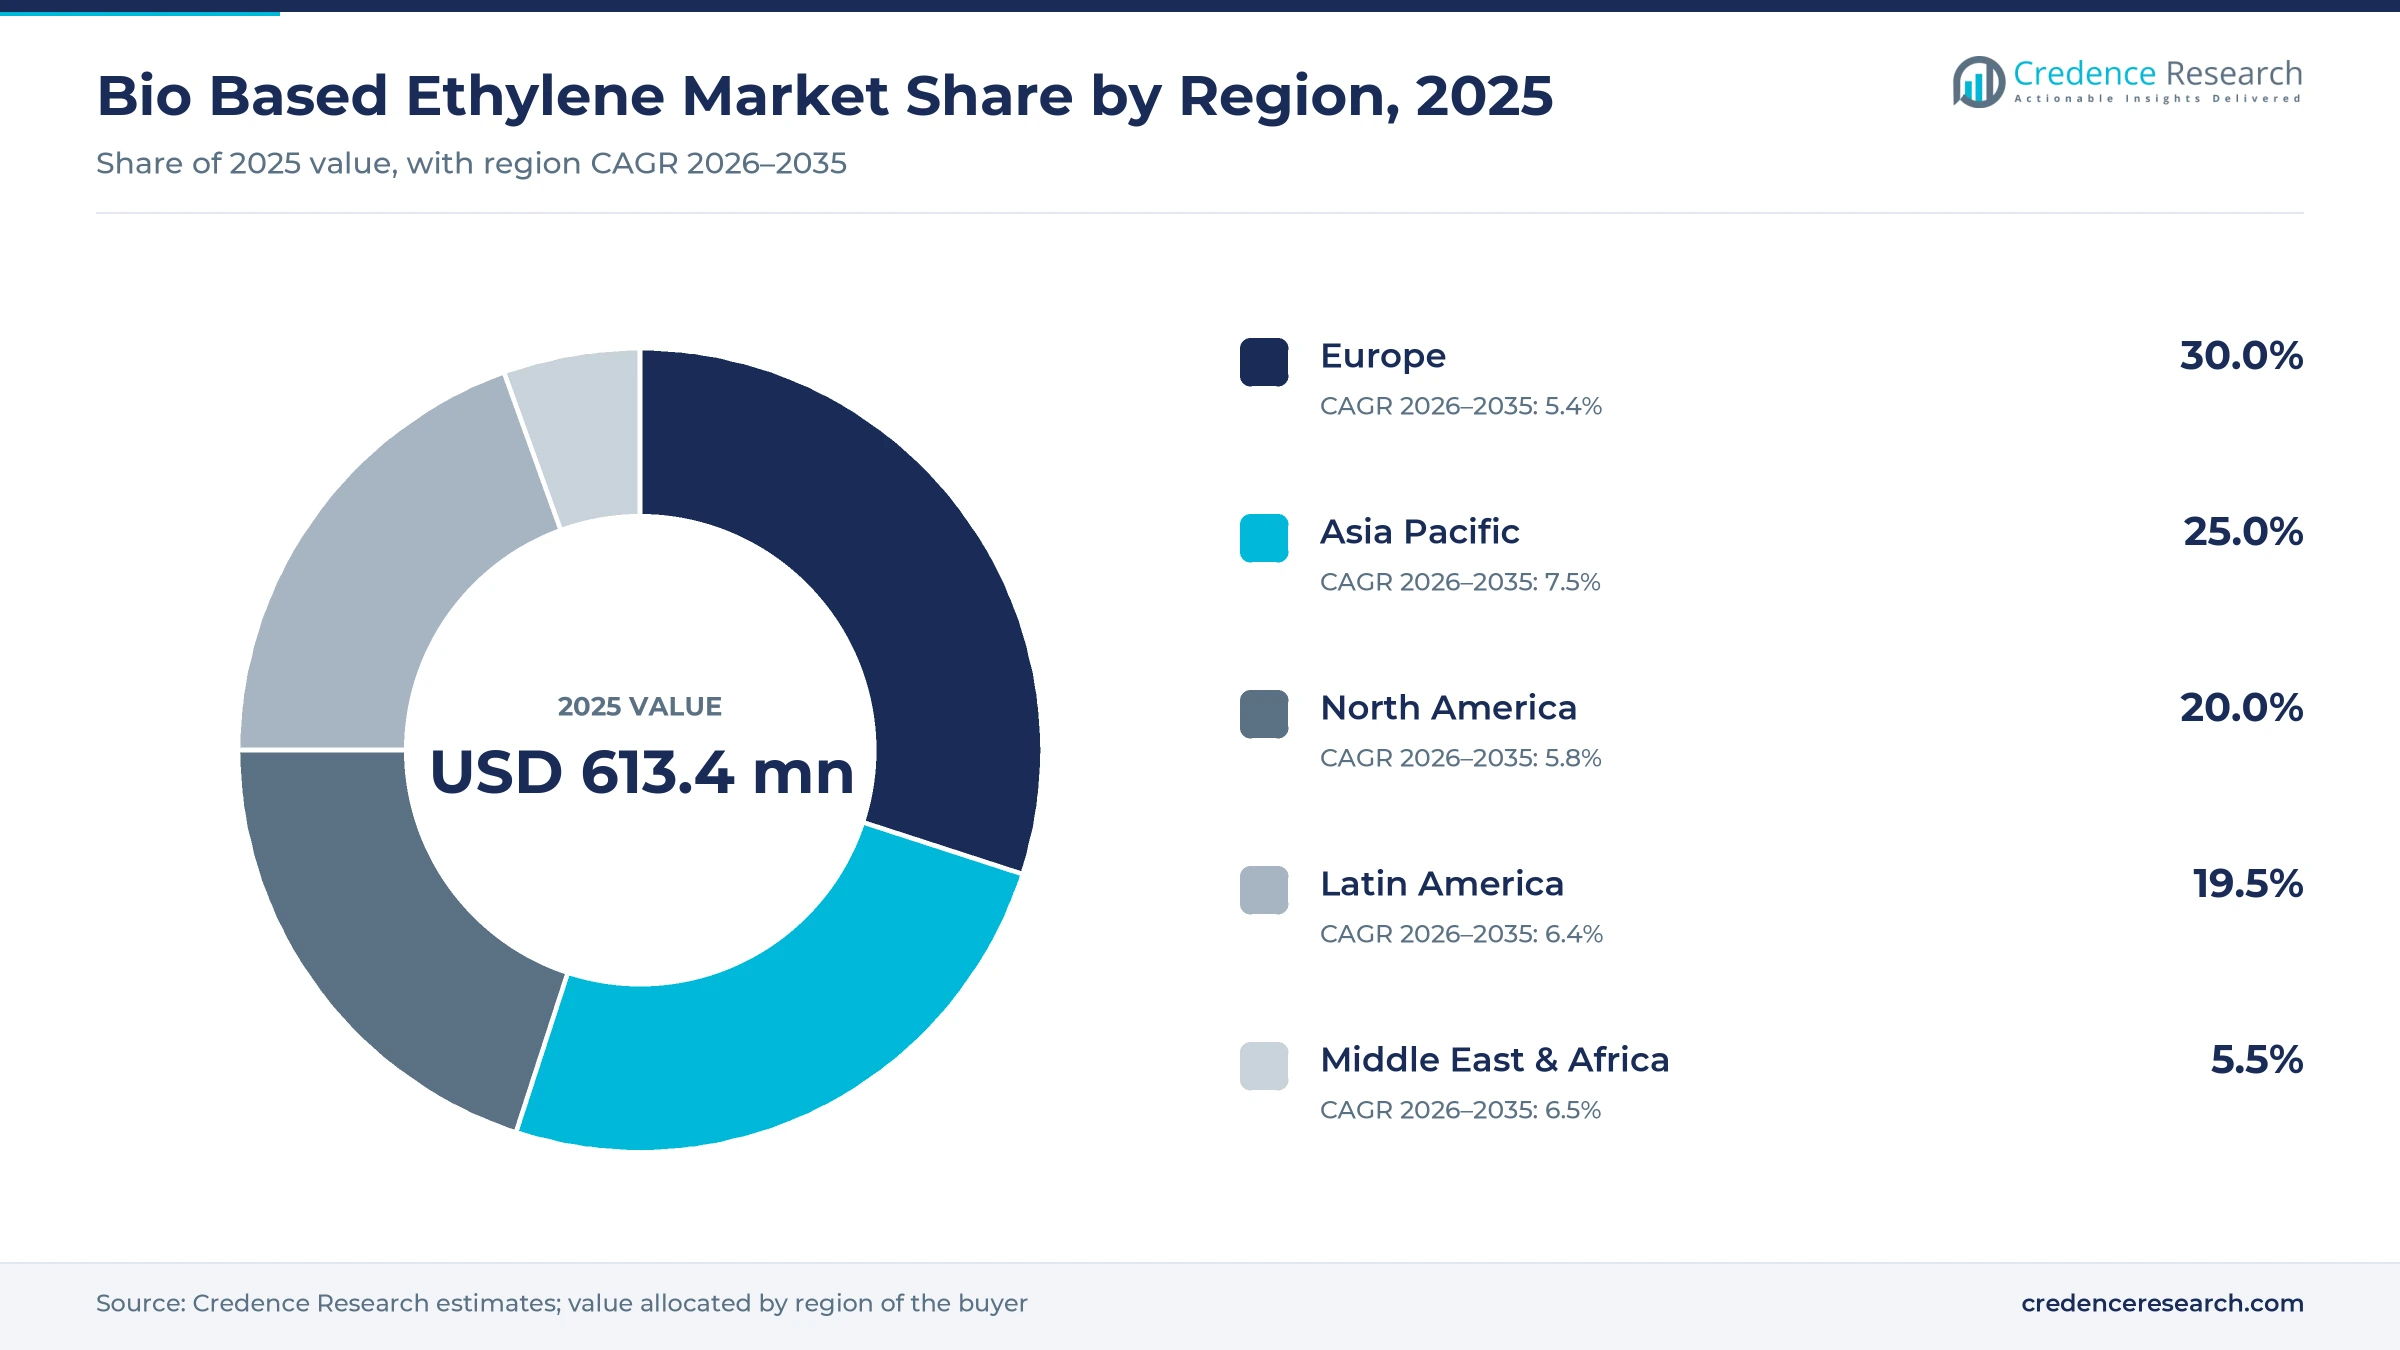
The global bio-based ethylene market was valued at USD 613.4 million in 2025 and is projected to increase from USD 652.0 million in 2026 to USD 1.13 billion by 2035, registering a CAGR of 6.30% during 2026–2035. Demand comes from packaging converters and brand owners that buy drop-in polyethylene with a measurable renewable carbon share, and from surfactant makers that convert the ethylene into ethylene oxide. Europe held the largest regional share, 30.0% in 2025, because European food, cosmetics and carton buyers pay the green premium, while Asia Pacific is the fastest-growing region at 7.5% a year on planned Thai and Indian capacity. Supply is unusually concentrated, since one Brazilian plant that dehydrates sugarcane ethanol makes most of the volume sold today. The main commercial change is the planned 200,000-ton plant in Thailand, which would be the first dedicated bio-ethylene unit in Asia. Ethanol prices, rather than fossil ethylene prices, set most of the production cost.
Which ethylene counts as bio-based in this estimate?
The estimate counts ethylene whose carbon comes from biomass, made either by dehydrating sugarcane, corn or cassava ethanol or by cracking bio-naphtha and waste oils with certified mass-balance attribution. Ethylene used inside the same complex to make polyethylene, ethylene-vinyl acetate or ethylene oxide is valued at the ethylene level.
Bio-based polyethylene resin, finished packaging and fuel ethanol sit outside the value, although they set most demand signals. Most volume moves under long-term offtake agreements between producers and brand owners, with certified renewable carbon content written into the contract.

Bio Based Ethylene Market Insights
- The market is valued at USD 613.4 million in 2025 and is projected to reach USD 1.13 billion by 2035, growing at a 6.30% CAGR as dedicated ethanol-to-ethylene capacity expands.
- Europe led with 30.0% of 2025 value, because European carton, food and cosmetics brands buy most of the certified renewable polyethylene sold.
- Packaging held 70.0% of 2025 value, as drop-in bio-polyethylene for films, closures and bottles absorbs most of the ethylene produced.
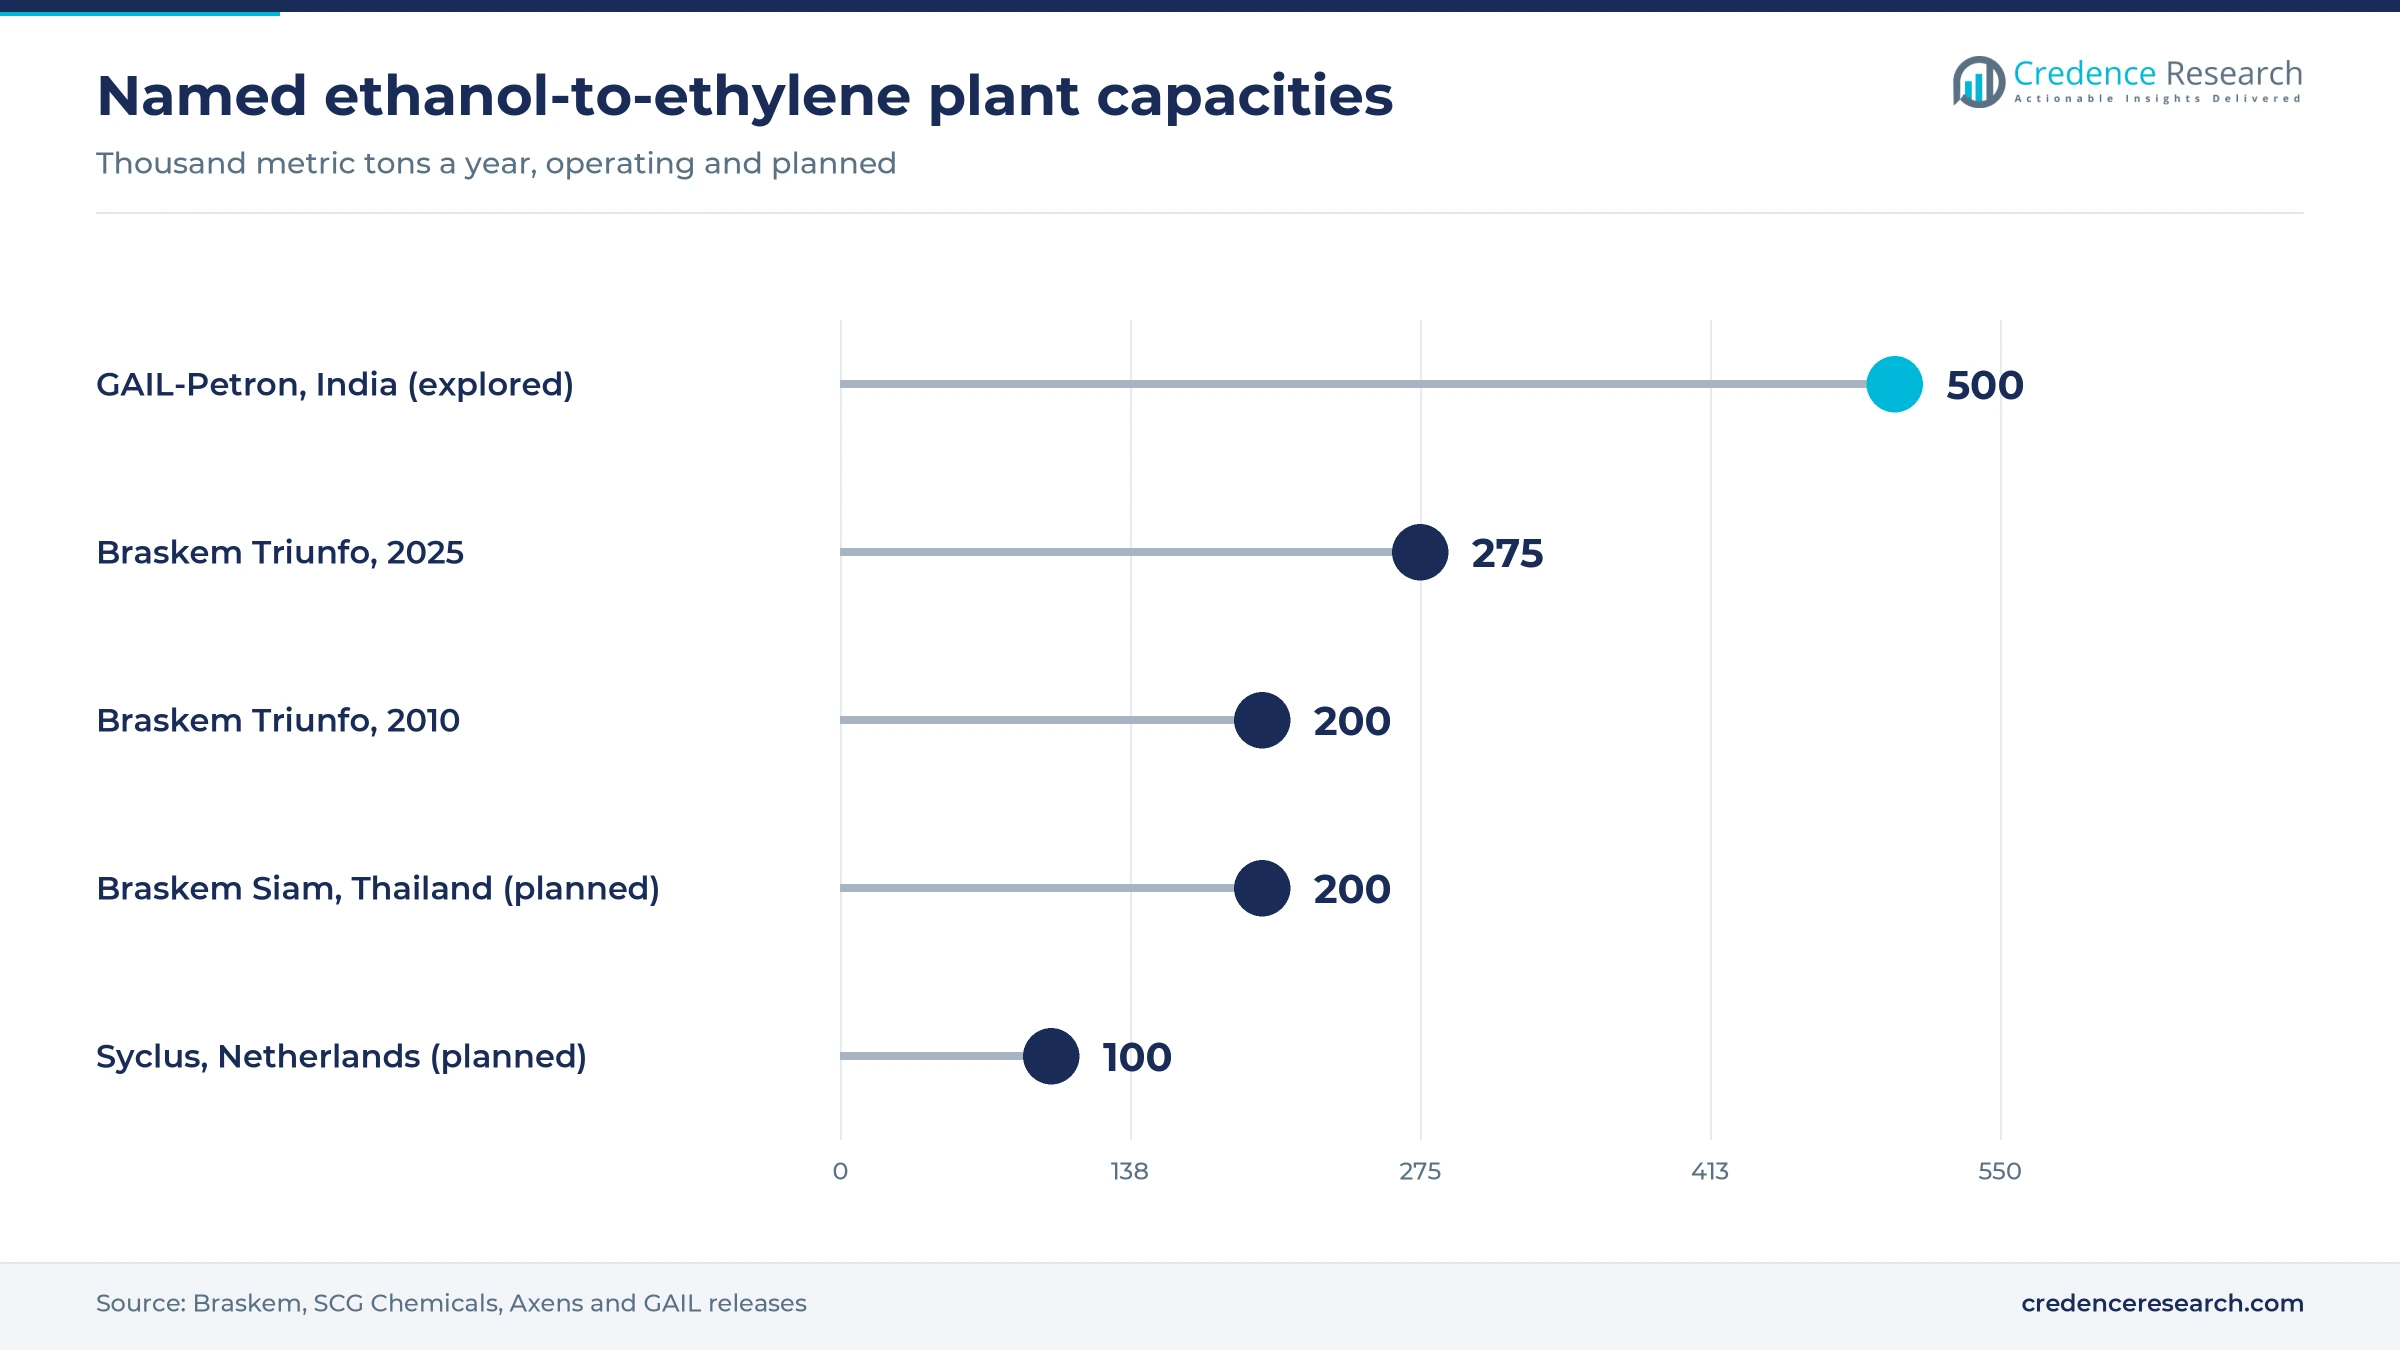
- Braskem said in May 2025 that its Triunfo green ethylene unit runs above its 275,000-ton nameplate capacity after the 2023 expansion.
- Braskem Siam plans to decide by the end of 2026 on a 200,000-ton bio-ethylene plant in Thailand, the first dedicated unit of its kind in Asia.
Sugar feedstock and packaging lead, starch grows fastest
Why do sugars lead while starch feedstock grows fastest?
Based on raw material, the market is categorized into sugars, starch and lignocellulosic biomass and residues. Sugars led with 66.0% of 2025 value because the largest plant runs on sugarcane ethanol, and Tetra Pak said in 2019 that its Braskem supply rests on fully Bonsucro-certified sugarcane ethanol. Starch grows fastest at 7.7% a year as corn ethanol gains share in Brazil, where output reached 10.17 billion liters in 2025/26, up 29.8%, according to Conab. The planned Thai plant also lists cassava and corn among its feedstocks.
Why does dehydration lead while gas fermentation routes grow fastest?
Based on production route, the market is categorized into ethanol dehydration, bio-naphtha cracking with mass-balance attribution, and emerging routes such as gas fermentation and CO2 conversion. Ethanol Dehydration led with 79.0% of 2025 value because it yields ethylene that is fully renewable and traceable by radiocarbon tests, as at the Triunfo unit. Emerging Routes (Gas Fermentation and CO2) grow fastest at 9.2% a year from a tiny base, as the U.S. Department of Energy selected LanzaTech and Technip Energies in March 2024 for award talks of up to USD 200 million on a CO2-to-ethylene unit.
Why does packaging lead while detergents grow fastest?
Based on application, the market is categorized into packaging, detergents and surfactants, and additives, lubricants and others. Packaging led with 70.0% of 2025 value because brand owners pay for drop-in polyethylene, and Mondi presented a pouch concept with at least 98% bio-based polyethylene at Interpack 2026. Detergents and Surfactants grow fastest at 7.2% a year as Indian producers turn ethanol into renewable ethylene oxide, and the Clariant IGL joint venture in Kashipur began making renewable ethylene oxide derivatives in July 2021 for home and personal care.
| Segment Group | Leading Sub-segment | Share, 2025 | Fastest-growing Sub-segment | CAGR, 2026–2035 |
|---|---|---|---|---|
| By Raw Material | Sugars | 66.0% | Starch | 7.7% |
| By Production Route | Ethanol Dehydration | 79.0% | Emerging Routes (Gas Fermentation and CO2) | 9.2% |
| By Application | Packaging | 70.0% | Detergents and Surfactants | 7.2% |
Ethanol cost and certified carbon set the price
Bio-based ethylene is priced from the cost of ethanol rather than from fossil ethylene benchmarks, because roughly 1.7 metric tons of ethanol are needed for each ton of ethylene. That puts feedstock alone well above the price of naphtha or ethane ethylene, so producers sell on long-term contracts that carry a green premium. The premium rises when fossil ethylene weakens, which squeezes buyers that compare both on price. Contract prices are not published, and the ranges below are Credence Research estimates with wide error bands.
| Input or product | Typical price or fee | Basis |
|---|---|---|
| Hydrated ethanol, Sao Paulo mills | R$2.8554 per liter, excluding taxes | Cepea, week of Nov. 17-21, 2025 |
| Ethanol cost per ton of bio-based ethylene | About USD 1,100-1,250 per metric ton | Credence Research estimate from Cepea prices and dehydration yield |
| Bio-based ethylene, ethanol route | About USD 1,500-1,900 per metric ton | Credence Research estimate from feedstock and conversion cost |
| Fossil ethylene, Northwest Europe spot | Down EUR 290 per metric ton in 2025 | S&P Global Platts data, December 2025 |
Request a Free Sample
Fill in your details and we'll send you a free sample report.
- Sample data tables & charts
- Research methodology
Brand specifications, cheap Brazilian ethanol and EU policy
Brand owners write renewable carbon into packaging specs
Packaging specifications that require measurable renewable carbon are the main demand mechanism, because bio-based ethylene becomes polyethylene that runs on existing film, cap and bottle lines without new equipment. Tetra Pak said in November 2019 that it gained Bonsucro chain-of-custody certification for plant-based polymers supplied by Braskem for its carton closures. Balsam Hill said in October 2025 that each needle of its new artificial trees holds 95% bio-based carbon, measured by C14 testing. Braskem lists a cradle-to-gate footprint of minus 2.27 kg CO2e per kg for a renewable LDPE healthcare grade shown at Interpack 2026. Converters selling plant-based packaging gain buyers that need a figure for their Scope 3 reports, while the ethylene producer captures the premium.
Record Brazilian ethanol output keeps the main feedstock available
Feedstock availability decides how much ethanol-route ethylene can be made, because Brazil hosts the only large dedicated plant and its ethanol competes with fuel demand. Brazil produced 37.5 billion liters of ethanol in 2025/26, the largest volume in the Conab series, as corn ethanol offset a 6.9% drop in cane ethanol. Braskem said in May 2025 that its Triunfo unit runs above its 275,000-ton nameplate after the expansion completed in 2023. Its commercial director for biopolymers told S&P Global in September 2025 that the company aims for 1 million tons of bio-based polymers a year by 2030. Producers with secure cane and corn supply can therefore expand without importing feedstock.
EU and Japanese targets add a policy pull to voluntary demand
Government targets are starting to turn voluntary purchases into planned volumes, because bio-based content that a regulation counts is easier to budget than a marketing claim. The European Commission adopted a new Bioeconomy Strategy in November 2025 that proposes demand targets for bio-based content in relevant legislation. European Bioplastics said the plan commits the Commission to criteria and targets for bio-based plastics under the packaging regulation in 2027, and to a buyer alliance aiming to pool up to EUR 10 billion of demand by 2030. Japan's Roadmap for Bioplastics Introduction of January 2021 seeks about 2 million tons of bio-based plastics by 2030. Suppliers with certified volumes in Europe and Japan stand to gain first.
Indian ethylene oxide makers convert ethanol into surfactants
Ethanol-based ethylene oxide gives a second outlet beyond polyethylene, because detergent and personal care makers can label surfactants as renewable without changing formulations. India Glycols makes green ethylene oxide and monoethylene glycol from bio-ethanol, and Shell Catalysts and Technologies reported in November 2021 that its S-889 catalyst reached 92% selectivity in that unit. The Clariant IGL joint venture, 51% to 49%, took effect in July 2021 to make renewable ethylene oxide derivatives in Kashipur. India produced 661.1 crore liters of fuel ethanol by June 2025, up from 38 crore liters in 2014, according to All India Radio. Surfactant makers in South Asia gain a local renewable input, although fuel blending competes for the same ethanol.
Mass-balance cracking, licensing and new Asian capacity
Fossil crackers shift to mass-balance bio-attribution
Large cracker operators are shifting toward bio-naphtha and waste-oil feedstock with mass-balance accounting, which lets them sell bio-attributed ethylene derivatives without building a dedicated plant. Dow said in September 2019 that it uses UPM BioVerno naphtha made from crude tall oil at Terneuzen under an ISCC mass-balance chain. LyondellBasell agreed in June 2021 to source Neste RE feedstock, made from 100% renewable raw materials, for its Wesseling cracker. SABIC describes bio-renewable polyethylene made from used cooking oil in its 2024 integrated report. A European Commission draft act of July 2025 would formalize mass balance at crackers, S&P Global reported. However, LyondellBasell cut its 2030 target for recycled and renewable polymers to 800,000 tons from 2 million tons, so attributed volumes may stay small.
Ethanol-to-ethylene licensing spreads beyond one producer
Technology licensors are shifting dehydration know-how into the open market, creating openings for ethanol producers and petrochemical firms that want their own renewable ethylene. Axens said in May 2022 that the first plant using its Atol process, a pilot for Sumitomo Chemical in Japan, reached its guaranteed performance. Syclus chose Atol in July 2023 for a planned 100,000-ton plant at Chemelot in Geleen, the Netherlands, with an estimated cost above EUR 130 million. Technip Energies' Hummingbird process sits inside the LanzaTech project selected by the U.S. Department of Energy in March 2024 for up to USD 200 million, and Lummus signed a memorandum in November 2021 to license Braskem's green ethylene process. Licensing lowers the entry barrier, but each project still needs secure ethanol supply and committed buyers.
A Thai plant opens Asian supply for regional converters
The planned Braskem Siam plant opens a regional supply option for Asian converters that now import bio-polyethylene from Brazil. SCG Chemicals said in December 2025 that the 200,000-ton project holds investment promotion from Thailand's Board of Investment and was selected for the Thailand FastPass measure, with a final investment decision then targeted for the second quarter of 2026. SCG Chemicals said in March 2025 that Mitr Phol Bio Fuel signed a letter of intent to supply ethanol to the Map Ta Phut site, against plant demand of more than 450 million liters a year. Converters in Japan, Korea and Southeast Asia could cut shipping time and secure regional supply.
India offers a large opening if feasibility work succeeds
India offers the largest untapped opening, because its ethanol base and polymer demand could support a plant on a scale close to the current global leader. GAIL and Petron Scientech signed a non-binding memorandum in August 2024 to explore a 500,000-ton bio-ethylene plant with downstream units, as a 50:50 joint venture. The partners will run feasibility studies before seeking investment approval, so no decision has been made. India reached 20% ethanol blending in petrol in 2025, five years ahead of its 2030 target, according to All India Radio. Indian packaging and HDPE resin buyers would gain local renewable supply if the project proceeds, although fuel blending competes for ethanol.
Green premiums, cheap fossil ethylene and ethanol pull
Voluntary demand limits what buyers will pay
Demand rests almost entirely on voluntary purchases, which caps the premium producers can charge. A producer told S&P Global in September 2025 that there is very little interest in bio-ethylene because it always comes at a premium. Bioplastics hold about 0.7% of the global plastics market, Plastics Europe data cited in the same report show. European producers offering spot bio-ethylene are most exposed, while suppliers with multiyear brand contracts face less pressure until those contracts reset.
Cheap fossil ethylene widens the green price gap
Weak fossil ethylene prices widen the gap that buyers must justify. Northwest Europe ethylene spot prices fell by EUR 290 per metric ton from early January to mid-December 2025, S&P Global Platts data show. New Asian and Middle Eastern capacity of about 6 million tons a year is due in 2026, which keeps pressure on fossil prices. Brand owners with cost-led buyers are most likely to cut renewable volumes, while those with public carbon targets keep buying.
Fuel mandates compete for the ethanol feedstock
Higher fuel blending mandates compete directly with ethylene producers for ethanol. Brazil raised its gasoline blend from 27% to 30% from Aug. 1, 2025, Biodiesel Magazine reported. Cepea data show hydrated ethanol at Sao Paulo mills at R$2.8554 per liter in late November 2025, the highest nominal level since April 2023. Producers that buy ethanol on the spot market are most exposed, while integrated sugar and ethanol groups can hedge part of the cost.
Concentrated supply leaves buyers with few options
Supply depends heavily on one company and a short project list, which concentrates risk for buyers. Braskem's fossil crackers in Brazil ran at 72% utilization in 2024, which ties the world's main renewable supply to the finances of one stretched group. Braskem Idesa, the group's Mexican venture, did not make a Feb. 20, 2026, interest payment on its notes due 2032, according to a Braskem filing. Brand owners with single-source contracts are most exposed and are likely to add mass-balance supply as a second source.
Europe buys the most while Asia Pacific grows fastest
| Region | Value, 2025 (USD million) | Share, 2025 | CAGR, 2026–2035 |
|---|---|---|---|
| Europe | 184.0 | 30.0% | 5.4% |
| Asia Pacific | 153.3 | 25.0% | 7.5% |
| North America | 122.7 | 20.0% | 5.8% |
| Latin America | 119.6 | 19.5% | 6.4% |
| Middle East & Africa | 33.7 | 5.5% | 6.5% |
Europe leads on brand demand and mass-balance crackers
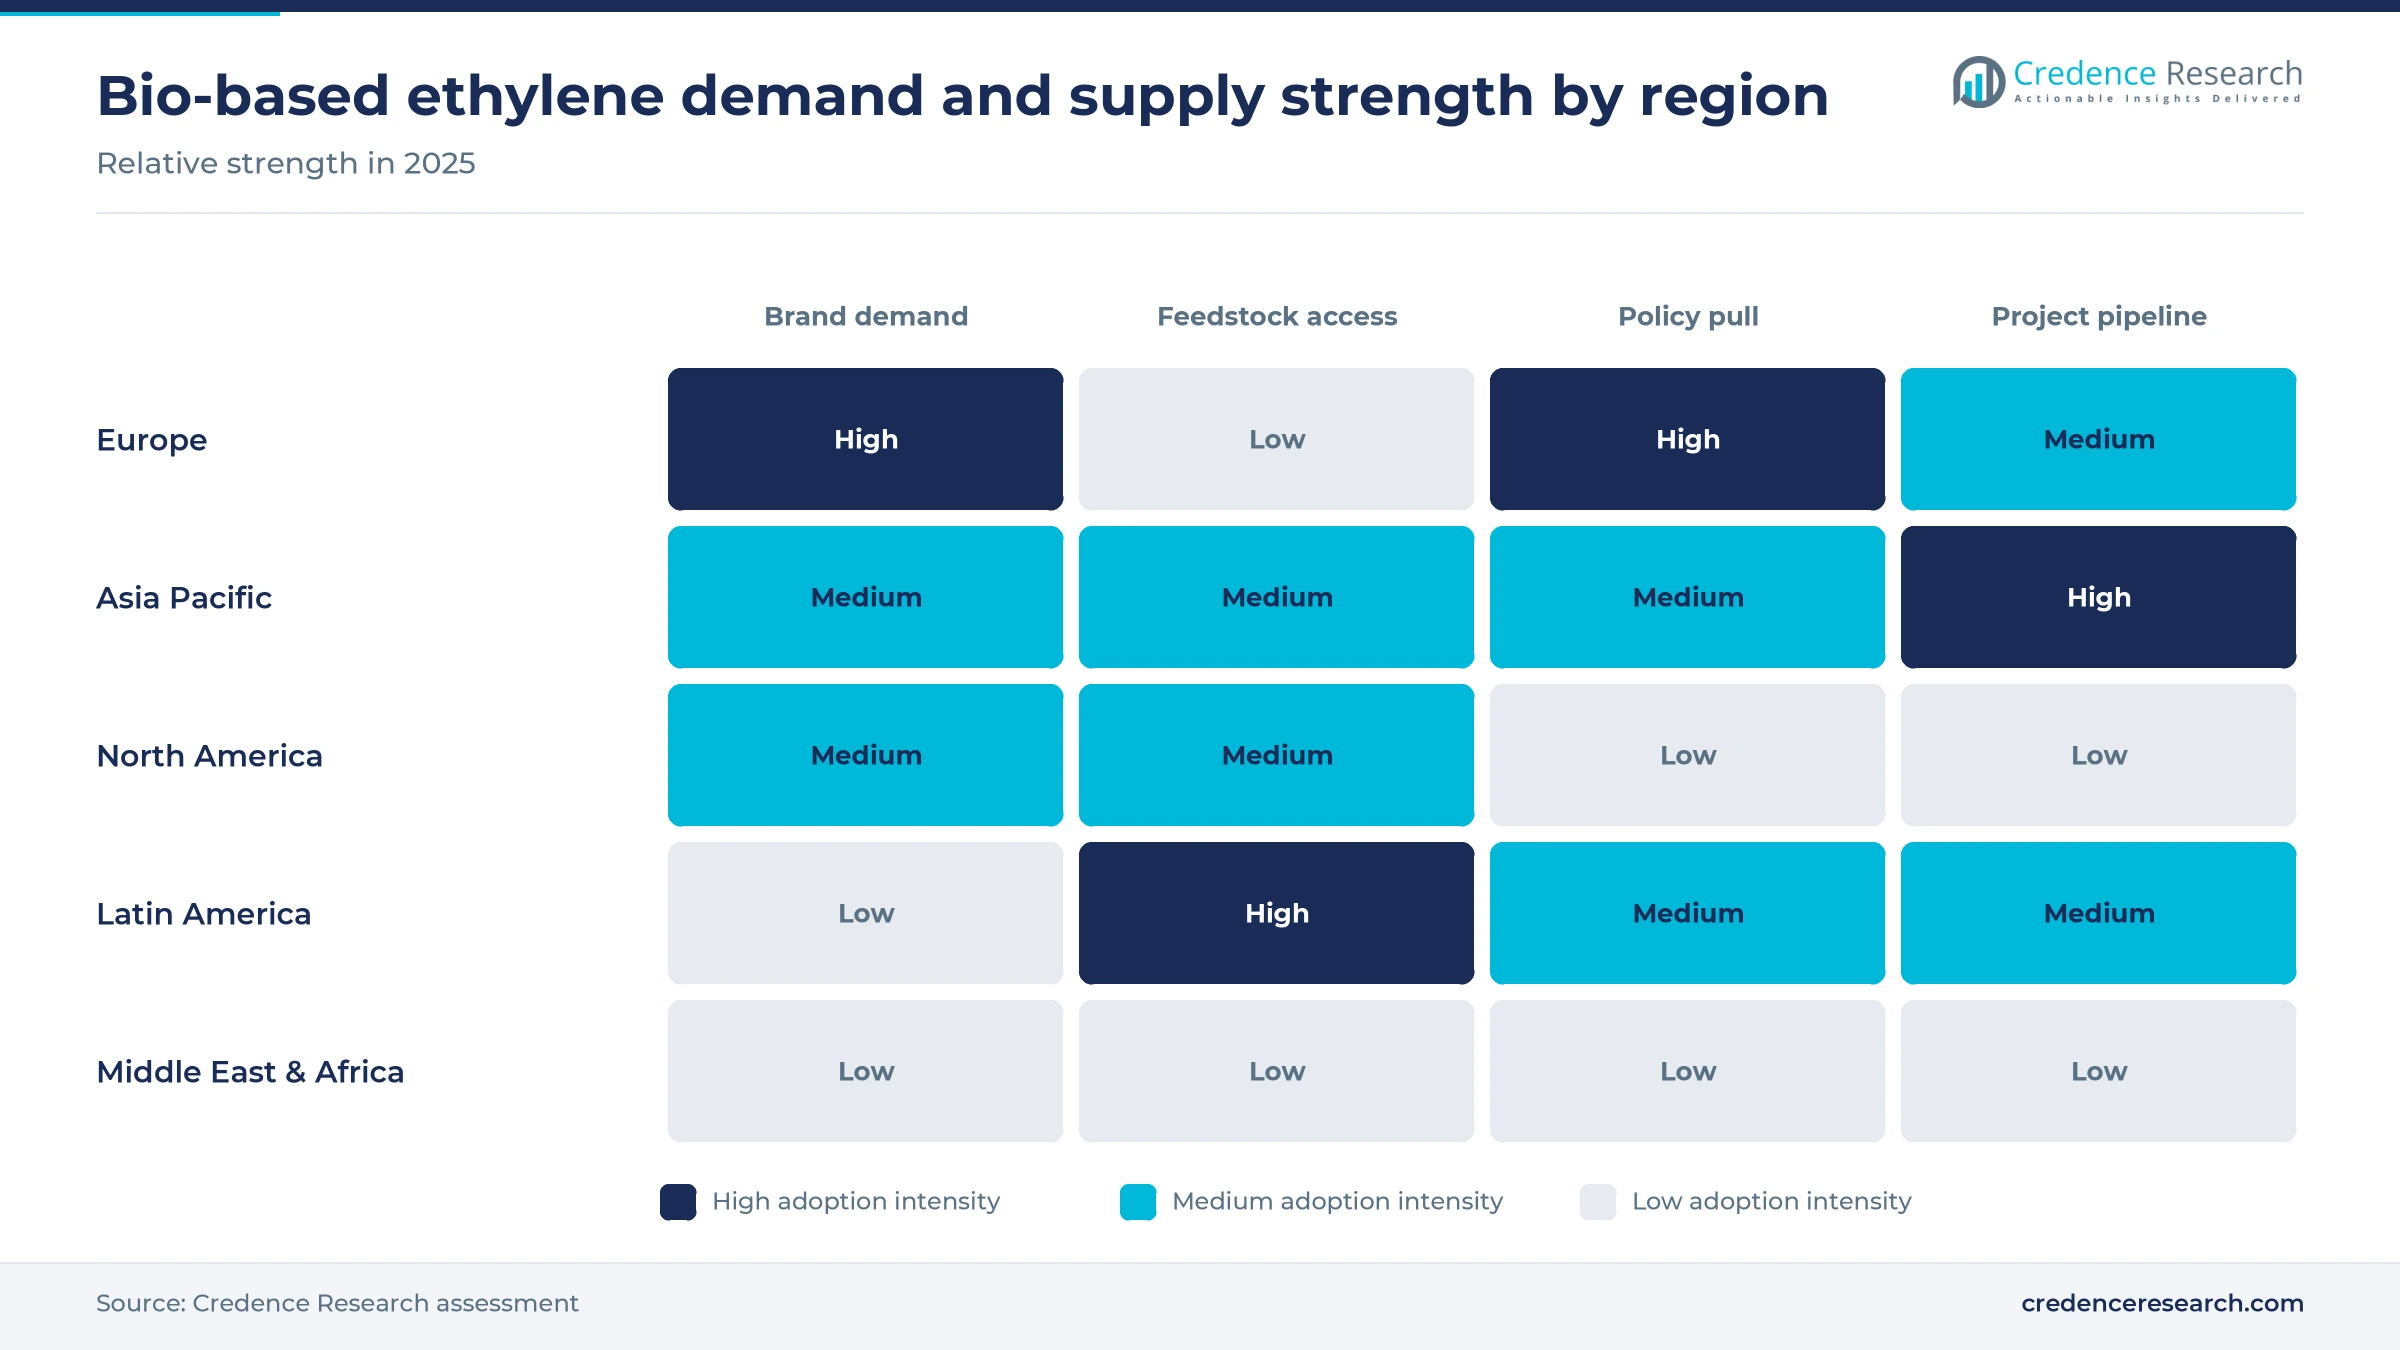
Europe held 30.0% of 2025 value and grows at 5.4% a year, the slowest rate, because carton, food and cosmetics brands buy most certified renewable polyethylene while local production remains small. Dow's Terneuzen and LyondellBasell's Wesseling crackers supply bio-attributed volumes from tall oil and waste-oil feedstock. The only announced dedicated European unit, Syclus' 100,000-ton plant at Geleen, has slipped toward 2030, so mass-balance crackers remain the region's main local source. The 2027 packaging criteria noted above are the main factor that could lift European volumes.
Asia Pacific grows fastest on Thai and Indian projects
Asia Pacific held 25.0% of 2025 value and grows fastest at 7.5% a year, because Japan's bio-based plastics target, India's ethanol-based ethylene oxide and the Thai plant all add demand or supply. SCG Chemicals said in December 2025 that the Thai plant could cut net CO2 emissions by up to one million tons a year. Braskem Siam plans to decide by the end of 2026 whether to build, TimesBrasil reported in September 2026, so most of the regional upside still depends on that decision.
North America buys imports while CO2 routes stay at pilot stage
North America held 20.0% of 2025 value and grows at 5.8% a year, because consumer brands buy imported bio-polyethylene while no dedicated bio-ethylene plant operates in the region. U.S. ethane cracker margins fell to a two-year low of 8.81 cents per pound in November 2025, S&P Global Platts data show, which keeps fossil ethylene cheap. The LanzaTech project has no confirmed host site, so local supply depends on a later decision. Public data on regional bio-ethylene use are thin, and this share carries a wide error range.
Latin America hosts the leading plant and its feedstock
Latin America held 19.5% of 2025 value and grows at 6.4% a year, because Brazil hosts the Triunfo plant and the ethanol that feeds it, although most output is exported to more than 70 countries. Brazil crushed 673.2 million tons of cane in 2025/26, the third-largest harvest in the Conab series, and Braskem plans a 220,000-ton fossil ethylene expansion at its Rio de Janeiro site between late 2027 and early 2028. Brazilian converters buy only part of the renewable grades, so regional value stays below output.
Middle East & Africa remains a small importer
Middle East & Africa held 5.5% of 2025 value and grows at 6.5% a year, because demand comes mainly from imported renewable polyethylene used by multinational packaging and personal care brands. SABIC holds ISCC PLUS certification for several Saudi assets, but its integrated report links them to pyrolysis oil rather than bio-based feedstock. No bio-ethylene plant was identified in the region, so the estimate rests on import patterns and carries a wide error range.
Thai fast-tracking, Indian talks and European delays
| Development | Status and market relevance |
|---|---|
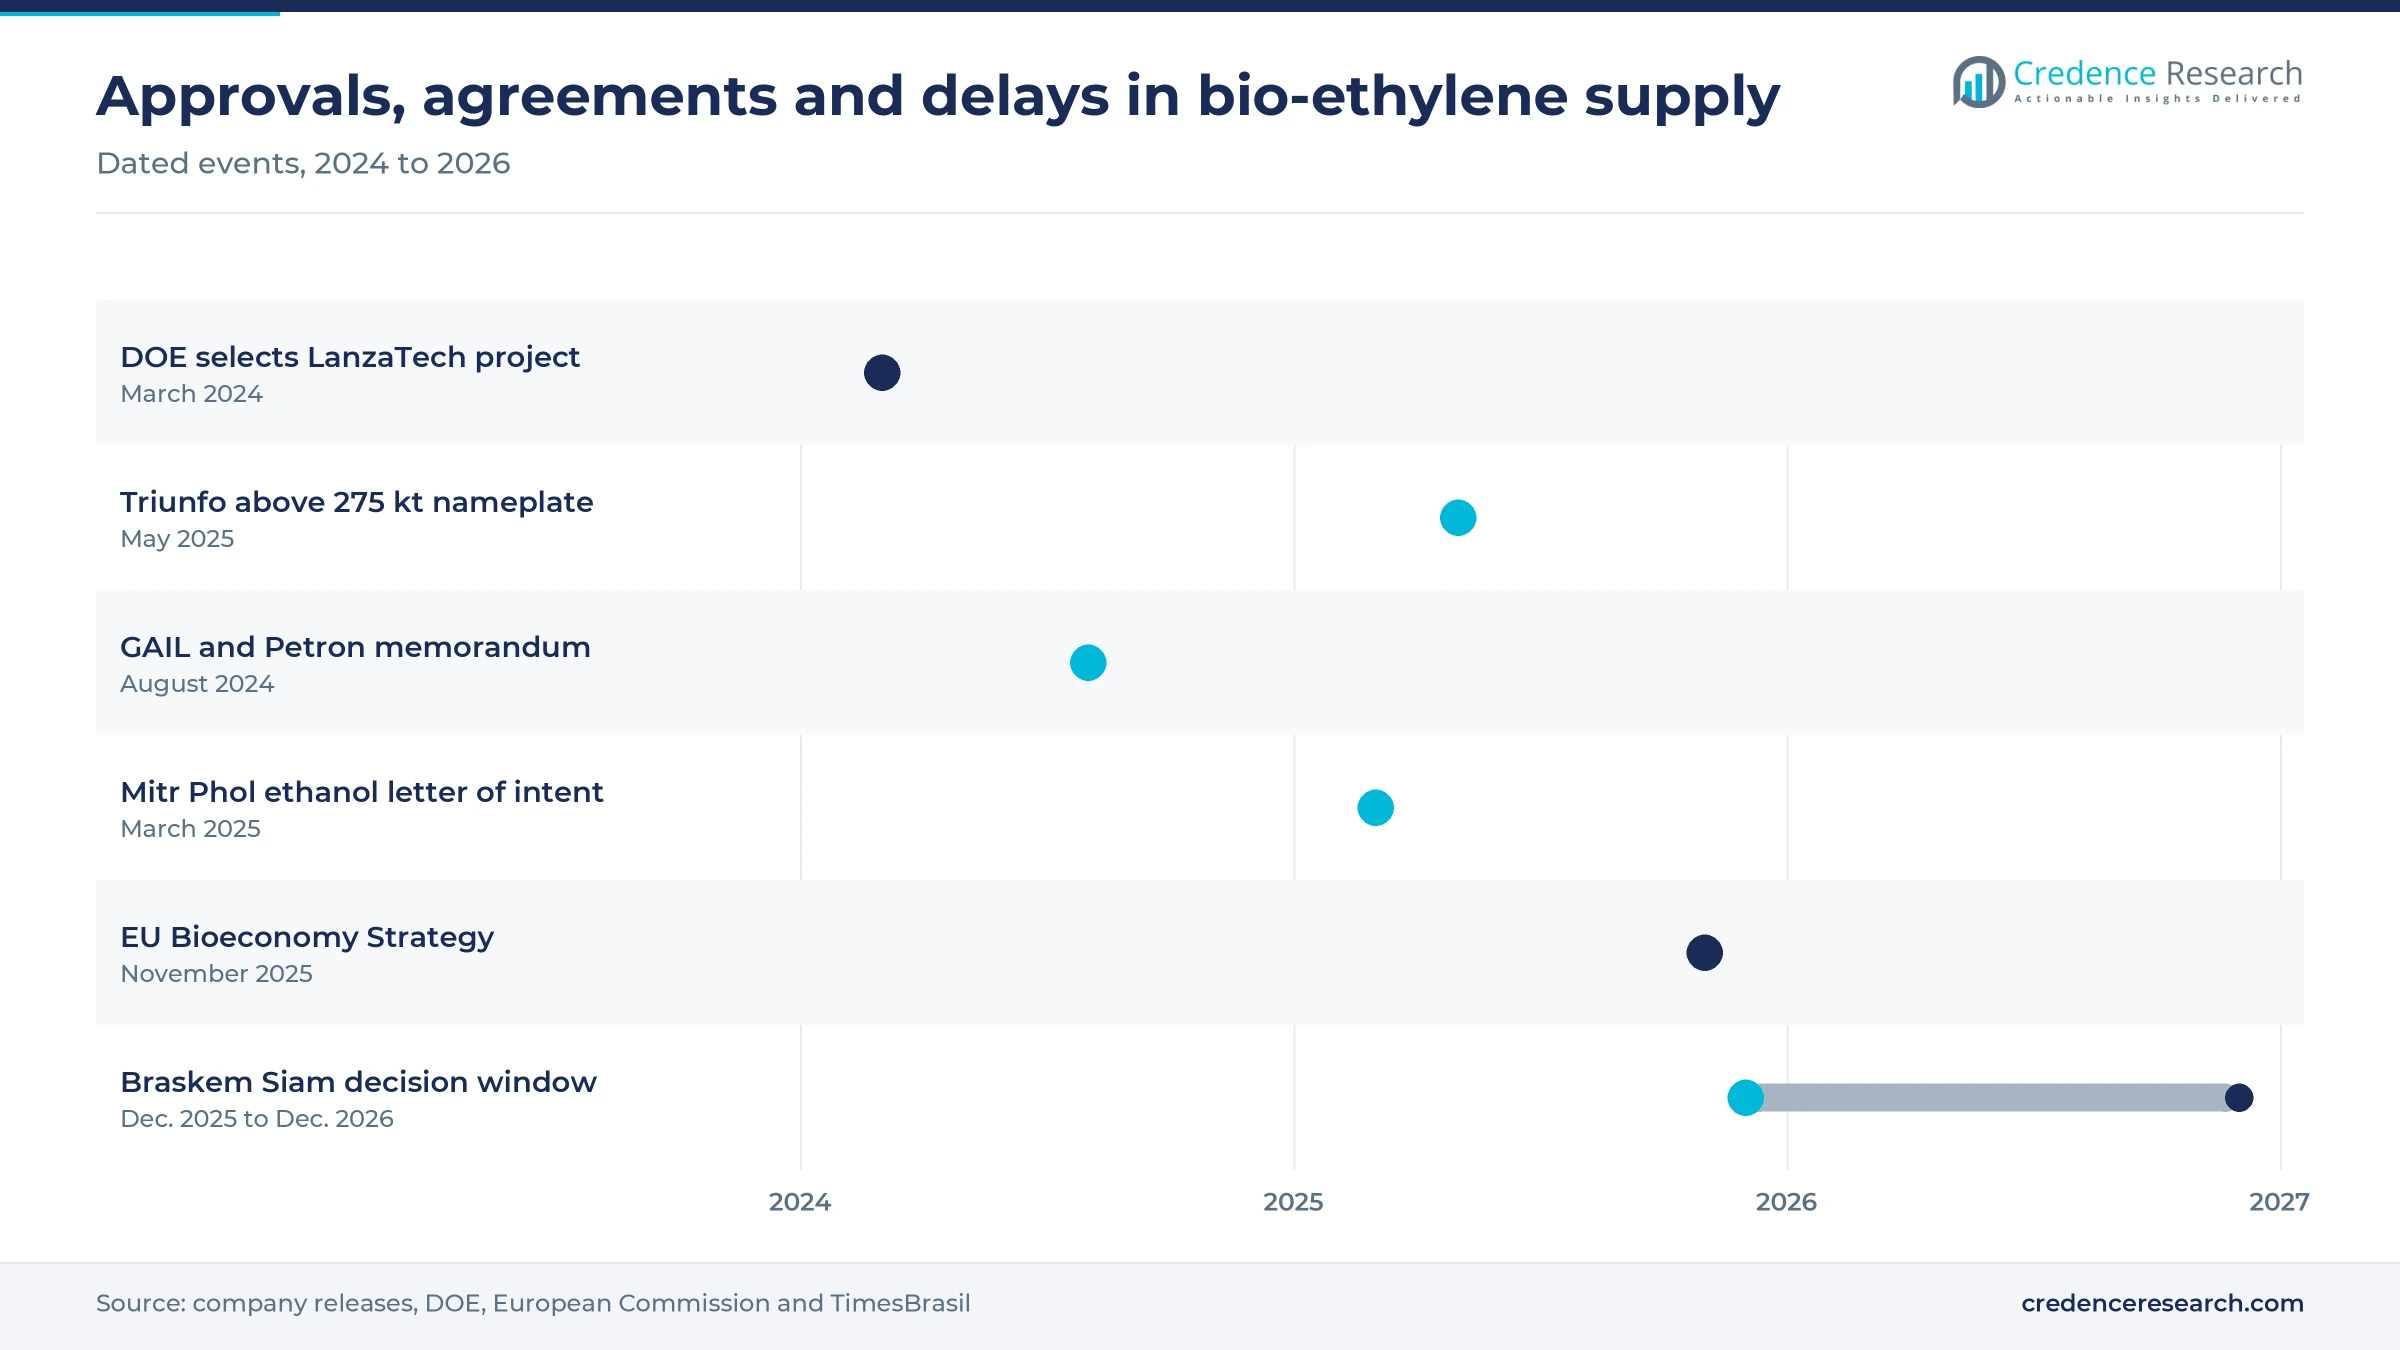
| In May 2025, Braskem said its Triunfo green ethylene unit in Brazil was running above its 275,000-ton nameplate capacity after the expansion completed in 2023. | Operating at expanded capacity; it remains the only large dedicated bio-ethylene plant in service. |
| In August 2024, GAIL and Petron Scientech signed a non-binding memorandum to explore a 500,000-ton bio-ethylene plant in India as a 50:50 joint venture. | Memorandum at feasibility stage; no investment approval has been given by either partner. |
| In March 2025, Braskem Siam signed a letter of intent with Mitr Phol Bio Fuel for the supply of agricultural ethanol for the Thai plant. | Letter of intent; it addresses the plant's main cost input but sets no agreed volume. |
| In December 2025, SCG Chemicals said the Braskem Siam project was selected for the Thailand FastPass measure, with a final investment decision targeted for the second quarter of 2026. | Fast-track selection; by September 2026 the decision had moved to the end of 2026. |
| In February 2026, Argus reported that Syclus' 100,000-ton ethanol-to-ethylene plant in Geleen was more likely to be completed in 2030 than in 2026. | Delayed plan; European buyers must wait longer for a second dedicated ethanol-route source. |
Dehydration, bio-naphtha cracking and carbon tracing
- Ethanol dehydration removes water from ethanol over a catalyst at high temperature, giving fully renewable ethylene that existing polymer and ethylene oxide units can process.
- Bio-naphtha cracking with mass balance feeds renewable naphtha or waste oils into a fossil cracker and assigns the bio-content to selected products under ISCC PLUS rules.
- Radiocarbon testing measures the share of modern carbon in a resin or article, which lets brands prove bio-based content in a way mass balance cannot.
- Gas fermentation and CO2 conversion turns captured carbon gases into ethanol for later dehydration, a route that remains at the demonstration stage.
Need a Custom Version of This Report?
Tailor the scope, geography, or segments to your exact requirements.
- Custom geography or segment scope
- Direct access to our analyst team
One dedicated plant faces mass-balance cracker rivals
Competition turns on ethanol cost, certified traceability and long-term brand offtake rather than on spot price. Braskem runs the largest dedicated plant and sells the output as I'm green bio-based polyethylene and EVA, a range that marked 15 years in 2025 and reaches customers in more than 70 countries. India Glycols uses its own ethanol to make green ethylene oxide and glycols, which gives it a captive outlet that does not depend on polyethylene premiums. Dow, LyondellBasell and SABIC compete through mass-balance bio-attributed grades made in existing crackers. Technology licensors such as Axens, Technip Energies and Lummus shape who can enter, but they do not sell ethylene themselves. SCG Chemicals would become a sixth supplier if the Braskem Siam plant is built. The five companies profiled below cover dedicated and mass-balance supply.
How is supply organized and where do margins sit?
Supply in this market splits into two producer groups with very different economics. Dedicated ethanol-route producers, led by Braskem in Brazil and India Glycols for captive ethylene oxide, carry high feedstock costs but sell fully renewable product at a premium. Fossil cracker operators such as Dow, LyondellBasell and SABIC buy bio-naphtha or waste-oil feedstock and assign bio-content by mass balance, which needs little capital. Entry barriers sit in ethanol access, process licensing and long-term brand offtake. Margins are highest where a producer converts its own ethylene into certified resin.
Companies profiled and their roles in this market
| Company | Type | Role in the market |
|---|---|---|
| Braskem S.A. | Dedicated producer | Makes sugarcane-based ethylene at Triunfo and sells I'm green polyethylene and EVA |
| India Glycols Limited | Integrated producer | Converts its own bio-ethanol into ethylene oxide and glycols in India |
| SABIC | Mass-balance producer | Sells bio-renewable polyethylene attributed from used cooking oil feedstock |
| LyondellBasell Industries N.V. | Mass-balance producer | Cracks Neste renewable feedstock at Wesseling for CirculenRenew polymers |
| Dow Inc. | Mass-balance producer | Uses tall oil-based naphtha at Terneuzen for bio-based polyethylene |
Ethanol cost and offtake contracts decide the winners
Credence Research's view is that ethanol cost and offtake contracts, more than technology, will decide which producers earn margin in this market. Demand is real but voluntary, and fossil ethylene is cheap, so producers need brand contracts before they build. The Thai decision is the single largest swing factor for supply to 2035. Buyers that rely on one producer should qualify a mass-balance second source now, while producers with their own ethanol are best placed when EU criteria arrive in 2027.
Earlier estimate rolled forward and tested on capacity
The report uses 2025 as the base year and forecasts to 2035. The earlier Credence Research estimate for 2024 was rolled forward one year at its own growth rate and tested against an estimate of operating capacity multiplied by feedstock-based prices. Regional and segment shares are Credence Research estimates based on plant locations, brand demand, ethanol supply and project status. Sources include Conab, the European Commission, the Japanese Ministry of the Environment, company releases and trade press. No interviews or surveys were conducted for this update of the estimate.
The Thai plant decides how fast supply grows to 2035
Growth to 2035 depends on new dedicated capacity in Asia and on whether European criteria turn voluntary demand into planned volumes. The base case assumes the Thai plant starts near the end of the decade and that ethanol prices stay firm as fuel mandates rise. Mass-balance supply should grow more slowly after the cuts to company targets. Packaging should remain the main outlet, while renewable ethylene oxide for surfactants adds a faster-growing second use. India remains the main upside region if feasibility work turns into a plant.
The Thai decision and ethanol prices set the range
The spread of outcomes rests mainly on whether the Thai plant reaches a final investment decision and on how far fuel mandates lift ethanol prices. A cancelled or delayed Thai project would leave supply growth to mass-balance crackers, whose volumes are uncertain. Binding EU packaging criteria from 2027 and a go-ahead for the Indian project are the main upside factors.
| Scenario | CAGR, 2026–2035 | Value, 2035 | What has to hold |
|---|---|---|---|
| Downside | 4.5% | USD 968.9 million | Thai plant is shelved and ethanol stays costly as fuel mandates rise |
| Base | 6.30% | USD 1.13 billion | Thai plant starts near the end of the decade and EU criteria stay voluntary |
| Upside | 7.7% | USD 1.27 billion | EU sets binding bio-based targets in 2027 and the Indian project proceeds |
Frequently Asked Questions
How big is the bio-based ethylene market?
Which application uses the most bio-based ethylene?
Which region leads the bio based ethylene market?
What role does Brazil play in the ethylene market?
How is bio-based ethylene made?
Who are the main bio-based ethylene producers?
What restrains the bio-based ethylene market?
When could new bio-ethylene capacity start in Asia?
Table of Content
Chapter 1 Market Segmentation
- 1.1 Segmentation Framework
- 1.1.1 Product and Service Classification
- 1.1.2 Application and End-Use Classification
- 1.1.3 Technology and Solution Classification
- 1.1.4 Customer and Distribution Channel Classification
- 1.1.5 Geographic Segmentation
- 1.1.6 Market Segment Definitions and Boundaries
- 1.2 By Raw Material
- 1.2.1 Sugars
- 1.2.2 Starch
- 1.2.3 Lignocellulosic Biomass and Residues
- 1.3 By Production Route
- 1.3.1 Ethanol Dehydration
- 1.3.2 Bio-Naphtha Cracking (Mass Balance)
- 1.3.3 Emerging Routes (Gas Fermentation and CO2)
- 1.4 By Application
- 1.4.1 Packaging
- 1.4.2 Detergents and Surfactants
- 1.4.3 Additives, Lubricants and Others
Chapter 2 Introduction
- 2.1 Report Objectives and Scope
- 2.2 Product Definition and Industry Terminology
- 2.3 Market Inclusions and Exclusions
- 2.4 Research Process
- 2.4.1 Primary Research and Expert Interviews
- 2.4.2 Secondary Research and Source Review
- 2.4.3 Top-Down and Bottom-Up Estimation
- 2.4.4 Data Triangulation and Verification
- 2.5 Market Size Measurement Basis
- 2.5.1 2025: USD 613.4 million → 2035: USD 1.13 billion
- 2.6 Historical and Forecast Reference Periods
- 2.6.1 Historical Period: 2018-2025
- 2.6.2 Base Year: 2025
- 2.6.3 Forecast Period: 2025-2035
- 2.7 Research Assumptions and Limitations
Chapter 3 Executive Summary
- 3.1 Market Snapshot and Key Findings
- 3.2 Base-Year Market Size, 2025
- 3.3 Forecast Market Size, 2035
- 3.4 Revenue and Volume Growth Outlook
- 3.5 Key Demand and Supply Indicators
- 3.6 Leading Market Segments
- 3.7 Fastest-Growing Market Opportunities
- 3.8 Regional Performance Highlights
- 3.9 Technology and Industry Transformation
- 3.10 Competitive Landscape Summary
- 3.11 Analyst View and Strategic Implications
Chapter 4 Global Bio Based Ethylene Market Trends and Developments
- 4.1 Historical Industry Development, 2018-2025
- 4.2 Recent Market Trends and Developments
- 4.3 Demand and Customer Behavior Trends
- 4.4 Technology and Product Innovation
- 4.5 Artificial Intelligence, Automation and Digitalization
- 4.6 Local Manufacturing and Supply Chain Realignment
- 4.7 Industry Partnerships, Mergers and Acquisitions
- 4.8 Sustainability and Circular Economy Developments
- 4.9 Government and Private Sector Investment Trends
- 4.10 Emerging Business Models and Commercialization
- 4.11 Industry Developments and Announcements
Chapter 5 Global Bio Based Ethylene Market Production, Supply and Demand Analysis
- 5.1 Demand Trend and Consumption Analysis, 2018-2025
- 5.2 Demand Forecast, 2025-2035
- 5.3 Production and Output Trend, 2018-2025
- 5.4 Production and Output Forecast, 2025-2035
- 5.5 Installed Capacity and Capacity Utilization
- 5.6 Company-Wise Production Plants and Statistics
- 5.6.1 Installed Production Capacity
- 5.6.2 Actual Production
- 5.6.3 Planned Capacity and Expansion Targets
- 5.7 Supply Chain Structure and Procurement Trends
- 5.8 Supply-Demand Gap and Bottlenecks
- 5.9 Import Dependence and Sourcing Structure
- 5.10 Contract Manufacturing and Outsourcing
- 5.11 Regional Supply and Demand Concentration
Chapter 6 Global Bio Based Ethylene Market Pricing Analysis
- 6.1 Pricing Structure and Measurement
- 6.2 Historical Pricing Trends, 2018-2025
- 6.3 Pricing Outlook, 2025-2035
- 6.4 Average Selling Price and Unit Economics
- 6.5 Pricing by Product and Market Segment
- 6.6 Geographic Pricing Differences
- 6.7 Key Input, Energy, Labor and Logistics Costs
- 6.8 Contract Pricing and Purchasing Models
- 6.9 Pricing Sensitivity and Competitive Positioning
- 6.10 Price, Margin and Profitability Implications
Chapter 7 Global Bio Based Ethylene Market Dynamics
- 7.1 Market Growth Drivers
- 7.1.1 Demand-Side Drivers
- 7.1.2 Technology and Innovation Drivers
- 7.1.3 Infrastructure and Investment Drivers
- 7.1.4 Regulatory and Policy Drivers
- 7.2 Market Restraints
- 7.2.1 Cost and Affordability Constraints
- 7.2.2 Technology and Adoption Barriers
- 7.2.3 Supply Chain and Operational Constraints
- 7.3 Market Challenges
- 7.3.1 Competitive Pressure and Margin Erosion
- 7.3.2 Skills, Infrastructure and Implementation Gaps
- 7.4 Emerging Market Opportunities
- 7.5 Market Dynamics Impact and Time-Horizon Assessment
Chapter 8 Global Bio Based Ethylene Value Chain Analysis
- 8.1 Industry Value Chain Overview
- 8.2 Upstream Suppliers and Critical Inputs
- 8.3 Technology and Component Providers
- 8.4 Manufacturing or Service Delivery
- 8.5 Distribution, Channel Partners and Integrators
- 8.6 Downstream Applications and End Users
- 8.7 Value Addition and Profit Pools
- 8.8 Vertical Integration and Outsourcing
- 8.9 Supplier Concentration and Risk
- 8.10 Supply Chain Localization and Resilience
Chapter 9 Global Bio Based Ethylene Market Regulations and Policies
- 9.1 Relevant Laws, Standards and Compliance Frameworks
- 9.2 Product, Service, Safety and Quality Requirements
- 9.3 Government Policies, Incentives and Subsidies
- 9.4 Imports, Exports and Trade Barriers
- 9.5 Public Procurement and Local Content Requirements
- 9.6 Environmental and Sustainability Compliance
- 9.7 Upcoming Policy Changes and Market Implications
Chapter 10 Global Bio Based Ethylene Market Hotspots and Opportunities
- 10.1 Market Opportunity Mapping and Growth Hotspots
- 10.2 High-Growth Applications and Customer Groups
- 10.3 Underserved Markets and White-Space Opportunities
- 10.4 Emerging Technology and Product Opportunities
- 10.5 New Capacity and Investment Hotspots
- 10.6 Market Entry and Expansion Opportunities
- 10.7 Distribution and Partnership Opportunities
- 10.8 Near-Term and Long-Term Commercial Potential
- 10.9 Opportunity Attractiveness and Execution Risks
Chapter 11 Global Bio Based Ethylene Market Outlook, 2025-2035
- 11.1 Market Size and Analysis
- 11.1.1 Revenue (Market Measurement: 2025: USD 613.4 million → 2035: USD 1.13 billion)
- 11.1.2 Market Volume and Quantity Sold
- 11.1.3 Historical Market Size, 2018-2025
- 11.1.4 Base-Year Market Size, 2025
- 11.2 Market Forecast, 2025-2035
- 11.2.1 Revenue Forecast to 2035
- 11.2.2 Volume Forecast to 2035
- 11.2.3 CAGR and Year-on-Year Growth
- 11.2.4 Incremental Revenue Opportunity
- 11.3 Forecast Assumptions and Scenario Analysis
- 11.3.1 Base-Case Forecast
- 11.3.2 Optimistic and Conservative Scenarios
- 11.3.3 Technology, Pricing and Policy Sensitivities
- 11.4 Market Attractiveness and Growth Outlook
Chapter 12 Global Bio Based Ethylene Market Segmentation and Outlook
- 12.1 Segmentation Summary and Market Shares, 2025
- 12.2 Largest and Fastest-Growing Segments
- 12.3 By Raw Material - Market Size and Forecast, 2025-2035
- 12.3.1 Segment Definition and Scope
- 12.3.2 Historical Market Size, 2018-2025
- 12.3.3 Revenue Forecast, 2025-2035
- 12.3.4 Volume Forecast, 2025-2035
- 12.3.5 Base-Year Market Share, 2025
- 12.3.6 Segment CAGR and Growth Drivers
- 12.3.7 Subsegment Market Size and Forecast
- 12.3.7.1 Sugars
- 12.3.7.2 Starch
- 12.3.7.3 Lignocellulosic Biomass and Residues
- 12.3.8 Subsegment Pricing and Adoption Trends
- 12.3.9 Leading Suppliers and Competition
- 12.3.10 Regional Demand and Opportunities
- 12.4 By Production Route - Market Size and Forecast, 2025-2035
- 12.4.1 Segment Definition and Scope
- 12.4.2 Historical Market Size, 2018-2025
- 12.4.3 Revenue Forecast, 2025-2035
- 12.4.4 Volume Forecast, 2025-2035
- 12.4.5 Base-Year Market Share, 2025
- 12.4.6 Segment CAGR and Growth Drivers
- 12.4.7 Subsegment Market Size and Forecast
- 12.4.7.1 Ethanol Dehydration
- 12.4.7.2 Bio-Naphtha Cracking (Mass Balance)
- 12.4.7.3 Emerging Routes (Gas Fermentation and CO2)
- 12.4.8 Subsegment Pricing and Adoption Trends
- 12.4.9 Leading Suppliers and Competition
- 12.4.10 Regional Demand and Opportunities
- 12.5 By Application - Market Size and Forecast, 2025-2035
- 12.5.1 Segment Definition and Scope
- 12.5.2 Historical Market Size, 2018-2025
- 12.5.3 Revenue Forecast, 2025-2035
- 12.5.4 Volume Forecast, 2025-2035
- 12.5.5 Base-Year Market Share, 2025
- 12.5.6 Segment CAGR and Growth Drivers
- 12.5.7 Subsegment Market Size and Forecast
- 12.5.7.1 Packaging
- 12.5.7.2 Detergents and Surfactants
- 12.5.7.3 Additives, Lubricants and Others
- 12.5.8 Subsegment Pricing and Adoption Trends
- 12.5.9 Leading Suppliers and Competition
- 12.5.10 Regional Demand and Opportunities
- 12.6 Segment Growth Comparison
- 12.7 Segment Attractiveness and Priority Matrix
Chapter 13 Global Bio Based Ethylene End-Use and Application Market Outlook
- 13.1 End-Use Industry and Customer Demand Structure
- 13.2 Leading Applications and Customer Groups
- 13.3 End-Use Market Size, Share and Forecast
- 13.4 Major End-Use Industry Deep Dives
- 13.4.1 Customer Requirements and Use Cases
- 13.4.2 Demand and Replacement Cycles
- 13.4.3 Technical and Regulatory Considerations
- 13.4.4 Purchasing and Procurement Models
- 13.4.5 Leading Vendors and Distribution Channels
- 13.4.6 Forecast and Commercial Opportunities
- 13.5 Emerging Applications and Cross-Segment Demand
- 13.6 End-Use Industry Investment Priorities
Chapter 14 Global Bio Based Ethylene Geographic Market Outlook, 2025-2035
- 14.1 Regional Market Size and Share, 2025
- 14.2 Regional Market Forecast, 2025-2035
- 14.3 Regional Pricing, Production and Demand Differences
- 14.4 North America
- 14.4.1 United States
- 14.4.2 Canada
- 14.4.3 Mexico
- 14.5 Europe
- 14.5.1 Germany
- 14.5.2 France
- 14.5.3 Italy
- 14.5.4 United Kingdom
- 14.5.5 Spain
- 14.5.6 Poland
- 14.5.7 Russia
- 14.5.8 Netherlands
- 14.5.9 Belgium
- 14.5.10 Sweden
- 14.5.11 Denmark
- 14.5.12 Norway
- 14.5.13 Rest of Europe
- 14.6 Asia Pacific
- 14.6.1 China
- 14.6.2 India
- 14.6.3 Japan
- 14.6.4 South Korea
- 14.6.5 Thailand
- 14.6.6 Indonesia
- 14.6.7 Vietnam
- 14.6.8 Malaysia
- 14.6.9 Australia
- 14.6.10 Rest of Asia Pacific
- 14.7 Latin America
- 14.7.1 Brazil
- 14.7.2 Argentina
- 14.7.3 Colombia
- 14.7.4 Chile
- 14.7.5 Rest of Latin America
- 14.8 Middle East
- 14.8.1 Saudi Arabia
- 14.8.2 United Arab Emirates
- 14.8.3 Turkey
- 14.8.4 Israel
- 14.8.5 Iran
- 14.8.6 Rest of the Middle East
- 14.9 Africa
- 14.9.1 South Africa
- 14.9.2 Egypt
- 14.9.3 Nigeria
- 14.9.4 Morocco
- 14.9.5 Rest of Africa
- 14.10 Regional Investment, Policy and Supply Chain Differences
- 14.11 Regional Competitive Landscape
- 14.12 Geographic Growth Hotspots
Chapter 15 Global Bio Based Ethylene Technology, Innovation and Sustainability Outlook
- 15.1 Technology Landscape and Maturity
- 15.2 Product, Process and Service Innovation
- 15.3 AI, Automation and Digital Tools in the Industry
- 15.4 Technology Adoption and Performance Benchmarking
- 15.5 Innovation Pipeline and R&D Investment
- 15.6 Patent and Intellectual Property Trends
- 15.7 Energy Efficiency and Resource Management
- 15.8 Sustainability, Recycling and Circularity
- 15.9 Technology Roadmap, 2025-2035
- 15.10 Risks of Obsolescence and Technology Substitution
Chapter 16 Global Bio Based Ethylene Market Key Strategic Imperatives
- 16.1 Growth and Market Entry Priorities
- 16.2 High-Return Products and Segments
- 16.3 Pricing, Profitability and Cost Optimization
- 16.4 Technology Investment and Product Differentiation
- 16.5 Supply Chain Localization and Resilience
- 16.6 Distribution and Customer Acquisition
- 16.7 Partnership, Acquisition and Capacity Strategy
- 16.8 Regional Expansion Priorities
- 16.9 Short-, Medium- and Long-Term Actions
Chapter 17 Competition Outlook
- 17.1 Industry Competition Characteristics
- 17.2 Market Structure and Concentration
- 17.3 Market Share and Competitive Positioning, 2025
- 17.4 Company-Wise Revenue and Product Benchmarking
- 17.5 Production and Service Capacity Benchmarking
- 17.6 Technology, Pricing and Differentiation
- 17.7 Regional Footprint and Distribution Strength
- 17.8 Mergers, Acquisitions and Strategic Alliances
- 17.9 New Entrants and Competitive Threats
- 17.10 Porter's Five Forces and Industry Attractiveness
- 17.11 Competitive Outlook, 2025-2035
Chapter 18 Company Profiles
- 18.1 Company Coverage and Selection Criteria
- 18.2 Braskem S.A.
- 18.2.1 Business Description
- 18.2.2 Company Ownership and Geographic Presence
- 18.2.3 Product and Service Portfolio
- 18.2.4 Manufacturing and Operating Footprint
- 18.2.5 Production Capacity and Expansion Plans
- 18.2.6 Financial Performance and Investment
- 18.2.7 Market Share and Competitive Position
- 18.2.8 Technology and Innovation Capabilities
- 18.2.9 Strategic Alliances or Partnerships
- 18.2.10 Recent Developments
- 18.2.11 Growth Strategy and Outlook
- 18.3 India Glycols Limited
- 18.4 SABIC
- 18.5 LyondellBasell Industries N.V.
- 18.6 Dow Inc.
- 18.7 Other Relevant Market Participants
Note: Every listed company is profiled on the structure shown under the first company. The company list is preliminary and may change based on research findings, market developments, data availability and client requirements.
Chapter 19 Disclaimer
- 19.1 Research and Forecast Disclaimer
- 19.2 Data Source and Estimation Limitations
Note: The depth of individual sections depends on data availability for this market. Volume, capacity, trade and other unit-based metrics are included where applicable.

