
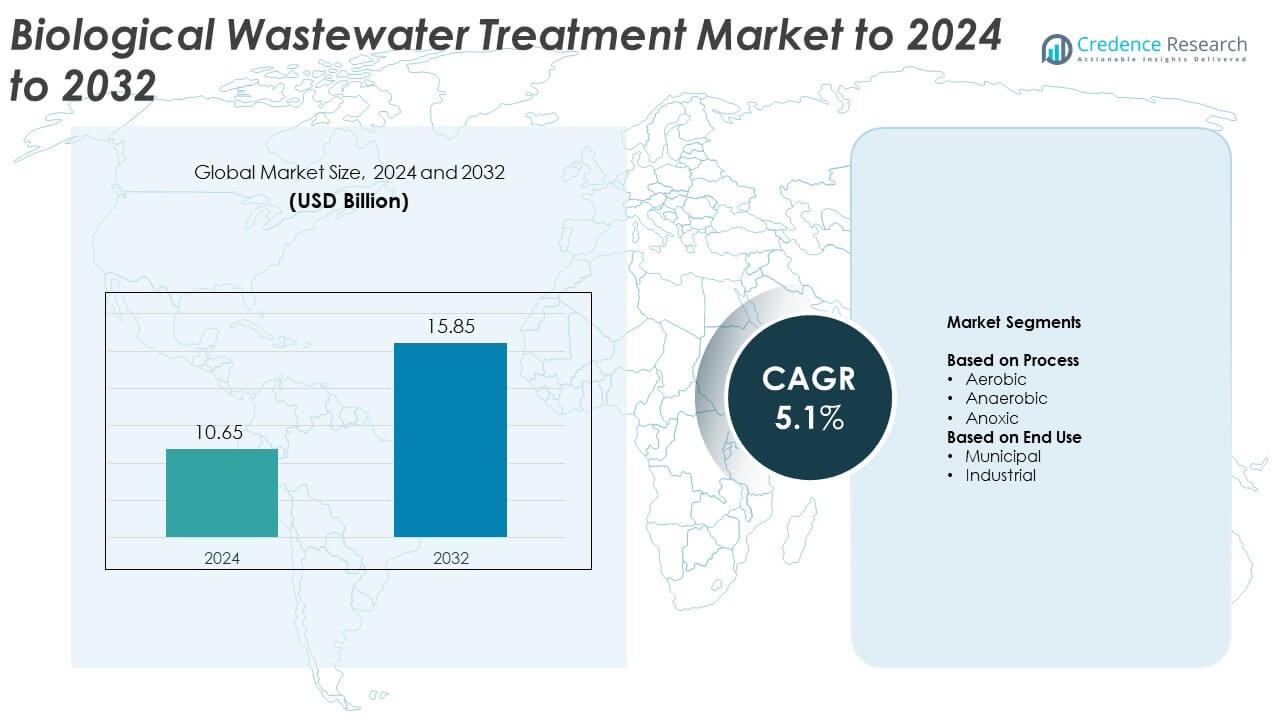
Biological Wastewater Treatment Market size was valued USD 10.65 Billion in 2024 and is anticipated to reach USD 15.85 Billion by 2032, at a CAGR of 5.1% during the forecast period.
| REPORT ATTRIBUTE | DETAILS |
|---|---|
| Historical Period | 2020-2023 |
| Base Year | 2024 |
| Forecast Period | 2025-2032 |
| Biological Wastewater Treatment Market Size 2024 | USD 10.65 Billion |
| Biological Wastewater Treatment Market, CAGR | 5.1% |
| Biological Wastewater Treatment Market Size 2032 | USD 15.85 Billion |
The Biological Wastewater Treatment market is shaped by major players such as DAS Environment Expert GmbH, Pentair plc, Ilim Group, Evoqua Water Technologies LLC, Aquatech International, Veolia Environment SA, Calgon Carbon Corporation, Samco Technologies Inc., Xylem Inc., and Ecolab Inc. These companies compete through advanced biological systems, energy-efficient designs, and expanding service portfolios for municipal and industrial facilities. North America led the market in 2024 with about 37% share, supported by strict regulations and strong infrastructure investment. Europe followed with nearly 31% share, driven by nutrient-removal standards and mature wastewater networks. Asia Pacific held about 24% share, growing rapidly due to rising urbanization and industrial expansion.
Market Insights
- The Biological Wastewater Treatment market was valued at USD 10.65 Billion in 2024 and is projected to reach USD 15.85 Billion by 2032, growing at a CAGR of 5.1%.
- Market growth is driven by rising municipal wastewater loads, strict discharge limits, and increasing industrial adoption across food processing, chemicals, and pharmaceuticals, where biological systems support stable pollutant removal and lower operating costs.
- Key trends include the shift toward energy-efficient aerobic and anaerobic processes, wider use of membrane bioreactors, and strong interest in digital automation that improves treatment reliability and reduces manual control.
- The competitive landscape includes leading companies investing in nutrient-removal upgrades, sludge-reduction technologies, and service-based models that support long-term plant performance across municipal and industrial users.
- North America led with around 37% share in 2024, followed by Europe at 31% and Asia Pacific at 24%, while the aerobic process held about 52% segment share, and municipal use accounted for nearly 58% of total demand.
Market Segmentation Analysis:
By Process
The aerobic process dominated the Biological Wastewater Treatment market in 2024 with about 52% share. This process led due to its strong efficiency in removing organic pollutants and its wide use in municipal treatment plants. Aerobic systems support faster biodegradation, lower odor levels, and stable operation, which drives adoption across both large and mid-scale facilities. Anaerobic and anoxic processes expanded at steady rates as industries focused on energy recovery and nutrient removal, but aerobic treatment remained the preferred choice for meeting strict discharge norms and handling high-volume municipal loads.
- For instance, Ovivo Inc. supplied its ecoBLOX-360 MBR wastewater treatment system to a remote mining site in Quebec, which is designed to treat up to 320 cubic meters per day of sanitary wastewater, as documented on the Ovivo Industrial website.
By End Use
The municipal segment held the largest share in 2024 with nearly 58% of the Biological Wastewater Treatment market. Municipal facilities adopted advanced biological systems to handle rising urban wastewater volumes and comply with tighter environmental regulations. Growing population density, aging sewer networks, and government-funded upgrades supported the strong demand. Industrial end users increased adoption as well, especially in food processing, chemicals, and pharmaceuticals, driven by the need for reliable pollutant reduction and lower sludge generation, but the municipal sector remained the dominant user due to its scale and regulatory pressure.
- For instance, the Saur Group, through its engineering subsidiary Stereau, opened the new drinking water plant at Orly 2, which has a processing capacity of 150,000 cubic meters per day, as confirmed in an official press release on the Saur website.
Key Growth Drivers
Rising Urban Wastewater Volumes
Population growth and rapid urban expansion increased wastewater loads across cities. Municipal bodies invested heavily in biological treatment systems to meet strict discharge limits and improve water reuse. Rising stress on freshwater resources also pushed local authorities to upgrade old infrastructure with efficient aerobic and anaerobic solutions. This shift supported steady market growth as cities prioritized reliable pollutant removal and sustainable water management.
- For instance, Kelda Water Services oversees the Knostrop Wastewater Treatment Works, which serves a population equivalent of 990,000 and has a full flow to treatment of approximately 483.84 million liters per day (5,600 liters per second), as documented in technical data from Xylem and WaterProjectsOnline.
Strict Environmental Regulations
Governments enforced tighter norms on biochemical oxygen demand, nitrogen, and phosphorus discharge. These regulatory pressures encouraged both municipal and industrial facilities to adopt advanced biological treatment systems. Compliance needs strengthened demand for high-performance processes with lower sludge output and better removal efficiency. Industries upgraded systems to avoid penalties and ensure safer environmental footprints. This trend made regulation one of the strongest market growth drivers.
- For instance, a GE membrane bioreactor installation at the Calls Creek plant in Georgia reduced influent ammonia from 14.8 mg/L to effluent values near 0.21 mg/L, while effluent BOD averaged about 1 mg/L, according to U.S. EPA case data supplied by GE.
Industrial Expansion Across Key Sectors
Growth in food processing, pharmaceuticals, textiles, and chemicals increased wastewater generation. These sectors relied on biological systems for effective treatment and lower operational costs. Rising industrial investments in zero-liquid-discharge goals and water recycling supported wider adoption. Companies preferred energy-efficient biological processes to meet sustainability targets. This broad industrial footprint positioned sectoral expansion as a major driver of market demand.
Key Trends and Opportunities
Adoption of Energy-Efficient Treatment Technologies
Biological treatment systems shifted toward solutions that reduced aeration power and improved microbial efficiency. Demand rose for advanced bioreactors, membrane bioreactors, and optimized nutrient-removal designs that enhanced performance. Growing interest in sludge reduction and process automation created opportunities for engineering firms. Facilities sought smart monitoring and biological control tools to lower energy use and operational costs, supporting strong uptake of next-generation systems.
- For instance, Aquatech reports a Gulf-region plant using its low-energy design with measured specific energy consumption below 3.0 kilowatt-hours per cubic meter of produced water, verified after commissioning.
Growth in Water Reuse and Circular Economy Initiatives
Rising water scarcity and sustainability goals encouraged wider use of treated wastewater in agriculture, industry, and landscaping. Utilities upgraded biological processes to fit water reuse standards and support safe non-potable applications. Governments and private firms explored circular models emphasizing resource recovery, including biogas, nutrients, and clean water. These initiatives opened new opportunities for biological systems optimized for recycling and recovery.
- For instance, Utilities Development Company’s Sulaibiya Wastewater Treatment and Reclamation Plant in Kuwait was expanded to treat up to 600,000 cubic meters of wastewater per day, with all reclaimed water sold to the government for agricultural and industrial reuse.
Integration of Digital Monitoring and Automation
Facilities adopted digital platforms that tracked microbial activity, oxygen demand, and treatment stability. Automated controls improved process accuracy and reduced manual intervention. This trend created opportunities for suppliers offering AI-enabled monitoring, early-warning tools, and predictive maintenance. Digital support enhanced reliability, helping users maintain treatment quality under varying loads.
Key Challenges
High Operational and Energy Costs
Biological wastewater treatment required significant energy, especially in aeration-heavy systems. Many small municipalities and industrial units struggled with operating expenses, slowing adoption. Upgrading to advanced systems also demanded skilled labor and higher upfront investment. These cost burdens remained a major challenge for market expansion, pushing facilities to seek more efficient technologies.
Sludge Management and Disposal Issues
Biological processes generated large volumes of sludge that required handling, treatment, and safe disposal. Many regions lacked adequate sludge-processing infrastructure, creating compliance risks. Disposal costs added financial pressure for both municipal and industrial users. These issues limited system performance and raised environmental concerns, making sludge management a persistent challenge across the market.
Regional Analysis
North America
North America held the largest share of the Biological Wastewater Treatment market in 2024 with about 37%. Strong regulatory enforcement and large municipal upgrades supported wide adoption across the United States and Canada. Growing investments in nutrient-removal systems and expanding reuse projects strengthened the regional demand. Industrial sectors such as food processing and pharmaceuticals also increased adoption of biological solutions to meet discharge norms. Advancements in digital monitoring and energy-efficient aeration further improved system efficiency. Public funding for sustainable infrastructure positioned North America as a consistent leader in the market.
Europe
Europe accounted for nearly 31% of the Biological Wastewater Treatment market in 2024, driven by strict environmental rules and strong wastewater recycling initiatives. Countries such as Germany, France, and the U.K. expanded biological treatment capacity, focusing on nutrient removal and advanced sludge management. Industrial users in chemicals and manufacturing upgraded facilities to align with EU Water Framework Directive goals. Demand for membrane-based systems and low-energy treatment increased as utilities moved toward carbon-neutral operations. Strong policy support and circular-economy programs helped Europe maintain a major role in market development.
Asia Pacific
Asia Pacific captured about 24% share of the Biological Wastewater Treatment market in 2024, supported by rapid urbanization and rising wastewater loads in China, India, and Southeast Asia. Governments invested in new treatment plants and modernization projects to meet national discharge standards. Expanding industrial zones increased demand for biological systems with stable pollutant removal. The region saw strong interest in high-capacity aerobic and anaerobic processes due to large population clusters and growing water-reuse efforts. Infrastructure gaps continued to present challenges, yet large-scale upgrades kept Asia Pacific among the fastest-growing markets.
Latin America
Latin America held nearly 5% share in 2024, driven by growing municipal investments and regulatory improvements across Brazil, Mexico, and Colombia. Urban centers focused on expanding centralized treatment capacity to manage rising wastewater loads. Adoption increased in industries such as food processing, beverages, and textiles, which sought reliable compliance solutions. Budget constraints limited large-scale upgrades in some countries, but public-private partnerships supported steady progress. Emphasis on pollution control and water-resource protection sustained moderate market growth across the region.
Middle East & Africa
Middle East and Africa accounted for around 3% share of the Biological Wastewater Treatment market in 2024. Water scarcity encouraged governments to adopt advanced biological systems for reuse in irrigation, landscaping, and industry. Gulf countries invested in modern treatment plants with high-efficiency aerobic and anaerobic processes. African nations progressed slowly due to funding limitations but expanded decentralized treatment in urban clusters. Industrial growth in mining, petrochemicals, and food sectors supported gradual adoption. Long-term plans for water-security improvement continued to create growth opportunities across the region.
Market Segmentations:
By Process
- Aerobic
- Anaerobic
- Anoxic
By End Use
- Municipal
- Industrial
By Geography
- North America
- U.S.
- Canada
- Mexico
- Europe
- Germany
- France
- U.K.
- Italy
- Spain
- Rest of Europe
- Asia Pacific
- China
- Japan
- India
- South Korea
- South-east Asia
- Rest of Asia Pacific
- Latin America
- Brazil
- Argentina
- Rest of Latin America
- Middle East & Africa
- GCC Countries
- South Africa
- Rest of the Middle East and Africa
Competitive Landscape
The competitive landscape of the Biological Wastewater Treatment market includes major companies such as DAS Environment Expert GmbH, Pentair plc, Ilim Group, Evoqua Water Technologies LLC, Aquatech International, Veolia Environment SA, Calgon Carbon Corporation, Samco Technologies Inc., Xylem Inc., and Ecolab Inc. Market competition strengthened as participants focused on advanced treatment technologies that improved pollutant removal and reduced operational costs. Suppliers expanded portfolios with systems designed for nutrient reduction, sludge minimization, and higher energy efficiency. Many firms invested in digital process control, automation, and real-time monitoring to enhance treatment stability. Partnerships with municipal utilities and industrial facilities supported wider deployment of biological systems across regions. Companies also increased R&D efforts targeting low-carbon processes that aligned with sustainability goals. Growing interest in water reuse, stricter discharge norms, and infrastructure modernization continued to drive strategic collaborations, product upgrades, and long-term service contracts across the industry.
Key Player Analysis
- DAS Environment Expert GmbH
- Pentair plc
- Ilim Group
- Evoqua Water Technologies LLC
- Aquatech International
- Veolia Environment SA
- Calgon Carbon Corporation
- Samco Technologies Inc.
- Xylem Inc.
- Ecolab Inc.
Recent Developments
- In 2025, DAS Environmental Experts showcased innovative scalable wastewater treatment solutions at SEMICON Europa, underscoring their ongoing commitment to smart, flexible biological treatment processes.
- In 2025, Veolia announced a major strategic plan to expand its hazardous waste treatment capacity by organically adding 530,000 tonnes of new capacity annually by 2030.
- In 2024, Ilim Group announced it is nearing completion of the largest KLB Mill in Ust-Ilimsk, which will be the first in Russia's pulp and paper sector to implement a two-stage biological wastewater treatment system.
Report Coverage
The research report offers an in-depth analysis based on Process, End-Use and Geography. It details leading market players, providing an overview of their business, product offerings, investments, revenue streams, and key applications. Additionally, the report includes insights into the competitive environment, SWOT analysis, current market trends, as well as the primary drivers and constraints. Furthermore, it discusses various factors that have driven market expansion in recent years. The report also explores market dynamics, regulatory scenarios, and technological advancements that are shaping the industry. It assesses the impact of external factors and global economic changes on market growth. Lastly, it provides strategic recommendations for new entrants and established companies to navigate the complexities of the market.
Future Outlook
- The market will grow as cities upgrade aging wastewater treatment systems.
- Adoption of energy-efficient biological processes will increase across municipal plants.
- Industrial users will invest more in biological treatment to meet strict discharge norms.
- Water-reuse projects will raise demand for high-performance biological systems.
- Digital monitoring and automation will improve process control and reliability.
- Membrane-based biological technologies will gain wider acceptance for advanced treatment.
- Governments will strengthen regulations that support pollutant-removal efficiency.
- Decentralized biological systems will expand in developing regions with limited infrastructure.
- Focus on sludge-reduction methods will shape new product innovation.
- Public-private partnerships will drive investment in sustainable treatment facilities.

Request a Free Sample
Fill in your details and we'll send you a free sample report.
- Sample data tables & charts
- Research methodology
Market Dynamics
Rising Urban Wastewater Volumes
Rapid urbanization and population growth are increasing municipal wastewater loads, prompting cities to invest in advanced biological treatment systems to meet stricter discharge limits and support water reuse initiatives.
Strict Environmental Regulations
Governments are enforcing tighter standards on biochemical oxygen demand, nitrogen, and phosphorus discharge, compelling both municipal and industrial facilities to adopt high-performance biological treatment technologies to ensure compliance and avoid penalties.
Industrial Expansion Across Key Sectors
Growth in industries such as food processing, chemicals, and pharmaceuticals is generating higher volumes of complex wastewater, driving demand for biological systems that offer reliable pollutant removal and lower operational costs.
Adoption of Energy-Efficient Treatment Technologies
Facilities are increasingly seeking biological treatment solutions that reduce energy consumption and operational expenses, such as advanced membrane bioreactors and optimized nutrient-removal designs, fueling market growth.
Growth in Water Reuse and Circular Economy Initiatives
Water scarcity and sustainability goals are encouraging utilities and industries to upgrade biological processes for water recycling and resource recovery, expanding the market for systems designed for safe reuse and circular economy applications.
Need a Custom Version of This Report?
Tailor the scope, geography, or segments to your exact requirements.
- Custom geography or segment scope
- Direct access to our analyst team
Frequently Asked Questions
What is the current market size for the Biological Wastewater Treatment market, and what is its projected size in 2032?
At what Compound Annual Growth Rate is the Biological Wastewater Treatment market projected to grow between 2025 and 2032?
Which Biological Wastewater Treatment market segment held the largest share in 2024?
What are the primary factors fueling the growth of the Biological Wastewater Treatment market?
Who are the leading companies in the Biological Wastewater Treatment market?
Which region commanded the largest share of the Biological Wastewater Treatment market in 2024?
Table of Content
Chapter 1 Market Segmentation
- 1.1 Segmentation Framework
- 1.1.1 Product and Service Classification
- 1.1.2 Application and End-Use Classification
- 1.1.3 Technology and Solution Classification
- 1.1.4 Customer and Distribution Channel Classification
- 1.1.5 Geographic Segmentation
- 1.1.6 Market Segment Definitions and Boundaries
- 1.2 By End Use
- 1.2.1 Municipal
- 1.2.2 Industrial
- 1.3 By Process
- 1.3.1 Aerobic
- 1.3.2 Anaerobic
- 1.3.3 Anoxic
Chapter 2 Introduction
- 2.1 Report Objectives and Scope
- 2.2 Product Definition and Industry Terminology
- 2.3 Market Inclusions and Exclusions
- 2.4 Research Process
- 2.4.1 Primary Research and Expert Interviews
- 2.4.2 Secondary Research and Source Review
- 2.4.3 Top-Down and Bottom-Up Estimation
- 2.4.4 Data Triangulation and Verification
- 2.5 Market Size Measurement Basis
- 2.5.1 2024: USD 10.65 Billion → 2032: USD 15.85 Billion
- 2.6 Historical and Forecast Reference Periods
- 2.6.1 Base Year: 2024
- 2.6.2 Forecast Period: 2024-2032
- 2.7 Research Assumptions and Limitations
Chapter 3 Executive Summary
- 3.1 Market Snapshot and Key Findings
- 3.2 Base-Year Market Size, 2024
- 3.3 Forecast Market Size, 2032
- 3.4 Revenue and Volume Growth Outlook
- 3.5 Key Demand and Supply Indicators
- 3.6 Leading Market Segments
- 3.7 Fastest-Growing Market Opportunities
- 3.8 Regional Performance Highlights
- 3.9 Technology and Industry Transformation
- 3.10 Competitive Landscape Summary
- 3.11 Analyst View and Strategic Implications
Chapter 4 Global Biological Wastewater Treatment Market Trends and Developments
- 4.1 Historical Industry Development
- 4.2 Recent Market Trends and Developments
- 4.3 Demand and Customer Behavior Trends
- 4.4 Technology and Product Innovation
- 4.5 Artificial Intelligence, Automation and Digitalization
- 4.6 Local Manufacturing and Supply Chain Realignment
- 4.7 Industry Partnerships, Mergers and Acquisitions
- 4.8 Sustainability and Circular Economy Developments
- 4.9 Government and Private Sector Investment Trends
- 4.10 Emerging Business Models and Commercialization
- 4.11 Industry Developments and Announcements
Chapter 5 Global Biological Wastewater Treatment Market Production, Supply and Demand Analysis
- 5.1 Demand Trend and Consumption Analysis
- 5.2 Demand Forecast, 2024-2032
- 5.3 Production and Output Trend
- 5.4 Production and Output Forecast, 2024-2032
- 5.5 Installed Capacity and Capacity Utilization
- 5.6 Company-Wise Production Plants and Statistics
- 5.6.1 Installed Production Capacity
- 5.6.2 Actual Production
- 5.6.3 Planned Capacity and Expansion Targets
- 5.7 Supply Chain Structure and Procurement Trends
- 5.8 Supply-Demand Gap and Bottlenecks
- 5.9 Import Dependence and Sourcing Structure
- 5.10 Contract Manufacturing and Outsourcing
- 5.11 Regional Supply and Demand Concentration
Chapter 6 Global Biological Wastewater Treatment Market Pricing Analysis
- 6.1 Pricing Structure and Measurement
- 6.2 Historical Pricing Trends
- 6.3 Pricing Outlook, 2024-2032
- 6.4 Average Selling Price and Unit Economics
- 6.5 Pricing by Product and Market Segment
- 6.6 Geographic Pricing Differences
- 6.7 Key Input, Energy, Labor and Logistics Costs
- 6.8 Contract Pricing and Purchasing Models
- 6.9 Pricing Sensitivity and Competitive Positioning
- 6.10 Price, Margin and Profitability Implications
Chapter 7 Global Biological Wastewater Treatment Market Dynamics
- 7.1 Market Growth Drivers
- 7.1.1 Demand-Side Drivers
- 7.1.2 Technology and Innovation Drivers
- 7.1.3 Infrastructure and Investment Drivers
- 7.1.4 Regulatory and Policy Drivers
- 7.2 Market Restraints
- 7.2.1 Cost and Affordability Constraints
- 7.2.2 Technology and Adoption Barriers
- 7.2.3 Supply Chain and Operational Constraints
- 7.3 Market Challenges
- 7.3.1 Competitive Pressure and Margin Erosion
- 7.3.2 Skills, Infrastructure and Implementation Gaps
- 7.4 Emerging Market Opportunities
- 7.5 Market Dynamics Impact and Time-Horizon Assessment
Chapter 8 Global Biological Wastewater Treatment Value Chain Analysis
- 8.1 Industry Value Chain Overview
- 8.2 Upstream Suppliers and Critical Inputs
- 8.3 Technology and Component Providers
- 8.4 Manufacturing or Service Delivery
- 8.5 Distribution, Channel Partners and Integrators
- 8.6 Downstream Applications and End Users
- 8.7 Value Addition and Profit Pools
- 8.8 Vertical Integration and Outsourcing
- 8.9 Supplier Concentration and Risk
- 8.10 Supply Chain Localization and Resilience
Chapter 9 Global Biological Wastewater Treatment Market Regulations and Policies
- 9.1 Relevant Laws, Standards and Compliance Frameworks
- 9.2 Product, Service, Safety and Quality Requirements
- 9.3 Government Policies, Incentives and Subsidies
- 9.4 Imports, Exports and Trade Barriers
- 9.5 Public Procurement and Local Content Requirements
- 9.6 Environmental and Sustainability Compliance
- 9.7 Upcoming Policy Changes and Market Implications
Chapter 10 Global Biological Wastewater Treatment Market Hotspots and Opportunities
- 10.1 Market Opportunity Mapping and Growth Hotspots
- 10.2 High-Growth Applications and Customer Groups
- 10.3 Underserved Markets and White-Space Opportunities
- 10.4 Emerging Technology and Product Opportunities
- 10.5 New Capacity and Investment Hotspots
- 10.6 Market Entry and Expansion Opportunities
- 10.7 Distribution and Partnership Opportunities
- 10.8 Near-Term and Long-Term Commercial Potential
- 10.9 Opportunity Attractiveness and Execution Risks
Chapter 11 Global Biological Wastewater Treatment Market Outlook, 2024-2032
- 11.1 Market Size and Analysis
- 11.1.1 Revenue (Market Measurement: 2024: USD 10.65 Billion → 2032: USD 15.85 Billion)
- 11.1.2 Market Volume and Quantity Sold
- 11.1.3 Historical Market Size
- 11.1.4 Base-Year Market Size, 2024
- 11.2 Market Forecast, 2024-2032
- 11.2.1 Revenue Forecast to 2032
- 11.2.2 Volume Forecast to 2032
- 11.2.3 CAGR and Year-on-Year Growth
- 11.2.4 Incremental Revenue Opportunity
- 11.3 Forecast Assumptions and Scenario Analysis
- 11.3.1 Base-Case Forecast
- 11.3.2 Optimistic and Conservative Scenarios
- 11.3.3 Technology, Pricing and Policy Sensitivities
- 11.4 Market Attractiveness and Growth Outlook
Chapter 12 Global Biological Wastewater Treatment Market Segmentation and Outlook
- 12.1 Segmentation Summary and Market Shares, 2024
- 12.2 Largest and Fastest-Growing Segments
- 12.3 By End Use - Market Size and Forecast, 2024-2032
- 12.3.1 Segment Definition and Scope
- 12.3.2 Historical Market Size
- 12.3.3 Revenue Forecast, 2024-2032
- 12.3.4 Volume Forecast, 2024-2032
- 12.3.5 Base-Year Market Share, 2024
- 12.3.6 Segment CAGR and Growth Drivers
- 12.3.7 Subsegment Market Size and Forecast
- 12.3.7.1 Municipal
- 12.3.7.2 Industrial
- 12.3.8 Subsegment Pricing and Adoption Trends
- 12.3.9 Leading Suppliers and Competition
- 12.3.10 Regional Demand and Opportunities
- 12.4 By Process - Market Size and Forecast, 2024-2032
- 12.4.1 Segment Definition and Scope
- 12.4.2 Historical Market Size
- 12.4.3 Revenue Forecast, 2024-2032
- 12.4.4 Volume Forecast, 2024-2032
- 12.4.5 Base-Year Market Share, 2024
- 12.4.6 Segment CAGR and Growth Drivers
- 12.4.7 Subsegment Market Size and Forecast
- 12.4.7.1 Aerobic
- 12.4.7.2 Anaerobic
- 12.4.7.3 Anoxic
- 12.4.8 Subsegment Pricing and Adoption Trends
- 12.4.9 Leading Suppliers and Competition
- 12.4.10 Regional Demand and Opportunities
- 12.5 Segment Growth Comparison
- 12.6 Segment Attractiveness and Priority Matrix
Chapter 13 Global Biological Wastewater Treatment End-Use and Application Market Outlook
- 13.1 End-Use Industry and Customer Demand Structure
- 13.2 Leading Applications and Customer Groups
- 13.3 End-Use Market Size, Share and Forecast
- 13.4 Major End-Use Industry Deep Dives
- 13.4.1 Customer Requirements and Use Cases
- 13.4.2 Demand and Replacement Cycles
- 13.4.3 Technical and Regulatory Considerations
- 13.4.4 Purchasing and Procurement Models
- 13.4.5 Leading Vendors and Distribution Channels
- 13.4.6 Forecast and Commercial Opportunities
- 13.5 Emerging Applications and Cross-Segment Demand
- 13.6 End-Use Industry Investment Priorities
Chapter 14 Global Biological Wastewater Treatment Geographic Market Outlook, 2024-2032
- 14.1 Regional Market Size and Share, 2024
- 14.2 Regional Market Forecast, 2024-2032
- 14.3 Regional Pricing, Production and Demand Differences
- 14.4 North America
- 14.4.1 United States
- 14.4.2 Canada
- 14.4.3 Mexico
- 14.5 Europe
- 14.5.1 Germany
- 14.5.2 France
- 14.5.3 Italy
- 14.5.4 United Kingdom
- 14.5.5 Spain
- 14.5.6 Poland
- 14.5.7 Russia
- 14.5.8 Netherlands
- 14.5.9 Belgium
- 14.5.10 Sweden
- 14.5.11 Denmark
- 14.5.12 Norway
- 14.5.13 Rest of Europe
- 14.6 Asia Pacific
- 14.6.1 China
- 14.6.2 India
- 14.6.3 Japan
- 14.6.4 South Korea
- 14.6.5 Thailand
- 14.6.6 Indonesia
- 14.6.7 Vietnam
- 14.6.8 Malaysia
- 14.6.9 Australia
- 14.6.10 Rest of Asia Pacific
- 14.7 Latin America
- 14.7.1 Brazil
- 14.7.2 Argentina
- 14.7.3 Colombia
- 14.7.4 Chile
- 14.7.5 Rest of Latin America
- 14.8 Middle East
- 14.8.1 Saudi Arabia
- 14.8.2 United Arab Emirates
- 14.8.3 Turkey
- 14.8.4 Israel
- 14.8.5 Iran
- 14.8.6 Rest of the Middle East
- 14.9 Africa
- 14.9.1 South Africa
- 14.9.2 Egypt
- 14.9.3 Nigeria
- 14.9.4 Morocco
- 14.9.5 Rest of Africa
- 14.10 Regional Investment, Policy and Supply Chain Differences
- 14.11 Regional Competitive Landscape
- 14.12 Geographic Growth Hotspots
Chapter 15 Global Biological Wastewater Treatment Technology, Innovation and Sustainability Outlook
- 15.1 Technology Landscape and Maturity
- 15.2 Product, Process and Service Innovation
- 15.3 AI, Automation and Digital Tools in the Industry
- 15.4 Technology Adoption and Performance Benchmarking
- 15.5 Innovation Pipeline and R&D Investment
- 15.6 Patent and Intellectual Property Trends
- 15.7 Energy Efficiency and Resource Management
- 15.8 Sustainability, Recycling and Circularity
- 15.9 Technology Roadmap, 2024-2032
- 15.10 Risks of Obsolescence and Technology Substitution
Chapter 16 Global Biological Wastewater Treatment Market Key Strategic Imperatives
- 16.1 Growth and Market Entry Priorities
- 16.2 High-Return Products and Segments
- 16.3 Pricing, Profitability and Cost Optimization
- 16.4 Technology Investment and Product Differentiation
- 16.5 Supply Chain Localization and Resilience
- 16.6 Distribution and Customer Acquisition
- 16.7 Partnership, Acquisition and Capacity Strategy
- 16.8 Regional Expansion Priorities
- 16.9 Short-, Medium- and Long-Term Actions
Chapter 17 Competition Outlook
- 17.1 Industry Competition Characteristics
- 17.2 Market Structure and Concentration
- 17.3 Market Share and Competitive Positioning, 2024
- 17.4 Company-Wise Revenue and Product Benchmarking
- 17.5 Production and Service Capacity Benchmarking
- 17.6 Technology, Pricing and Differentiation
- 17.7 Regional Footprint and Distribution Strength
- 17.8 Mergers, Acquisitions and Strategic Alliances
- 17.9 New Entrants and Competitive Threats
- 17.10 Porter's Five Forces and Industry Attractiveness
- 17.11 Competitive Outlook, 2024-2032
Chapter 18 Company Profiles
- 18.1 Company Coverage and Selection Criteria
- 18.2 DAS Environment Expert GmbH
- 18.2.1 Business Description
- 18.2.2 Company Ownership and Geographic Presence
- 18.2.3 Product and Service Portfolio
- 18.2.4 Manufacturing and Operating Footprint
- 18.2.5 Production Capacity and Expansion Plans
- 18.2.6 Financial Performance and Investment
- 18.2.7 Market Share and Competitive Position
- 18.2.8 Technology and Innovation Capabilities
- 18.2.9 Strategic Alliances or Partnerships
- 18.2.10 Recent Developments
- 18.2.11 Growth Strategy and Outlook
- 18.3 Pentair plc
- 18.4 Ilim Group
- 18.5 Evoqua Water Technologies LLC
- 18.6 Aquatech International
- 18.7 Veolia Environment SA
- 18.8 Calgon Carbon Corporation
- 18.9 Samco Technologies Inc.
- 18.10 Xylem Inc.
- 18.11 Ecolab Inc.
- 18.12 Other Relevant Market Participants
Note: Every listed company is profiled on the structure shown under the first company. The company list is preliminary and may change based on research findings, market developments, data availability and client requirements.
Chapter 19 Disclaimer
- 19.1 Research and Forecast Disclaimer
- 19.2 Data Source and Estimation Limitations
Note: The depth of individual sections depends on data availability for this market. Volume, capacity, trade and other unit-based metrics are included where applicable.

