
Market Overview:
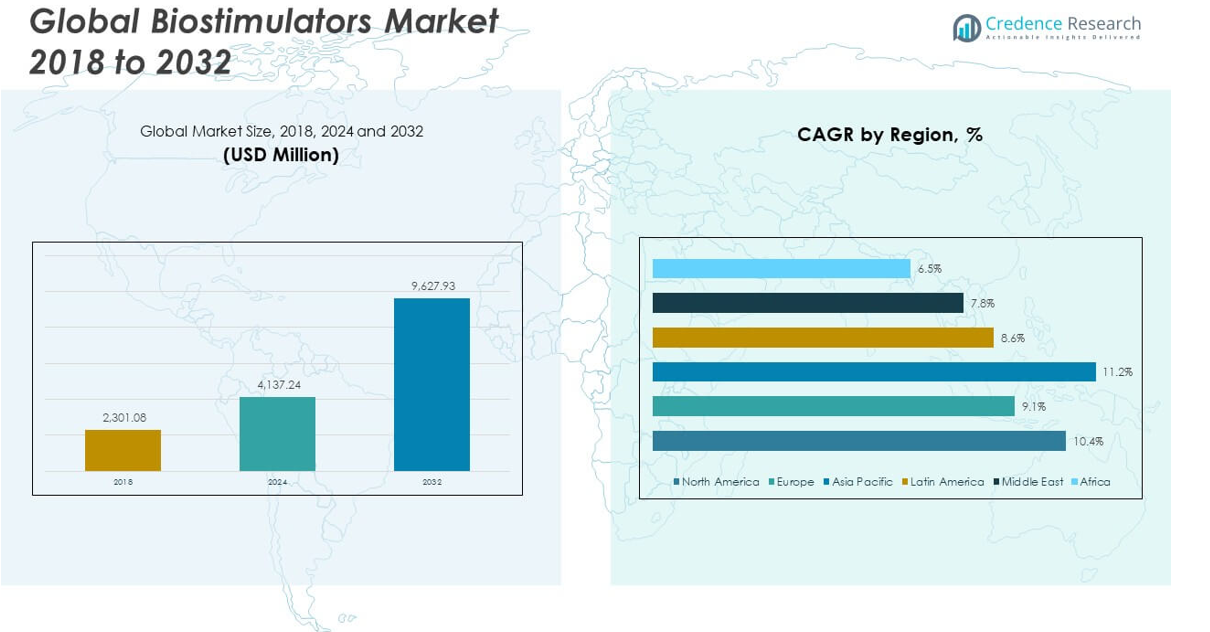
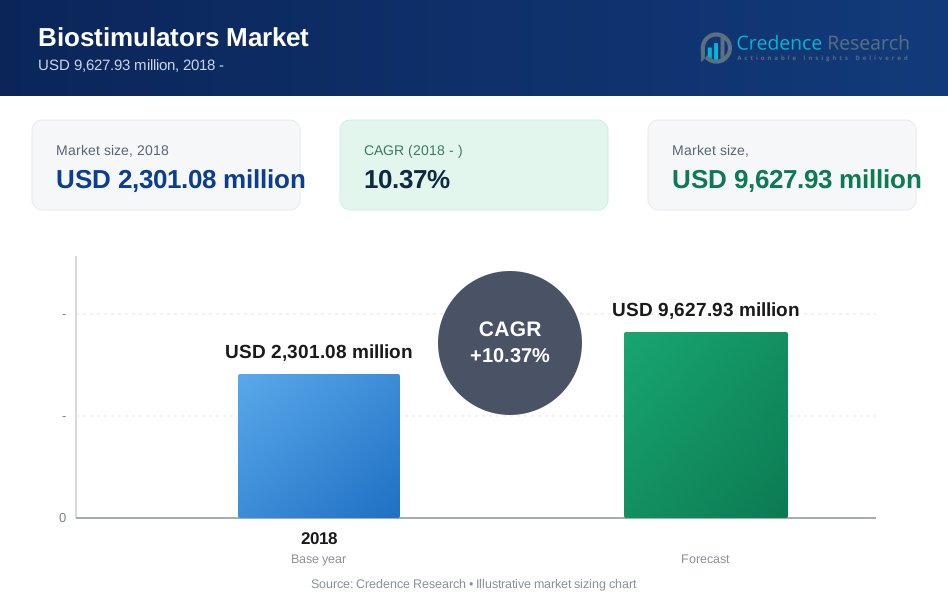
The Global Biostimulators Market size was valued at USD 2,301.08 million in 2018 to USD 4,137.24 million in 2024 and is anticipated to reach USD 9,627.93 million by 2032, at a CAGR of 10.37% during the forecast period.
| REPORT ATTRIBUTE | DETAILS |
|---|---|
| Historical Period | 2020-2023 |
| Base Year | 2024 |
| Forecast Period | 2025-2032 |
| Biostimulators Market Size 2024 | USD 4,137.24 million |
| Biostimulators Market, CAGR | 10.37% |
| Biostimulators Market Size 2032 | USD 9,627.93 million |
The market is growing rapidly due to increasing demand for sustainable agriculture, rising awareness of soil health, and the global push to reduce chemical inputs. Farmers are increasingly adopting biostimulators to improve crop yield, resilience to stress, and nutrient efficiency. Regulatory support for organic farming, coupled with a surge in investments in agri-biotech research, accelerates product development and availability. The shift towards climate-smart agriculture further amplifies the relevance and adoption of biostimulators in modern farming practices.
Europe leads the global biostimulators market due to strong regulatory frameworks promoting organic agriculture and high consumer awareness. North America follows closely with growing demand for sustainable crop solutions. Asia Pacific is emerging as a high-growth region, driven by large agricultural economies such as India and China, where farmers are shifting from traditional to more efficient farming inputs. Latin America also shows promising growth potential, particularly in countries like Brazil, due to expanding high-value crop production and government support for sustainable agriculture.
Market Insights:
- The Global Biostimulators Market was valued at USD 4,137.24 million in 2024 and is projected to reach USD 9,627.93 million by 2032, growing at a CAGR of 10.37%.
- Rising demand for sustainable agriculture and increased focus on crop resilience are key drivers fueling market expansion.
- Biostimulators enhance nutrient uptake, improve soil health, and reduce dependence on chemical fertilizers.
- Regulatory ambiguity and lack of harmonized definitions across regions hinder market growth and international trade.
- Limited awareness among traditional farmers and inconsistent field performance data restrict broader adoption.
- Europe dominates the market due to strong organic farming policies, while Asia Pacific shows high growth potential led by China and India.
- Emerging markets in Latin America and Africa offer new opportunities through localized products and farmer training programs.
Market Drivers:
Growing Focus on Enhancing Crop Resilience and Stress Tolerance Among Farmers:
The rising impact of climate variability and unpredictable weather patterns increases crop vulnerability, prompting farmers to adopt stress-resilient practices. Biostimulators enhance plant defense mechanisms, making them a valuable solution against drought, salinity, and extreme temperatures. Their role in improving seed germination, root development, and photosynthetic efficiency supports overall crop vitality. The Global Biostimulators Market benefits from the consistent need to safeguard yields under adverse agronomic conditions. Producers are expanding product portfolios tailored to region-specific stress factors. It reflects the growing recognition of biostimulants’ unique, non-nutrient physiological benefits. This strategic shift aligns with farmers' needs to secure productivity with minimal environmental disruption. Manufacturers leverage this demand to drive innovation and application precision in biostimulant formulations.
- For instance, Valagro’s Megafol biostimulant demonstrated a 32% improvement in water use efficiency and a 24% increase in yield under drought stress conditions in field trials on tomato crops, according to published results from the University of Naples.
Rising Demand for Organic and Sustainable Agricultural Practices Worldwide:
Global agricultural trends are steadily shifting toward organic farming, driven by rising consumer preference for chemical-free produce. Biostimulators align with organic standards, offering a compliant alternative to synthetic agrochemicals. Governments and certifying bodies promote biostimulant use through incentives, certifications, and eco-labelling frameworks. The Global Biostimulators Market taps into this sustainable transition to capture demand from organic and integrated farming systems. It strengthens its footprint by meeting regulatory approvals that validate its environmental safety. Export-driven agricultural economies adopt biostimulators to meet stringent residue limits set by importing nations. Industry stakeholders build collaborations to train farmers on sustainable input usage. Biostimulants’ compatibility with eco-conscious farming systems increases their market relevance across continents.
- For instance, UPL’s GoActiv seaweed-based biostimulant received EcoCert approval for organic agriculture and documented a 27% reduction in chemical input requirements on vineyards in Spain, as recorded in collaborative sustainability trials.
Strong Policy Support and Institutional Investment in Agri-Biotechnology Innovations:
Governments and agricultural research institutes allocate significant funding toward biotechnology innovations that improve farm productivity. Biostimulators emerge as a focal point within national strategies to reduce reliance on synthetic fertilizers. Public-private partnerships develop next-generation biostimulant solutions through grants, trials, and pilot programs. The Global Biostimulators Market gains momentum through alignment with policy-driven programs supporting resource-efficient agriculture. It benefits from strategic alignment with national food security and soil regeneration agendas. Institutional investment fosters collaboration between biostimulant companies, universities, and agritech firms. Scientific validation and field data help establish credibility among skeptical users. This support ecosystem accelerates commercialization and market penetration in both developed and emerging regions.
Need to Maximize Nutrient Use Efficiency and Soil Health Restoration:
Soil degradation and nutrient depletion hinder crop productivity in intensive agricultural systems. Biostimulators enhance nutrient uptake and microbial activity, contributing to improved soil structure and fertility. These benefits reduce the need for high chemical input, promoting sustainable nutrient management. The Global Biostimulators Market gains traction among producers aiming to restore long-term soil health. It serves markets with regulatory restrictions on nitrogen and phosphate fertilizer use. Farmers adopt biostimulators to unlock bound nutrients and reduce input costs over time. The integration of biostimulants into soil and foliar application practices reflects their versatility. Agronomists increasingly recommend biostimulators to rehabilitate low-carbon soils and promote regenerative practices.
Market Trends:
Rising Development of Microbial-Based Biostimulators with Targeted Functionality:
The trend toward microbial biostimulants reflects advancements in bioformulation and strain selection. These products leverage specific bacterial and fungal species to stimulate plant metabolism. Companies invest in precision microbiology to enhance nitrogen fixation, phosphorus solubilization, or hormone regulation. The Global Biostimulators Market adopts microbial products for their ability to adapt to varied agroclimatic zones. It supports innovations that improve field stability, shelf life, and formulation compatibility. R&D labs focus on strain consortia and synergistic blends for multi-functional action. Digital agriculture platforms integrate data to customize microbial recommendations. Farmers increasingly prefer biologicals that offer measurable benefits without compromising soil biodiversity.
- For instance, Corteva Agriscience’s Utrisha N microbial biostimulant, based on Methylobacterium symbioticum strain, has shown consistent nitrogen fixation resulting in an average yield increase of 7.7 bushels per acre in U.S. corn production trials.
Product Innovations Supporting Compatibility with Fertigation and Modern Equipment:
New formulations are developed for seamless application through drip irrigation, foliar sprays, and hydroponic systems. These advancements reduce operational costs while enhancing efficacy. The Global Biostimulators Market sees rising demand for liquid concentrates and water-soluble powders suited for mechanized agriculture. It enables broader adoption across large-scale and precision farming operations. Equipment manufacturers collaborate with biostimulant brands to ensure product compatibility. Modular product lines serve diversified crop cycles and farm sizes. This trend supports efficient farm management and encourages widespread use of biological inputs. It also facilitates on-field experimentation and validation of new technologies in live conditions.
- For instance, Isagro’s Radicon is formulated as a highly soluble powder for fertigation and demonstrated a 95% uniform distribution efficiency through drip irrigation systems in large-scale tomato farms in Southern Italy, leading to uniform crop performance.
Increased Digitalization and AI Integration in Product Testing and Field Application:
Digital platforms and AI-powered models are increasingly used to test and optimize biostimulant performance under real-world conditions. Satellite monitoring, IoT sensors, and weather analytics provide actionable data to fine-tune usage. The Global Biostimulators Market benefits from AI-driven recommendations that ensure the right dosage, timing, and crop targeting. It enables higher yield response rates and improved return on investment for growers. Developers use machine learning to screen compounds and predict plant response. Digital decision support tools bridge the gap between lab-tested efficacy and farmer adoption. This tech-driven trend also accelerates field trials, regulatory documentation, and market entry.
Customized Solutions for High-Value Crops and Controlled Environments:
Demand for high-value crops such as fruits, vegetables, and medicinal plants drives the trend toward crop-specific biostimulants. Greenhouse and vertical farm operators seek precision-formulated inputs. The Global Biostimulators Market responds with differentiated offerings tailored to phenological stages. It supports producers in improving quality attributes such as size, flavor, and shelf life. Controlled environment agriculture benefits from residue-free formulations with predictable outcomes. Niche players enter the market with premium biostimulants for hydroponic, aeroponic, and urban farming systems. This trend supports value-chain integration, where input use aligns with desired post-harvest and market traits. Customization fosters loyalty among specialized growers seeking consistent product performance.
Market Challenges Analysis:
Unclear Regulatory Definitions and Lack of Harmonization Across Regions:
Biostimulants operate within a regulatory gray area in many jurisdictions, often overlapping with fertilizers, pesticides, or plant growth regulators. This ambiguity creates confusion among manufacturers, distributors, and end-users. The absence of harmonized standards complicates registration and international trade. The Global Biostimulators Market faces delays in product approvals and barriers to cross-border sales. It restricts small and medium players from scaling operations efficiently. National policies vary widely in terms of labelling, allowable ingredients, and efficacy claims. Industry stakeholders push for standardized definitions through regional alliances and working groups. Without regulatory alignment, market fragmentation persists, affecting consistency in product quality and user trust.
Low Awareness and Adoption Gaps Among Traditional Growers:
Many conventional farmers remain unfamiliar with biostimulants or skeptical of their benefits due to limited on-field evidence. The lack of structured extension services limits information flow to rural and smallholder communities. The Global Biostimulators Market experiences adoption gaps in regions dominated by traditional agrochemical use. It requires targeted outreach and education to shift perception and build confidence. Distributors often lack technical expertise to communicate application benefits and ROI clearly. Poor visibility in local agri-input retail channels hampers market access. Building trust through field trials, demonstration plots, and farmer training is essential. Without active engagement, market growth potential remains underutilized in several key agricultural economies.
Market Opportunities:
Expansion into Emerging Markets with Untapped Agricultural Potential:
Emerging economies in Southeast Asia, Sub-Saharan Africa, and Latin America present strong growth opportunities for biostimulant adoption. Farmers in these regions seek low-cost, effective solutions to improve yields under challenging conditions. The Global Biostimulators Market can expand by localizing product development and strengthening distribution networks. It aligns with agricultural development programs that prioritize input efficiency and climate resilience. Strategic partnerships with agri-cooperatives, NGOs, and extension agencies can accelerate market penetration. Customized products suited to regional crops and practices can unlock untapped demand. These markets offer scalability, especially with rising awareness and support from international funding bodies.
Collaborations for R&D and Integration with Smart Agriculture Systems:
Partnerships between biotech firms, agri-tech start-ups, and research institutions unlock new biostimulant innovations. Developers use AI, genomics, and metabolomics to enhance formulation effectiveness. The Global Biostimulators Market can grow by aligning biostimulant application with smart farming platforms. It integrates with precision tools to deliver site-specific solutions that increase ROI. Co-developing data-driven recommendations with tech partners adds value to product offerings. This opportunity allows firms to differentiate in a competitive landscape and boost user adoption through transparency and efficacy.
Market Segmentation Analysis:
By Product Type
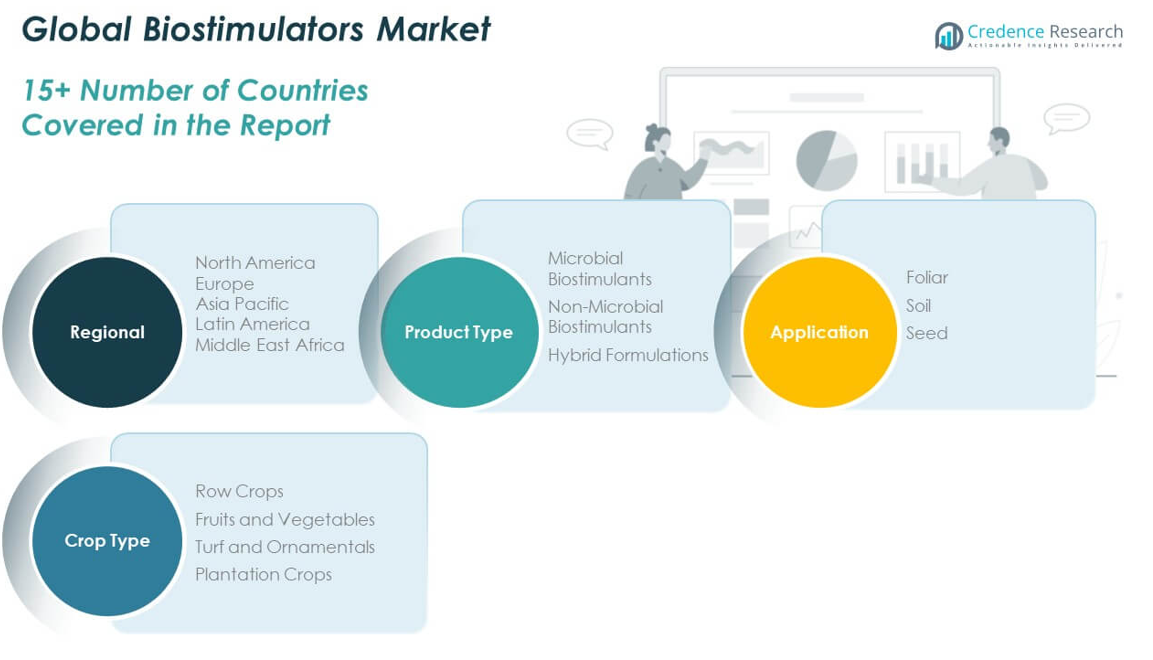
The Global Biostimulators Market is segmented into microbial biostimulants, non-microbial biostimulants, and hybrid formulations. Microbial biostimulants lead the segment due to their strong performance in enhancing root development and nutrient absorption. Non-microbial biostimulants, including humic substances and seaweed extracts, maintain high adoption in traditional agricultural markets. Hybrid formulations are emerging as next-generation solutions by combining microbial strains with organic compounds for enhanced efficacy. It shows growing interest in products that offer dual-mode action and adaptability across diverse crops and climates. Companies focus on customized product development to cater to specific soil conditions and plant needs.
- For instance, Atlantic Laboratories’ hybrid biostimulant Bio-Enhancer, combining Bacillus strains with fulvic acid, increased wheat root mass by 42% and improved phosphorus uptake by 31% in replicated field trials conducted in Kansas.
By Application
The market is divided into foliar, soil, and seed applications. Foliar application holds the largest share, valued for its rapid absorption and direct impact on plant physiology. Soil application is widely used to rejuvenate degraded soils and promote beneficial microbial activity. Seed treatment continues to expand, especially in precision agriculture, where early-stage vigor and root establishment are critical. It helps ensure uniform germination and resilience against abiotic stress. Application methods vary by crop type, region, and farming practices, prompting manufacturers to offer flexible formulations compatible with existing systems.
- For instance, Syngenta’s seed-applied biostimulant EPIVIO Energy extended maize seedling emergence by 3 days earlier and resulted in a 9% increase in stand uniformity, according to company-conducted trials in Brazil’s 2023 planting season.
By Crop Type
Based on crop type, the market includes row crops, fruits and vegetables, turf and ornamentals, and plantation crops. Row crops account for the largest volume share, supported by widespread adoption in grains, oilseeds, and pulses. Fruits and vegetables drive growth in value due to the emphasis on quality, shelf life, and export compliance. Turf and ornamentals adopt biostimulants to enhance stress tolerance and aesthetic quality in landscaping. Plantation crops such as coffee, cocoa, and tea present niche yet profitable markets, especially in tropical regions. It enables manufacturers to develop crop-specific solutions to maximize efficacy.
Segmentation:
By Product Type
- Microbial Biostimulants
- Non-Microbial Biostimulants
- Hybrid Formulations
By Application
- Foliar
- Soil
- Seed
By Crop Type
- Row Crops
- Fruits and Vegetables
- Turf and Ornamentals
- Plantation Crops
By Region
- North America
- S.
- Canada
- Mexico
- Europe
- UK
- France
- Germany
- Italy
- Spain
- Russia
- Rest of Europe
- Asia Pacific
- China
- Japan
- South Korea
- India
- Australia
- Southeast Asia
- Rest of Asia Pacific
- Latin America
- Brazil
- Argentina
- Rest of Latin America
- Middle East
- GCC Countries
- Israel
- Turkey
- Rest of Middle East
- Africa
- South Africa
- Egypt
- Rest of Africa
Regional Analysis:
North America
The North America Biostimulators Market size was valued at USD 638.18 million in 2018 to USD 1,128.66 million in 2024 and is anticipated to reach USD 2,638.10 million by 2032, at a CAGR of 10.4% during the forecast period. North America accounts for approximately 27.3% of the global market share in 2024. The Global Biostimulators Market in this region benefits from advanced agricultural infrastructure and strong regulatory support for sustainable inputs. U.S. growers increasingly adopt microbial biostimulants to enhance yields and meet food safety standards. Precision farming practices further drive product demand, especially in high-value crop segments. Canada focuses on reducing chemical fertilizer use, making biostimulants integral to nutrient management programs. Mexico expands adoption across fruits and vegetables due to growing export demand. Companies in North America prioritize R&D and partnerships with agri-tech firms to improve efficacy and field application. It continues to show growth potential in both row and specialty crop categories.
Europe
The Europe Biostimulators Market size was valued at USD 454.11 million in 2018 to USD 774.15 million in 2024 and is anticipated to reach USD 1,647.51 million by 2032, at a CAGR of 9.1% during the forecast period. Europe represents roughly 18.7% of the global market share in 2024. The Global Biostimulators Market in Europe benefits from strict environmental regulations and a well-developed organic farming sector. Countries such as France, Italy, and Spain lead adoption through government subsidies and eco-certification incentives. The EU’s Farm to Fork strategy boosts interest in sustainable inputs, including biostimulants. Manufacturers align products with residue-free standards and integrated crop management systems. Germany and the UK invest in innovation to support green agriculture. Eastern Europe sees rising adoption due to modernization efforts in agriculture. It remains a mature yet innovation-driven market with high compliance requirements.
Asia Pacific
The Asia Pacific Biostimulators Market size was valued at USD 1,015.30 million in 2018 to USD 1,892.23 million in 2024 and is anticipated to reach USD 4,669.59 million by 2032, at a CAGR of 11.2% during the forecast period. Asia Pacific contributes the largest regional share at approximately 45.7% of the global market in 2024. The Global Biostimulators Market in this region grows rapidly due to expanding agricultural activity and government efforts to improve soil fertility. China and India drive large-scale demand with initiatives that promote sustainable inputs. Farmers in Southeast Asia adopt foliar and soil biostimulants to support rice, sugarcane, and vegetable production. The region witnesses strong private sector investments in product development and distribution. Japan and South Korea lead in technological adoption and greenhouse integration. Local players introduce cost-effective solutions to address smallholder farm needs. It shows strong volume growth supported by both commercial and subsistence agriculture.
Latin America
The Latin America Biostimulators Market size was valued at USD 104.09 million in 2018 to USD 184.71 million in 2024 and is anticipated to reach USD 378.25 million by 2032, at a CAGR of 8.6% during the forecast period. Latin America accounts for approximately 4.5% of the global market share in 2024. The Global Biostimulators Market in this region benefits from growing awareness of soil degradation and climate variability. Brazil leads in adoption, particularly across soybeans, sugarcane, and fruit crops. Argentina and Chile follow, promoting biological inputs for export-oriented produce. Government support and training programs encourage sustainable practices in the region. Key players collaborate with local cooperatives to extend market reach. Rising input costs also push farmers toward alternative solutions like biostimulants. It shows potential for growth in plantation crops and value-chain integration across the continent.
Middle East
The Middle East Biostimulators Market size was valued at USD 60.37 million in 2018 to USD 98.58 million in 2024 and is anticipated to reach USD 190.90 million by 2032, at a CAGR of 7.8% during the forecast period. The region contributes approximately 2.4% to the global market share in 2024. The Global Biostimulators Market in the Middle East is driven by the need for water-efficient and stress-resilient crop inputs. Countries like Israel and UAE focus on high-tech agriculture, including vertical farms and hydroponics. Biostimulants support yield enhancement under saline and arid soil conditions. Governments fund agricultural innovation to reduce food import dependency. Saudi Arabia and Qatar integrate biological inputs in protected cultivation systems. It reflects a shift toward input efficiency and climate resilience. Demand is growing in horticulture and dates, with specialized formulations gaining traction.
Africa
The Africa Biostimulators Market size was valued at USD 29.03 million in 2018 to USD 58.91 million in 2024 and is anticipated to reach USD 103.58 million by 2032, at a CAGR of 6.5% during the forecast period. Africa holds around 1.4% of the global market share in 2024. The Global Biostimulators Market in Africa grows slowly due to limited awareness and infrastructural constraints. However, international agencies and NGOs support pilot projects in sustainable agriculture. South Africa shows moderate adoption in wine grapes and horticulture. Egypt promotes input efficiency in irrigation-intensive regions. Multinational players target the continent through donor-funded programs and training. It remains underpenetrated but offers long-term potential in soil restoration and climate-smart farming. Market expansion depends on regulatory frameworks, product accessibility, and farmer education.
Key Player Analysis:
- BASF SE
- Valagro
- UPL Limited
- Isagro Group
- Koppert Biological Systems
- Syngenta AG
- Marrone Bio Innovations
- FMC Corporation
- Arysta LifeScience Corporation
- Teleflex Incorporated
- Biolchim S.p.A.
Competitive Analysis:
The Global Biostimulators Market features a moderately fragmented competitive landscape with both multinational corporations and regional specialists. Key players such as BASF SE, UPL Limited, Valagro, and FMC Corporation maintain strong portfolios backed by extensive R&D capabilities and global distribution networks. It fosters competition through innovation in microbial formulations, hybrid technologies, and crop-specific solutions. Companies focus on strategic acquisitions, partnerships, and product launches to expand geographic reach and gain a competitive edge. Smaller players capitalize on niche applications and localized formulations. Intellectual property, regulatory approval, and technical advisory services serve as critical differentiators. The market remains highly responsive to advancements in biotechnology, application techniques, and sustainable agriculture practices.
Recent Developments:
- In October 2024, BASF SE entered a strategic partnership with Acadian Plant Health to incorporate new seaweed biostimulant technology into its BioSolutions offering. This collaboration is designed to expand BASF's biological product portfolio to more markets and deliver enhanced crop growth and resilience, responding to increasing demand for sustainable agriculture.
- In November 2024, BASF SE also partnered with Elicit Plant to accelerate development and promotion of two new biostimulants, EliSun-a for sunflower and EliGrain-a for cereals, leveraging phytosterol technology for improved water management and crop resilience. The collaboration aims to rapidly advance these products for broad commercialization in France and beyond.
- On May 28, 2025, UPL Limited began a new partnership with Elemental Enzymes in Brazil, announced for the 2026 season. This agreement will see the distribution of novel peptide-based biological inputs for corn and soybean, aiming to provide disease protection and yield resilience with reduced environmental impact. The partnership is set for initial Brazilian deployment, expanding globally in 2027.
- In 2025, Koppert Biological Systems and Acadian Plant Health jointly extended their partnership with a new global distribution agreement. This expansion—covering Europe, the Middle East, and Africa, and starting with France—will leverage Koppert’s pest and disease control with Acadian’s biostimulant expertise to provide an integrated suite of biological solutions for plant health and productivity worldwide
Market Concentration & Characteristics:
The Global Biostimulators Market shows moderate concentration, with leading players holding distinct product and geographic strengths. It combines both consolidated multinational control and rising regional participation. The market is driven by biological innovation, regulatory alignment, and tailored product development for specific crops and environments. It remains dynamic, shaped by sustainability mandates, evolving consumer preferences, and agri-tech integrations. Companies compete on formulation efficacy, application compatibility, and field support services. The sector attracts both agri-biotech giants and emerging firms focused on microbial and eco-friendly solutions.
Report Coverage:
The research report offers an in-depth analysis based on product type, application, and crop type. It details leading market players, providing an overview of their business, product offerings, investments, revenue streams, and key applications. Additionally, the report includes insights into the competitive environment, SWOT analysis, current market trends, as well as the primary drivers and constraints. Furthermore, it discusses various factors that have driven market expansion in recent years. The report also explores market dynamics, regulatory scenarios, and technological advancements that are shaping the industry. It assesses the impact of external factors and global economic changes on market growth. Lastly, it provides strategic recommendations for new entrants and established companies to navigate the complexities of the market.
Future Outlook:
- Microbial and hybrid biostimulants will see increased adoption driven by demand for improved soil biology and crop resilience.
- Integration with precision farming tools and data platforms will optimize application rates and maximize yield efficiency.
- Organic farming expansion across Europe and North America will push regulatory-backed biostimulant usage.
- Asia Pacific will lead volume growth due to expanding agriculture in India, China, and Southeast Asia.
- R&D investments will prioritize stress mitigation, drought tolerance, and customized crop-specific solutions.
- Public-private partnerships will scale adoption in emerging economies through subsidized pilot programs.
- E-commerce and digital agri-input platforms will enhance accessibility in rural and remote areas.
- Regulatory harmonization efforts will streamline global trade and accelerate product registrations.
- Strategic mergers and acquisitions will consolidate market share and diversify product portfolios.
- Climate change adaptation policies will drive biostimulant inclusion in national agricultural sustainability plans.
Request a Free Sample
Fill in your details and we'll send you a free sample report.
- Sample data tables & charts
- Research methodology
Need a Custom Version of This Report?
Tailor the scope, geography, or segments to your exact requirements.
- Custom geography or segment scope
- Direct access to our analyst team
Frequently Asked Questions
What is the current size of the Global Biostimulators Market?
What are the key segments within the Global Biostimulators Market?
What are some challenges faced by the Global Biostimulators Market?
Who are the major players in the Global Biostimulators Market?
Table of Content
Chapter 1. Report Introduction
- 1.1 Report Description & Purpose
- 1.1.1 Report Title & Market Definition
- 1.1.2 Unique Selling Propositions (USP) & Key Differentiators
- 1.1.3 Value Proposition for Stakeholders
- 1.2 Research Objectives
- 1.2.1 Market Sizing Objectives (Volume & Revenue)
- 1.2.2 Segmentation Objectives
- 1.2.3 Competitive Intelligence Objectives
- 1.2.4 Forecast & Scenario Objectives
- 1.3 Report Scope
- 1.3.1 Biostimulators Scope – Types & Subtypes Covered
- 1.3.2 Geographic Scope – Regions & Countries Covered
- 1.3.3 Historical Period, Base Year & Forecast Period (2018; forecast to the forecast period)
- 1.3.4 Inclusions & Exclusions
- 1.4 HS Code & Classification Framework
- 1.5 Currency, Units & Pricing Basis
- 1.6 Target Stakeholders
- 1.7 Limitations & Assumptions
Chapter 2. Executive Summary
- 2.1 Global Biostimulators Market Snapshot
- 2.1.1 Market Size – Historical (2018) & Forecast (the forecast period) (2018: USD 2,301.08 million → forecast year: USD 9,627.93 million)
- 2.1.2 Volume & Revenue – Global Totals
- 2.1.3 Key Market Highlights – Top Five Facts
- 2.2 Biostimulators Market Segmentation Snapshot
- 2.2.1 Market Split by Region – 2018 vs.
- 2.3 Competitive Snapshot
- 2.3.1 Top 10 Players by Revenue Share – 2018
- 2.3.2 Top 10 Players by Volume Share – 2018
- 2.3.3 Recent Strategic Developments (18-Month Summary)
- 2.4 Key Investment Highlights & Strategic Conclusions
Chapter 3. Biostimulators Market Dynamics & Industry Analysis
- 3.1 Market Overview & Context
- 3.1.1 Biostimulators Market Position in the Broader Automotive Value Chain
- 3.1.2 OEM vs. Replacement Market Dynamics
- 3.1.3 Market Maturity & Development Stage by Region
- 3.2 Biostimulators Market Drivers
- 3.3 Biostimulators Market Restraints & Challenges
- 3.4 Biostimulators Market Opportunities
- 3.5 Porter's Five Forces Analysis
- 3.5.1 Threat of New Entrants
- 3.5.2 Bargaining Power of Suppliers
- 3.5.3 Bargaining Power of Buyers
- 3.5.4 Threat of Substitutes
- 3.5.5 Competitive Rivalry – Intensity Assessment
- 3.6 Biostimulators Value Chain Analysis
- 3.6.1 Upstream – Raw Material/Input Suppliers
- 3.6.1.1 Raw Material/Input 1
- 3.6.1.2 Raw Material/Input 2
- 3.6.1.3 Raw Material/Input 3
- 3.6.2 Midstream – Production/Manufacturing/Service Delivery
- 3.6.2.1 Production/Process Overview
- 3.6.2.2 Key Facility Locations & Capacity by Manufacturer
- 3.6.3 Downstream – Distribution & End Consumer
- 3.6.3.1 Primary Channel – B2B/OEM
- 3.6.3.2 Secondary Channels – Dealer, Retail, Online, Direct
- 3.6.4 Value Chain Profitability Analysis
- 3.6.1 Upstream – Raw Material/Input Suppliers
- 3.7 PESTEL Analysis
- 3.7.1 Political Factors
- 3.7.2 Economic Factors
- 3.7.3 Social Factors
- 3.7.4 Technological Factors
- 3.7.5 Environmental Factors
- 3.7.6 Legal Factors
- 3.8 Biostimulators Supply Chain Analysis
- 3.8.1 Raw Material/Input Supply Risk Assessment
- 3.8.2 Manufacturing Concentration Risk (Geographic Exposure)
- 3.8.3 Trade Disruption Impact Analysis
- 3.9 Regulatory & Policy Landscape
Note: The regulatory and policy landscape section covers regulations based on their applicability to the market, Biostimulators category, geography, and scope of the study. Only regulatory frameworks with a material impact on operations, compliance, trade, sustainability, or market access are analyzed in detail.
Chapter 4. Key Investment Pockets & Opportunity Analysis
- 4.1 Biostimulators Market Attractiveness Analysis
- 4.1.1 By Region – Investment Attractiveness Matrix (Volume × CAGR)
- 4.2 Absolute Revenue Growth Opportunity
- 4.2.1 By Region – Absolute USD Growth Through the forecast period
- 4.3 Incremental Volume Opportunity
- 4.3.1 By Region – Incremental Volume Through the forecast period
- 4.3.2 Segment – Incremental Volume
- 4.4 Emerging Submarket Opportunity Deep Dive (Subject to Applicability)
- 4.5 Emerging Market Opportunity Scorecards
- 4.5.1 United States
- 4.5.2 Europe
- 4.5.3 Asia
- 4.5.4 Middle East & Africa
Note: Emerging Market Opportunity Scorecards will be included based on relevance and strategic importance. Regions listed are indicative and may vary depending on data availability and market dynamics.
Chapter 5. Biostimulators Import-Export Analysis & Trade Flows
- 5.1 Global Trade Overview
- 5.1.1 Global Export Value by Country (2018)
- 5.1.2 Global Export Volume by Country (2018)
- 5.1.3 Global Import Value by Country (2018)
- 5.1.4 Global Import Volume by Country (2018)
- 5.1.5 Net Trade Balance by Country (2018)
- 5.2 Export Analysis – Segment
- 5.2.1 Type 1 (HS Code)
- 5.2.2 Type 2 (HS Code)
- 5.2.3 Type 3 (HS Code)
- 5.2.4 Type 4 (HS Code)
- 5.2.5 Type 5 (HS Code)
- 5.3 Import Analysis – Segment
- 5.3.1 Type 1 (HS Code)
- 5.3.2 Type 2 (HS Code)
- 5.3.3 Type 3 (HS Code)
- 5.3.4 Type 4 (HS Code)
- 5.3.5 Type 5 (HS Code)
- 5.4 Average Unit Trade Prices
- 5.4.1 Average Export Price – Segment & Country
- 5.4.2 Average Import Price – Segment & Source Country
- 5.4.3 Price Trends (2018)
- 5.5 Key Trade Route Analysis
- 5.5.1 Trade Route 1
- 5.5.2 Trade Route 2
- 5.5.3 Trade Route 3
- 5.5.4 Trade Route 4
- 5.5.5 Trade Route 5
- 5.6 Trade Policy Impact Assessment
- 5.6.1 US Anti-Dumping & Section 301 Tariffs
- 5.6.2 EU Customs Union Impact
- 5.6.3 Major Free Trade Agreements
- 5.6.4 USMCA Rules of Origin
Note: Trade policy analysis will be included only where relevant to the Biostimulators market.
Chapter 6. Competitive Landscape & Company Benchmarking
- 6.1 Biostimulators Market Concentration & Structure
- 6.1.1 Herfindahl-Hirschman Index (HHI) – vs. 2018
- 6.1.2 Tier 1, Tier 2 & Tier 3 Market Structure
- 6.1.3 Global, Regional & Local Player Dynamics
- 6.2 Biostimulators Market Share Analysis – 2018
- 6.2.1 Global Revenue Share by Company
- 6.2.2 Global Volume Share by Company
- 6.2.3 Regional Revenue Share
- 6.2.4 Market Share Evolution ( vs. 2018)
- 6.2.5 OEM Segment Share by Company
- 6.2.6 Replacement Segment Share by Company
- 6.3 Production/Delivery Capacity & Facility Analysis
- 6.3.1 Global Installed Capacity
- 6.3.2 Capacity Utilization Rates
- 6.3.3 Production/Output Volume
- 6.3.4 Facility Locations & Capacity Map
- 6.3.5 Planned Capacity Additions
- 6.4 Biostimulators Competitive Benchmarking Matrix
- 6.4.1 Revenue, Volume, CAGR & Profitability Comparison
- 6.4.2 Channel Revenue Mix
- 6.4.3 Geographic Revenue Exposure
- 6.4.4 R&D Intensity
- 6.4.5 Sustainability Maturity
- 6.5 Strategic Developments in Biostimulators (Last 24 Months)
- 6.5.1 Mergers, Acquisitions & Divestments
- 6.5.2 New Biostimulators Launches
- 6.5.3 Facility Expansions
- 6.5.4 Strategic Alliances, Joint Ventures & Partnerships
- 6.5.5 Distribution Expansion & Market Entry
- 6.5.6 Sustainability & ESG Initiatives
- 6.6 Competitive Strategy Mapping
- 6.6.1 Leader, Challenger, Follower & Niche Classification
- 6.6.2 Pricing Strategy Comparison
- 6.6.3 Channel Strategy Matrix
Note: Strategic developments are included based on their materiality and the availability of reliable information.
Chapter 7. Global Biostimulators Market – By Distribution Channel
- 7.1 Segment Overview
- 7.1.1 Volume & Revenue Split by Channel (2018 & )
- 7.1.2 Channel Mix Evolution (the forecast period)
Chapter 8. Regional Market Analysis – Global Overview
- 8.1 Global Regional Overview
- 8.1.1 Regional Volume Share
- 8.1.2 Regional Revenue Share
- 8.1.3 Regional Volume by Region
- 8.1.4 Regional Revenue by Region
- 8.1.5 Regional Forecast Through the forecast period
- 8.2 Cross-Regional Segment Analysis
- 8.2.1 By Distribution Channel
- 8.2.2 By Brand/Price Tier
Chapter 9. North America Biostimulators Market
- 9.1 United States
- 9.2 Canada
- 9.3 Mexico
Chapter 10. Europe Biostimulators Market
- 10.1 Germany
- 10.2 France
- 10.3 Italy
- 10.4 United Kingdom
- 10.5 Spain
- 10.6 Poland
- 10.7 Russia
- 10.8 Netherlands
- 10.9 Belgium
- 10.10 Sweden
- 10.11 Denmark
- 10.12 Norway
- 10.13 Rest of Europe
Chapter 11. Asia Pacific Biostimulators Market
- 11.1 China
- 11.2 India
- 11.3 Japan
- 11.4 South Korea
- 11.5 Thailand
- 11.6 Indonesia
- 11.7 Vietnam
- 11.8 Malaysia
- 11.9 Australia
- 11.10 Rest of Asia Pacific
Chapter 12. Latin America Biostimulators Market
- 12.1 Brazil
- 12.2 Argentina
- 12.3 Colombia
- 12.4 Chile
- 12.5 Rest of Latin America
Chapter 13. Middle East Biostimulators Market
- 13.1 Saudi Arabia
- 13.2 United Arab Emirates
- 13.3 Turkey
- 13.4 Israel
- 13.5 Iran
- 13.6 Rest of the Middle East
Chapter 14. Africa Biostimulators Market
- 14.1 South Africa
- 14.2 Egypt
- 14.3 Nigeria
- 14.4 Morocco
- 14.5 Rest of Africa
Chapter 15. Biostimulators Company Profiles
- 15.1 [Company 01]
- 15.1.1 Company Overview
- 15.1.2 Key Management Personnel
- 15.1.3 Products & Services Portfolio
- 15.1.4 Financial Performance
- 15.1.5 Key Market Focus & Geographic Presence
- 15.1.6 Recent Developments & Strategic Initiatives
Note: The company profile list is preliminary and may change based on research findings, market developments, data availability, and client requirements.
Chapter 16. Appendices
- Appendix A – List of Abbreviations & Acronyms
- Appendix B – Industry Classification Code Reference – Full Series
- Appendix C – Production & Capacity Data Tables
- Appendix D – End-Use & Demand Base Tables
- Appendix E – Consumption & Replacement Rate Assumptions
- Appendix F – ASP Reference Tables
- Appendix G – Manufacturing & Facility Database
- Appendix H – Import-Export Data Tables
- Appendix I – Regulatory Summary Tables
- Appendix J – Primary Research Participant List (Anonymized)
- Appendix K – Primary Research Questionnaire Framework
- Appendix L – Data Sources & Bibliography
- Appendix M – Market Size Divergence & Source Comparison
Chapter 17. Research Methodology
- 17.1 Research Framework & Philosophy
- 17.2 Secondary Research – Sources, Hierarchy & Data Extraction
- 17.3 Data Modeling – Bottom-Up & Top-Down Market Sizing
- 17.4 Primary Research – Stakeholder Framework, LOI & Sample Sizes
- 17.5 Forecast Methodology – Regression, Scenario & Sensitivity Analysis
- 17.6 Quality Control – Four-Layer Validation Framework
- 17.7 Limitations & Standard Assumptions
- 17.8 Disclaimer
