
Butterfly Needle Sets Market
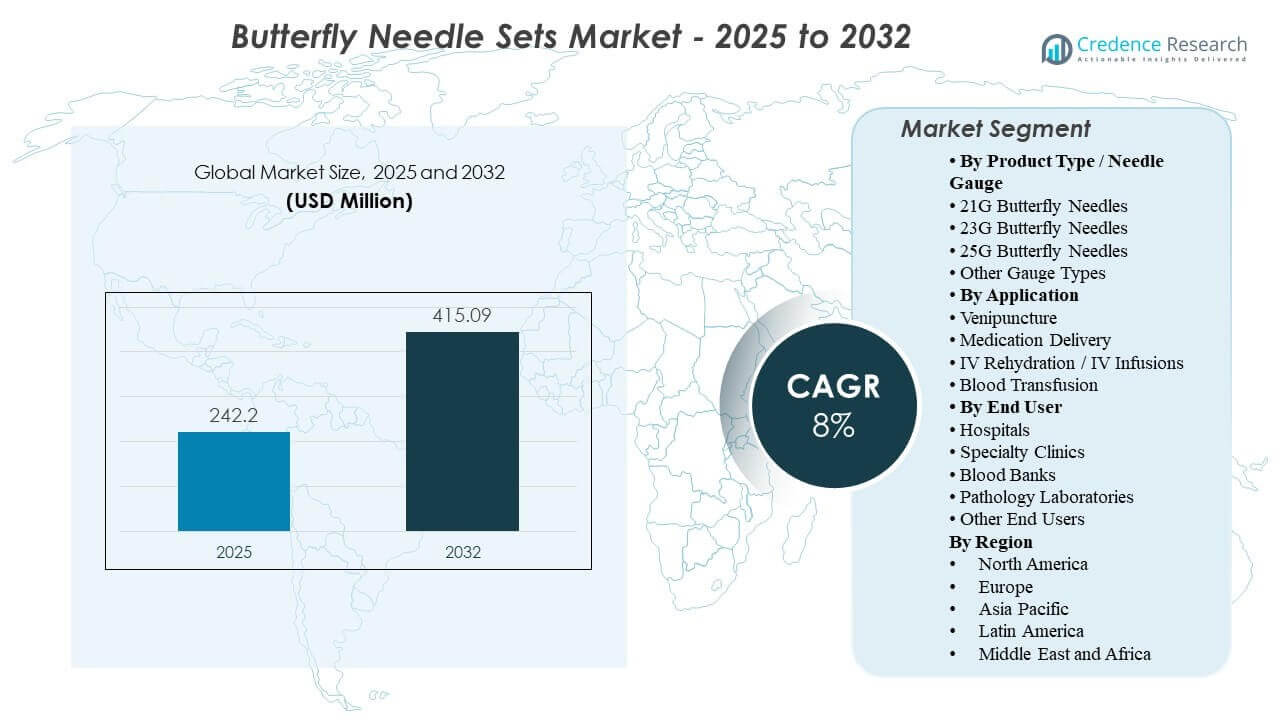
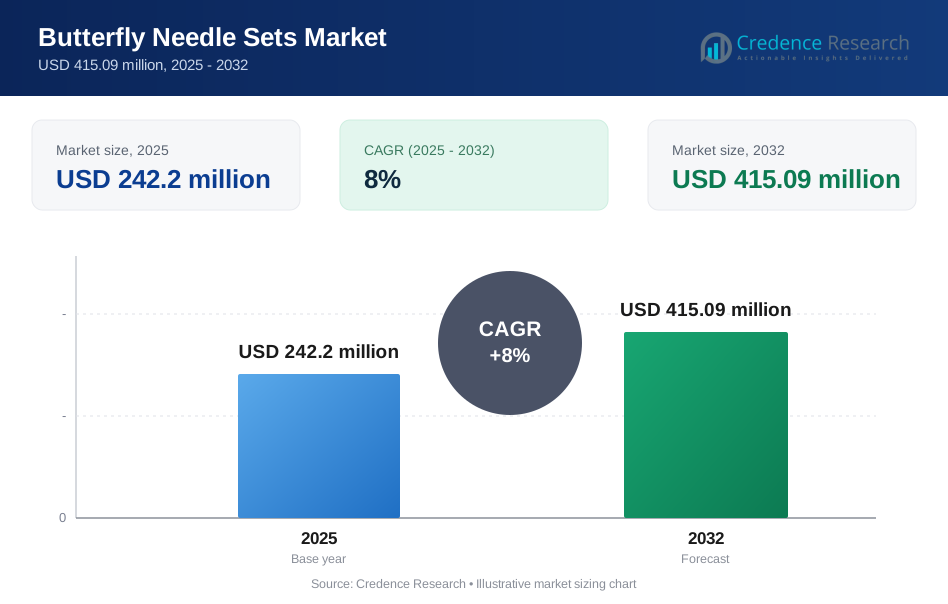
The global Butterfly Needle Sets Market size was estimated at USD 242.2 million in 2025 and is expected to reach USD 415.09 million by 2032, growing at a CAGR of 8% from 2025 to 2032. Growth is primarily supported by the sustained increase in routine blood collection and short-duration infusion procedures across hospitals, diagnostic laboratories, and outpatient settings where stable venous access and consistent first-stick performance are critical. Demand remains strongest in mature healthcare systems, while expanding diagnostic capacity in emerging markets continues to broaden the installed base of blood collection consumables.
| REPORT ATTRIBUTE | DETAILS |
|---|---|
| Historical Period | 2020-2023 |
| Base Year | 2024 |
| Forecast Period | 2025-2032 |
| Butterfly Needle Sets Market Size 2025 | USD 242.2 Million |
| Butterfly Needle Sets Market, CAGR | 8% |
| Butterfly Needle Sets Market Size 2032 | USD 415.09 Million |
Key Market Trends & Insights
- The Butterfly Needle Sets Market is projected to expand from USD 242.2 million (2025) to USD 415.09 million (2032) at a CAGR of 8% (2025–2032).
- 23G Butterfly Needles represented 42.0% share in 2025, reflecting broad preference for balancing flow performance and patient comfort in routine venipuncture.
- Blood Transfusion accounted for 61.3% share in 2025, indicating continued reliance on butterfly sets for controlled access in transfusion-related workflows.
- Hospitals contributed 56.5% share in 2025, supported by high procedure volumes across inpatient, emergency, and perioperative pathways.
- North America held 38.9% share in 2025, driven by high diagnostic testing intensity and standardized procurement across large provider networks.
Segment Analysis
The Butterfly Needle Sets Market is shaped by repeat-use clinical workflows where buyers prioritize handling stability, patient comfort, and consistent performance across high-throughput phlebotomy environments. Purchasing decisions typically focus on gauge standardization, ease of use across varying staff experience levels, and compatibility with established blood collection and infusion routines. Safety expectations also influence adoption as healthcare providers emphasize sharps-injury reduction practices and standardized training for routine venous access procedures.
Segment performance is also influenced by the increasing clinical burden of chronic disease monitoring that requires frequent blood draws, alongside growing preventive screening volumes. Gauge selection reflects trade-offs between flow rate requirements and vein fragility across adult, pediatric, and geriatric populations. Application demand remains concentrated in transfusion and related blood access workflows where stability and control are important for short-duration access. End-user concentration in hospitals persists due to scale and procedural density, although blood banks and diagnostic networks continue to increase consumption as collection footprints expand.
By Product Type / Needle Gauge Insights
23G Butterfly Needles accounted for the largest share of 42.0% in 2025. The 23G gauge leads because it supports routine venipuncture with a practical balance of flow efficiency and patient comfort in everyday clinical settings. Healthcare providers often standardize around 23G to reduce variation across staff technique and to simplify procurement and inventory planning. The gauge is also well aligned with high-volume blood collection workflows in hospitals and laboratories that prioritize consistent first-stick outcomes.
By Application Insights
Blood Transfusion accounted for the largest share of 61.3% in 2025. Blood transfusion leads because transfusion-related workflows require controlled venous access across diverse patient populations, including patients with fragile veins and complex care needs. Butterfly needle sets are frequently used where stability and handling control support monitored administration and short-duration access needs. High transfusion procedure intensity in acute-care environments reinforces recurring consumption and sustained demand in this application.
By End User Insights
Hospitals accounted for the largest share of 56.5% in 2025. Hospitals lead because they concentrate large volumes of venipuncture, infusion, and transfusion procedures across multiple departments and patient acuity levels. Hospital procurement teams typically standardize consumables to support consistent training, protocol adherence, and supply-chain efficiency across wards and outpatient departments. Centralized purchasing and high daily throughput sustain higher unit consumption compared with smaller specialty clinics and standalone facilities.
Butterfly Needle Sets Market Drivers
Growth in routine diagnostic testing and chronic disease monitoring
Rising diagnostic testing volumes support steady demand for butterfly needle sets across hospitals and laboratories. Chronic disease management requires repeated blood draws for monitoring and therapy optimization, increasing procedure frequency over time. Screening programs also expand routine collection volumes, particularly in mature healthcare systems. These dynamics elevate the importance of reliable venous access tools that support consistent performance and efficient patient throughput.
- For instance, Becton Dickinson’s BD Vacutainer UltraTouch Push Button Blood Collection Set combines a 25G 5-bevel needle with an ultra-thin wall cannula, lowering penetration force to 34.5 g versus 50.6 g for a traditional 23G wingset, a 32% reduction, while 56% of pediatric patients reported no pain and 5 mL tube fill times were reduced by 50% versus BD’s 23G push-button wingset.
Sharps safety practices and workflow standardization in healthcare facilities
Healthcare facilities increasingly adopt standardized consumables to reduce variability and support safer clinical practice. Butterfly needle sets benefit when organizations implement consistent phlebotomy protocols that emphasize handling control and predictable performance. Training alignment across large staff pools increases demand for products that are easy to use and support consistent outcomes. Safety-driven purchasing also encourages replacement cycles and vendor consolidation with suppliers that can support supply reliability.
Expansion of outpatient care and specialty service delivery
Outpatient care growth increases venipuncture and short-duration infusion procedures outside the hospital core. Specialty clinics and ambulatory centers value devices that streamline workflow, reduce setup time, and support patient experience objectives. Butterfly needle sets align with these priorities in routine blood draws and short access needs. As care delivery shifts toward distributed networks, consumption grows across a wider range of sites.
- For instance, Greiner Bio-One’s VACUETTE Safety Blood Collection Set is designed for blood collection or infusions for up to 5 hours and is offered in 21G and 23G formats with 19 cm and 30 cm tubing options, which fits the operational needs of ambulatory and specialty care settings handling short-duration access procedures.
Scaling of blood collection infrastructure and collection-point networks
Blood banks and diagnostic networks continue to expand collection footprints, increasing the volume of routine blood access procedures. Growth in collection sites increases recurring consumable demand and strengthens supplier opportunities for standardized gauge portfolios. Operational efficiency requirements in collection settings drive preference for consistent products and dependable distribution coverage. This expansion supports both volume growth and broader geographic adoption.
Butterfly Needle Sets Market Challenges
Procurement-driven price pressure remains a persistent challenge because butterfly needle sets are high-volume consumables often purchased under competitive tenders and framework agreements. Buyers may prioritize unit cost unless operational efficiency or safety benefits are clearly demonstrated, which can limit supplier differentiation. Frequent contract rebids can compress margins and increase pricing volatility across regions. Cost sensitivity is particularly pronounced in price-regulated markets and in systems with centralized purchasing controls.
- For example, BD says its Vacutainer UltraTouch Push Button Blood Collection Set enables single-handed, in-vein needle retraction and can cut accidental needlesticks by up to 88% versus traditional wingsets. In one hospital rollout cited at launch, butterfly-needle needlestick injuries dropped 88%, with zero incidents in the final 21 months, supporting premium pricing based on measurable safety gains.
Operational variability across end users can also constrain uniform adoption because procedure mix, staff training intensity, and protocol adherence differ widely between hospitals, clinics, and laboratories. Inventory complexity increases when facilities carry multiple gauges and configurations to serve diverse patient groups, raising logistics and forecasting requirements. Supply disruptions can quickly impact routine operations due to the essential nature of blood collection supplies. These factors can extend evaluation cycles and slow product conversions for large accounts.
Butterfly Needle Sets Market Trends and Opportunities
Healthcare systems are increasingly optimizing gauge mix and standardizing preferred configurations to improve workflow consistency across sites. Suppliers that provide broad gauge portfolios and support training-friendly product selection can strengthen long-term account retention. Opportunities also expand through distribution partnerships that improve availability across outpatient networks and collection centers. Product positioning that emphasizes ease of use and procedural consistency can support wins in high-throughput settings.
Growth in diagnostic capacity across emerging markets creates opportunities as laboratories and collection networks expand and formalize standardized practices. Facilities seek dependable supply, stable performance, and simplified inventory management as procedure volumes rise. Companies that can support local distribution and consistent fulfillment can accelerate adoption in underserved regions. Targeted offerings for pediatric, geriatric, and difficult-access segments also provide a practical differentiation route.
- For instance, Nipro’s Blood Collection Set is available in 21G, 22G, and 23G variants with minimum flow rates of 15.0 ml/min, 12.0 ml/min, and 7.0 ml/min respectively at 190 mm tubing and a 0.39 ml priming volume across all three versions.
Regional Insights
North America
North America accounted for 38.9% of revenue in 2025. Regional demand is supported by high diagnostic testing intensity and strong utilization across hospitals, laboratories, and outpatient centers. Standardized procurement and protocol-driven phlebotomy workflows contribute to consistent product consumption. Mature distribution networks and stable purchasing cycles support recurring demand across large provider systems.
Europe
Europe accounted for 27.4% of revenue in 2025. Demand is supported by established healthcare infrastructure and sustained routine diagnostic activity in hospital and outpatient settings. Procurement systems emphasize standardization and supply continuity, reinforcing steady consumable usage. Growth opportunities remain linked to expanding outpatient services and continued focus on workflow efficiency in blood collection.
Asia Pacific
Asia Pacific accounted for 22.7% of revenue in 2025. Expansion in healthcare access and diagnostic testing capacity supports rising procedure volumes, particularly in major urban centers. Growth is reinforced by scaling hospital throughput and broader laboratory network development. Improving procurement formalization and distribution coverage continues to expand market penetration across the region.
Latin America
Latin America accounted for 6.6% of revenue in 2025. Demand is concentrated in large metropolitan healthcare systems and diagnostic laboratories where routine blood collection volumes are highest. Cost sensitivity influences product selection and procurement outcomes, emphasizing value and distribution reliability. Expanding outpatient services and laboratory access support gradual demand growth over time.
Middle East & Africa
Middle East & Africa accounted for 4.4% of revenue in 2025. Demand is supported by ongoing healthcare infrastructure investment in select markets and steady utilization in hospitals and diagnostic facilities. Growth is uneven across countries due to differences in funding levels, procurement maturity, and access to routine diagnostics. Opportunities are strongest where private healthcare networks and centralized hospital systems are expanding.
Competitive Landscape
The Butterfly Needle Sets Market is competitive and shaped by gauge portfolio breadth, supply reliability, and the ability to support standardized clinical workflows across large healthcare accounts. Manufacturers differentiate through consistent product performance, ease of handling, training simplicity, and distribution reach, particularly in tender-based procurement environments. Competitive positioning also reflects supplier capability to maintain quality and continuity at scale for high-volume hospital and laboratory demand. Strategic priorities often include contract wins with integrated delivery networks, distributor alignment, and incremental product refinements that improve usability and procedure consistency.
Becton, Dickinson and Company (BD) remains a leading participant through scale manufacturing, broad medical consumables coverage, and strong relationships with large healthcare systems. BD commonly focuses on supply continuity, consistent product specifications, and alignment with standardized clinical protocols across multi-site provider networks. BD’s approach supports recurring demand in high-throughput hospital and diagnostic settings where procurement favors dependable fulfillment and uniform device performance. Investments in production and operational resilience strengthen BD’s competitiveness in long-term contracts and high-volume channels.
The industry research and growth report includes detailed analyses of the competitive landscape of the market and information about key companies, including:
- Becton, Dickinson and Company (BD)
- Terumo Corporation
- Cardinal Health, Inc.
- Nipro Corporation
- ICU Medical, Inc.
- Smiths Medical
- B. Braun Melsungen AG
- Medline Industries, Inc.
- Kawasumi Laboratories, Inc.
- ISO-MED
- BioMatrix S.r.l.
Qualitative and quantitative analysis of companies has been conducted to help clients understand the wider business environment as well as the strengths and weaknesses of key industry players. Data is qualitatively analyzed to categorize companies as pure play, category-focused, industry-focused, and diversified; it is quantitatively analyzed to categorize companies as dominant, leading, strong, tentative, and weak.
Recent Developments
- In December 2024, Haemonetics announced a definitive agreement to sell its whole blood assets to GVS, S.p.A., marking an acquisition-related update relevant to companies involved in blood collection systems. The transaction covers Haemonetics’ portfolio of proprietary whole blood collection, processing, and filtration solutions, along with manufacturing assets in Covina, California, and related equipment in Tijuana, Mexico.
- In November 2024, Terumo Blood and Cell Technologies announced a strategic partnership with Terumo Medical Products (Hangzhou) Co., Ltd. and said it would invest in the Hangzhou production facility to support locally made medical products for China. The company stated that the site would manufacture devices used to collect and separate blood and cells, linking the partnership to the broader blood collection device ecosystem that includes butterfly needle set participants.
- In April 2024, BD (Becton, Dickinson, and Company) launched the BD Vacutainer UltraTouch Push Button Blood Collection Set in India, making it one of the clearest recent product launches tied to the butterfly-style blood collection segment. The company said the device was designed to reduce patient pain, improve single-prick success, and use RightGauge, PentaPoint, and push-button safety technologies during blood collection.
Report Scope
| Report Attribute | Details |
| Market size value in 2025 | USD 242.2 million |
| Revenue forecast in 2032 | USD 415.09 million |
| Growth rate (CAGR) | 8% (2025–2032) |
| Base year | 2025 |
| Forecast period | 2025–2032 |
| Quantitative units | USD million |
| Segments covered | By Product Type / Needle Gauge; By Application; By End User |
| Regional scope | North America, Europe, Asia Pacific, Latin America, Middle East & Africa |
| Key companies profiled | Becton, Dickinson and Company (BD), Terumo Corporation, Cardinal Health, Inc., Nipro Corporation, ICU Medical, Inc., Smiths Medical, B. Braun Melsungen AG, Medline Industries, Inc., Kawasumi Laboratories, Inc., ISO-MED, BioMatrix S.r.l. |
| No. of Pages | 330 |
Segmentation
By Product Type / Needle Gauge
- 21G Butterfly Needles
- 23G Butterfly Needles
- 25G Butterfly Needles
- Other Gauge Types
By Application
- Venipuncture
- Medication Delivery
- IV Rehydration / IV Infusions
- Blood Transfusion
By End User
- Hospitals
- Specialty Clinics
- Blood Banks
- Pathology Laboratories
- Other End Users
By Region
-
- North America
- U.S.
- Canada
- Mexico
- Europe
- Germany
- France
- U.K.
- Italy
- Spain
- Rest of Europe
- Asia Pacific
- China
- Japan
- India
- South Korea
- South-east Asia
- Rest of Asia Pacific
- Latin America
- Brazil
- Argentina
- Rest of Latin America
- Middle East & Africa
- GCC Countries
- South Africa
- Rest of the Middle East and Africa
Request a Free Sample
Fill in your details and we'll send you a free sample report.
- Sample data tables & charts
- Research methodology
Need a Custom Version of This Report?
Tailor the scope, geography, or segments to your exact requirements.
- Custom geography or segment scope
- Direct access to our analyst team
Frequently Asked Questions
What is the current size of the Butterfly Needle Sets Market?
What is the forecast value of the Butterfly Needle Sets Market?
What is the growth rate of the Butterfly Needle Sets Market?
Which product type / needle gauge segment leads the Butterfly Needle Sets Market?
Which application segment is the largest contributor in the Butterfly Needle Sets Market?
Which end-user segment dominates the Butterfly Needle Sets Market?
Which region leads the Butterfly Needle Sets Market?
Table of Content
Chapter 1. Report Introduction
- 1.1 Report Description & Purpose
- 1.1.1 Report Title & Market Definition
- 1.1.2 Unique Selling Propositions (USP) & Key Differentiators
- 1.1.3 Value Proposition for Stakeholders
- 1.2 Research Objectives
- 1.2.1 Market Sizing Objectives (Volume & Revenue) (Volume Where Applicable)
- 1.2.2 Segmentation Objectives
- 1.2.3 Competitive Intelligence Objectives
- 1.2.4 Forecast & Scenario Objectives
- 1.3 Report Scope
- 1.3.1 Butterfly Needle Sets Scope – Segments & Subsegments Covered
- 1.3.2 Geographic Scope – Regions & Countries Covered
- 1.3.3 Historical Period, Base Year & Forecast Period (2025; forecast to 2032)
- 1.3.4 Inclusions & Exclusions
- 1.4 Industry Classification & Applicable Codes
- 1.5 Currency, Measurement Units & Valuation Basis
- 1.6 Target Stakeholders
- 1.7 Limitations & Assumptions
Chapter 2. Executive Summary
- 2.1 Global Butterfly Needle Sets Market Snapshot
- 2.1.1 Market Size – Historical (2025) & Forecast (2025-2032) (2025: USD 242.2 million → 2032: USD 415.09 million)
- 2.1.2 Volume & Revenue – Global Totals (Volume Where Applicable)
- 2.1.3 Key Market Highlights – Top Five Facts
- 2.2 Butterfly Needle Sets Market Segmentation Snapshot
- 2.2.1 Market Split by Region – 2025 vs. 2032
- 2.3 Competitive Snapshot
- 2.3.1 Top 10 Players by Revenue Share – 2025
- 2.3.2 Top 10 Players by Volume Share – 2025 (Volume Where Applicable)
- 2.3.3 Recent Strategic Developments (18-Month Summary)
- 2.4 Key Investment Highlights & Strategic Conclusions
Chapter 3. Butterfly Needle Sets Market Dynamics & Industry Analysis
- 3.1 Market Overview & Context
- 3.1.1 Butterfly Needle Sets Market Position in the Broader Industry Value Chain
- 3.1.2 Demand Structure & Purchasing Dynamics
- 3.1.3 Market Maturity & Development Stage by Region
- 3.2 Butterfly Needle Sets Market Drivers
- 3.3 Butterfly Needle Sets Market Restraints & Challenges
- 3.4 Butterfly Needle Sets Market Opportunities
- 3.5 Porter's Five Forces Analysis
- 3.5.1 Threat of New Entrants
- 3.5.2 Bargaining Power of Suppliers
- 3.5.3 Bargaining Power of Buyers
- 3.5.4 Threat of Substitutes
- 3.5.5 Competitive Rivalry – Intensity Assessment
- 3.6 Butterfly Needle Sets Value Chain Analysis
- 3.6.1 Upstream – Key Inputs, Resources & Suppliers
- 3.6.1.1 Key Input/Resource 1
- 3.6.1.2 Key Input/Resource 2
- 3.6.1.3 Key Input/Resource 3
- 3.6.2 Midstream – Core Operations & Value Creation
- 3.6.2.1 Operating Model & Process Overview
- 3.6.2.2 Key Operating Locations & Capabilities by Company
- 3.6.3 Downstream – Market Channels & End Users
- 3.6.3.1 Direct Sales & Customer Engagement Channels
- 3.6.3.2 Indirect Sales, Intermediaries & Partner Channels
- 3.6.4 Value Chain Profitability Analysis
- 3.6.1 Upstream – Key Inputs, Resources & Suppliers
- 3.7 PESTEL Analysis
- 3.7.1 Political Factors
- 3.7.2 Economic Factors
- 3.7.3 Social Factors
- 3.7.4 Technological Factors
- 3.7.5 Environmental Factors
- 3.7.6 Legal Factors
- 3.8 Butterfly Needle Sets Supply Chain Analysis
- 3.8.1 Critical Input & Resource Availability Risk Assessment
- 3.8.2 Supplier & Operational Concentration Risk (Geographic Exposure)
- 3.8.3 Supply & Service Disruption Impact Analysis
- 3.9 Regulatory & Policy Landscape
Note: The regulatory and policy landscape section covers regulations based on their applicability to the market, Butterfly Needle Sets category, geography, and scope of the study. Only regulatory frameworks with a material impact on operations, compliance, trade, sustainability, or market access are analyzed in detail.
Chapter 4. Key Investment Pockets & Opportunity Analysis
- 4.1 Butterfly Needle Sets Market Attractiveness Analysis
- 4.1.1 By Region – Investment Attractiveness Matrix (Market Size × CAGR)
- 4.2 Absolute Revenue Growth Opportunity
- 4.2.1 By Region – Absolute Revenue Growth Through 2032
- 4.3 Incremental Demand Opportunity
- 4.3.1 By Region – Incremental Demand Through 2032
- 4.3.2 Segment – Incremental Demand
- 4.4 Emerging Submarket Opportunity Deep Dive (Subject to Applicability)
- 4.5 Priority Market Opportunity Scorecards
- 4.5.1 United States
- 4.5.2 Europe
- 4.5.3 Asia
- 4.5.4 Middle East & Africa
Note: Priority market opportunity scorecards reflect the geographic scope and strategic relevance of the study. Listed markets are indicative and may be adapted to the industry.
Chapter 5. Butterfly Needle Sets Cross-Border Trade & Market Access Analysis
- 5.1 International Trade & Cross-Border Activity Overview
- 5.1.1 Global Export Value by Country (2025)
- 5.1.2 Global Export Volume by Country (2025) (Volume Where Applicable)
- 5.1.3 Global Import Value by Country (2025)
- 5.1.4 Global Import Volume by Country (2025) (Volume Where Applicable)
- 5.1.5 Net Trade Balance by Country (2025)
- 5.2 Export Analysis – Segment
- 5.2.1 Category 1 (Applicable Classification Code)
- 5.2.2 Category 2 (Applicable Classification Code)
- 5.2.3 Category 3 (Applicable Classification Code)
- 5.2.4 Category 4 (Applicable Classification Code)
- 5.2.5 Category 5 (Applicable Classification Code)
- 5.3 Import Analysis – Segment
- 5.3.1 Category 1 (Applicable Classification Code)
- 5.3.2 Category 2 (Applicable Classification Code)
- 5.3.3 Category 3 (Applicable Classification Code)
- 5.3.4 Category 4 (Applicable Classification Code)
- 5.3.5 Category 5 (Applicable Classification Code)
- 5.4 Cross-Border Pricing & Transaction Benchmarks
- 5.4.1 Export Pricing – Segment & Country
- 5.4.2 Import Pricing – Segment & Source Country
- 5.4.3 Price Trends (2025)
- 5.5 Key Cross-Border Trade & Delivery Routes
- 5.5.1 Cross-Border Trade/Delivery Route 1
- 5.5.2 Cross-Border Trade/Delivery Route 2
- 5.5.3 Cross-Border Trade/Delivery Route 3
- 5.5.4 Cross-Border Trade/Delivery Route 4
- 5.5.5 Cross-Border Trade/Delivery Route 5
- 5.6 Trade Policy & Market Access Impact Assessment
- 5.6.1 Tariff & Non-Tariff Barriers
- 5.6.2 Regional Trade & Economic Integration Frameworks
- 5.6.3 Bilateral & Multilateral Trade Agreements
- 5.6.4 Cross-Border Operating, Licensing & Localization Requirements
Note: This chapter applies where cross-border trade or delivery is relevant to Butterfly Needle Sets. Goods, services, and digital offerings are assessed using applicable classifications and transaction measures. Import-export volumes, trade balances, and route analyses are included only where meaningful to the market.
Chapter 6. Competitive Landscape & Company Benchmarking
- 6.1 Butterfly Needle Sets Market Concentration & Structure
- 6.1.1 Herfindahl-Hirschman Index (HHI) – vs. 2025
- 6.1.2 Leading, Mid-Sized & Emerging Player Structure
- 6.1.3 Global, Regional & Local Player Dynamics
- 6.2 Butterfly Needle Sets Market Share Analysis – 2025
- 6.2.1 Global Revenue Share by Company
- 6.2.2 Global Volume Share by Company (Volume Where Applicable)
- 6.2.3 Regional Revenue Share
- 6.2.4 Market Share Evolution ( vs. 2025)
- 6.2.5 Company Market Share by Key Segment
- 6.2.6 Company Market Share by Customer Group
- 6.3 Operating Scale, Capacity & Infrastructure Analysis
- 6.3.1 Global Operating Scale & Supply Capacity
- 6.3.2 Resource Utilization & Operating Efficiency
- 6.3.3 Output, Service Delivery & Activity Metrics
- 6.3.4 Operating Footprint & Infrastructure Map
- 6.3.5 Planned Operational & Capacity Expansion
- 6.4 Butterfly Needle Sets Competitive Benchmarking Matrix
- 6.4.1 Revenue, Growth, Profitability & Operating Metric Comparison
- 6.4.2 Channel Revenue Mix
- 6.4.3 Geographic Revenue Exposure
- 6.4.4 R&D Intensity
- 6.4.5 Sustainability Maturity
- 6.5 Strategic Developments in Butterfly Needle Sets (Last 24 Months)
- 6.5.1 Mergers, Acquisitions & Divestments
- 6.5.2 New Products, Services & Solutions in Butterfly Needle Sets
- 6.5.3 Operational & Infrastructure Expansions
- 6.5.4 Strategic Alliances, Joint Ventures & Partnerships
- 6.5.5 Distribution Expansion & Market Entry
- 6.5.6 Sustainability & ESG Initiatives
- 6.6 Competitive Strategy Mapping
- 6.6.1 Leader, Challenger, Follower & Niche Classification
- 6.6.2 Pricing Strategy Comparison
- 6.6.3 Channel Strategy Matrix
Note: Strategic developments are included based on their materiality and the availability of reliable information.
Chapter 7. Global Butterfly Needle Sets Market – By Sales & Delivery Channel
- 7.1 Segment Overview
- 7.1.1 Volume & Revenue Split by Channel (2025 & 2032) (Volume Where Applicable)
- 7.1.2 Channel Mix Evolution (2025-2032)
Chapter 8. Regional Market Analysis – Global Overview
- 8.1 Global Regional Overview
- 8.1.1 Regional Volume Share (Volume Where Applicable)
- 8.1.2 Regional Revenue Share
- 8.1.3 Regional Volume by Region (Volume Where Applicable)
- 8.1.4 Regional Revenue by Region
- 8.1.5 Regional Forecast Through 2032
- 8.2 Cross-Regional Segment Analysis
- 8.2.1 By Sales & Delivery Channel
- 8.2.2 By Competitive Positioning & Price Tier
Chapter 9. North America Butterfly Needle Sets Market
- 9.1 United States
- 9.2 Canada
- 9.3 Mexico
Chapter 10. Europe Butterfly Needle Sets Market
- 10.1 Germany
- 10.2 France
- 10.3 Italy
- 10.4 United Kingdom
- 10.5 Spain
- 10.6 Poland
- 10.7 Russia
- 10.8 Netherlands
- 10.9 Belgium
- 10.10 Sweden
- 10.11 Denmark
- 10.12 Norway
- 10.13 Rest of Europe
Chapter 11. Asia Pacific Butterfly Needle Sets Market
- 11.1 China
- 11.2 India
- 11.3 Japan
- 11.4 South Korea
- 11.5 Thailand
- 11.6 Indonesia
- 11.7 Vietnam
- 11.8 Malaysia
- 11.9 Australia
- 11.10 Rest of Asia Pacific
Chapter 12. Latin America Butterfly Needle Sets Market
- 12.1 Brazil
- 12.2 Argentina
- 12.3 Colombia
- 12.4 Chile
- 12.5 Rest of Latin America
Chapter 13. Middle East Butterfly Needle Sets Market
- 13.1 Saudi Arabia
- 13.2 United Arab Emirates
- 13.3 Turkey
- 13.4 Israel
- 13.5 Iran
- 13.6 Rest of the Middle East
Chapter 14. Africa Butterfly Needle Sets Market
- 14.1 South Africa
- 14.2 Egypt
- 14.3 Nigeria
- 14.4 Morocco
- 14.5 Rest of Africa
Chapter 15. Butterfly Needle Sets Company Profiles
- 15.1 [Company 01]
- 15.1.1 Company Overview
- 15.1.2 Key Management Personnel
- 15.1.3 Products & Services Portfolio
- 15.1.4 Financial Performance
- 15.1.5 Key Market Focus & Geographic Presence
- 15.1.6 Recent Developments & Strategic Initiatives
Note: The company profile list is preliminary and may change based on research findings, market developments, data availability, and client requirements.
Chapter 16. Appendices
- Appendix A – List of Abbreviations & Acronyms
- Appendix B – Industry Classification Code Reference – Full Series
- Appendix C – Supply, Output & Operating Capacity Data Tables
- Appendix D – End-Use & Demand Base Tables
- Appendix E – Demand, Adoption & Usage Assumptions
- Appendix F – Pricing & Revenue Metric Reference Tables
- Appendix G – Company Operations & Infrastructure Database
- Appendix H – Cross-Border Trade & Activity Data Tables (Where Applicable)
- Appendix I – Regulatory Summary Tables
- Appendix J – Primary Research Participant List (Anonymized)
- Appendix K – Primary Research Questionnaire Framework
- Appendix L – Data Sources & Bibliography
- Appendix M – Market Size Divergence & Source Comparison
Chapter 17. Research Methodology
- 17.1 Research Framework & Philosophy
- 17.2 Secondary Research – Sources, Hierarchy & Data Extraction
- 17.3 Data Modeling – Bottom-Up & Top-Down Market Sizing
- 17.4 Primary Research – Stakeholder Framework, LOI & Sample Sizes
- 17.5 Forecast Methodology – Regression, Scenario & Sensitivity Analysis
- 17.6 Quality Control – Four-Layer Validation Framework
- 17.7 Limitations & Standard Assumptions
- 17.8 Disclaimer
