
Cardiac Mapping Market Overview:
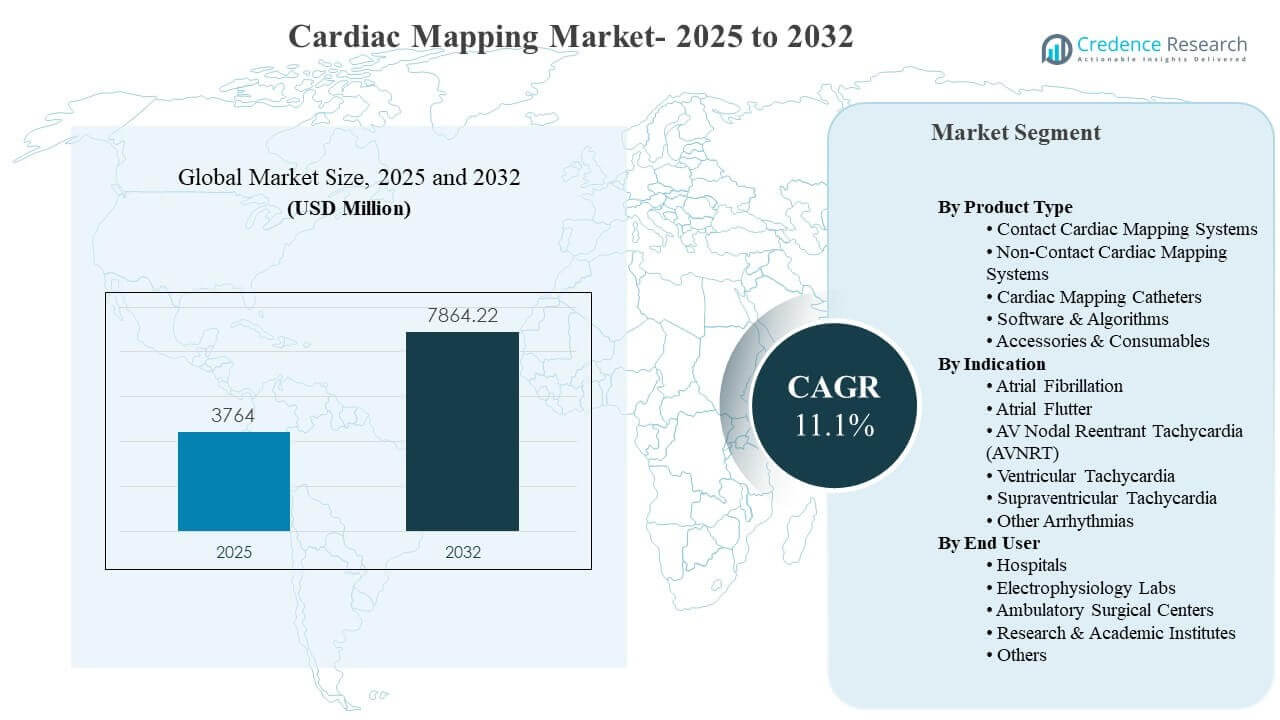
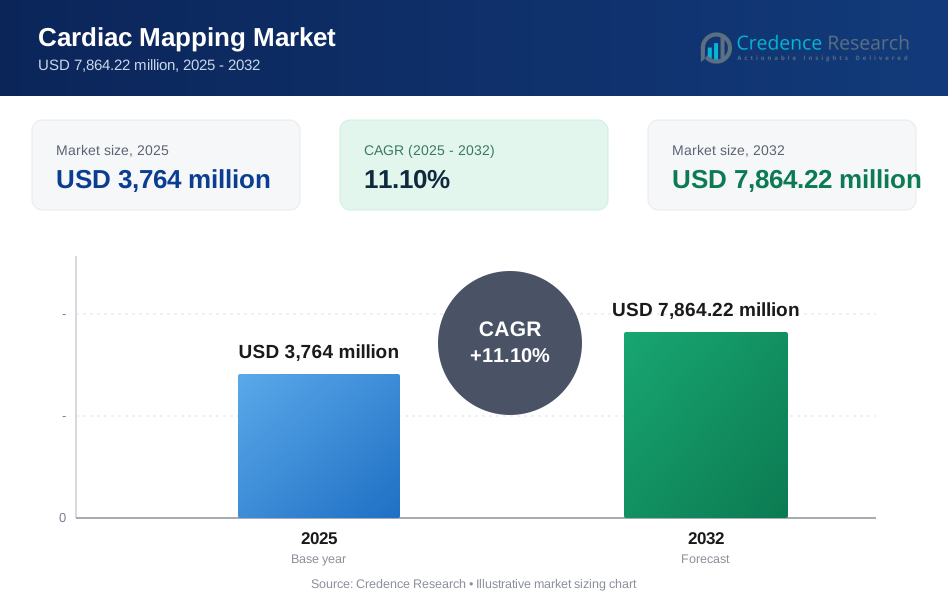
The global Cardiac mapping market size was estimated at USD 3,764 million in 2025 and is expected to reach USD 7,864.22 million by 2032, growing at a CAGR of 11.1% from 2025 to 2032. Growth momentum is primarily driven by rising electrophysiology procedure volumes for complex arrhythmias, where accurate localization of conduction pathways improves ablation planning and procedural confidence. Adoption is further supported by ongoing upgrades in EP lab infrastructure and steady integration of advanced visualization, automation, and data-driven mapping workflows across major hospital networks.
| REPORT ATTRIBUTE | DETAILS |
|---|---|
| Historical Period | 2020-2024 |
| Base Year | 2025 |
| Forecast Period | 2026-2032 |
| Cardiac Mapping Market Size 2025 | USD 3,764 million |
| Cardiac Mapping Market, CAGR | 11.1% |
| Cardiac Mapping Market Size 2032 | USD 7,864.22 million |
Key Market Trends & Insights
- The Cardiac mapping market expands from USD 3,764 million (2025) to USD 7,864.22 million (2032), reflecting sustained scale-up in mapping procedure demand.
- Market growth is projected at a 11.1% CAGR (2025–2032), supported by higher mapping utilization per ablation case and broader EP lab modernization.
- Electroanatomical mapping represents a leading technology block at 51.9% (2025), reflecting preference for high-resolution 3D reconstruction and reliable signal interpretation.
- Atrial fibrillation is a key indication driver at 41.6% (2025) due to recurring AF case volumes and the need to identify irregular conduction patterns and substrates.
- North America contributes 36.9% (2025), with Europe at 30.6% (2025) and Asia Pacific at 26.8% (2025) indicating broad multi-region demand for advanced mapping systems.
Segment Analysis
Cardiac mapping market demand is increasingly shaped by the shift toward high-precision workflows for complex arrhythmias, where clinicians rely on robust signal fidelity and fast chamber geometry creation to reduce uncertainty during catheter navigation. EP teams prioritize platforms that streamline mapping steps, improve interpretation of fractionated signals, and support confirmation of lesion completeness during ablation procedures. Strong preference is emerging for integrated ecosystems that combine mapping, visualization, and procedural guidance within a single workflow.
Cardiac mapping market purchasing decisions also reflect practical EP lab needs such as compatibility with existing capital equipment, consumables pull-through, training support, and consistent outcomes across operators. Technology roadmaps focused on automation and AI-assisted features are improving usability by shortening mapping time and supporting more standardized protocols. Demand growth is also reinforced by a wider installation base in high-volume hospitals and electrophysiology labs that repeatedly upgrade software modules and accessories.
By Product Type Insights
Contact Cardiac Mapping Systems lead product adoption because contact-based mapping supports detailed point-by-point acquisition and high-density mapping that improves localization of arrhythmogenic tissue. Many electrophysiology teams prefer contact mapping for complex cases that require accurate substrate characterization and reliable voltage interpretation. Integration of advanced 3D visualization and workflow automation also reinforces use of contact systems in high-throughput EP environments. Consumables linkage through mapping catheters and accessories further strengthens repeat demand for contact-based platforms.
By Indication Insights
Atrial Fibrillation accounted for the largest share of 41.6% in 2025. Atrial fibrillation procedures generate high mapping utilization because irregular conduction patterns often require refined chamber reconstruction and iterative signal review before ablation decisions. Clinical focus on durable pulmonary vein isolation and improved outcomes increases reliance on precise mapping to validate conduction block and identify gaps. Broader awareness, screening, and referral pathways for atrial fibrillation also keep procedural volumes elevated across major care settings.
By End User Insights
Hospitals and Electrophysiology Labs represent the core demand base because complex arrhythmia mapping requires specialized infrastructure, trained EP staff, and access to procedure suites optimized for catheter-based interventions. High-volume centers also concentrate repeat procedures, driving upgrades in software modules, mapping catheters, and supportive accessories. Ambulatory Surgical Centers gain relevance where patient selection, reimbursement alignment, and standardized protocols support outpatient EP procedures. Research and Academic Institutes influence adoption through training, clinical studies, and evaluation of next-generation mapping features.
Cardiac Mapping Market Drivers
Rising Electrophysiology Procedure Volumes for Complex Arrhythmias
Cardiac mapping market growth is supported by increasing ablation procedures for atrial fibrillation and other arrhythmias that require accurate localization of electrical activity. Higher caseloads expand utilization of mapping systems across procedure suites and increase demand for consumables linked to mapping workflows. Clinical emphasis on durable outcomes elevates the value of refined substrate characterization and real-time validation. Procedure growth also encourages hospitals to expand EP capacity and invest in mapping-enabled cath lab upgrades.
- For instance, Biosense Webster’s OCTARAY Mapping Catheter with TRUEref Technology uses 48 mapping electrodes arranged across 8 splines, a configuration the company says improves lesion-set gap identification and supports faster, more detailed electroanatomic mapping in complex ablation procedures.
Technology Upgrades in 3D Visualization and Mapping Automation
Cardiac mapping market adoption benefits from continuous platform upgrades that reduce mapping time and improve interpretability of complex signals. Advanced 3D reconstruction, high-density acquisition, and automated annotation features support faster decision-making during procedures. EP teams value software improvements that standardize workflows across operators and reduce variability. Automation also improves throughput in high-volume centers, strengthening the business case for system replacement and module expansion.
- For instance, Abbott states that its Advisor HD Grid X Mapping Catheter delivered 30% more accurate unedited models, 48% faster mapping, and 54% less ectopy than Octaray in a pre-clinical head-to-head comparison, underscoring how next-generation mapping tools can improve workflow efficiency and signal reliability.
Expansion of Integrated Mapping and Ablation Ecosystems
Cardiac mapping market demand increases as providers prefer integrated ecosystems that combine mapping, navigation support, and ablation compatibility to reduce workflow friction. Interoperability with catheters, accessories, and procedural guidance tools supports standardized protocols and training efficiency. Integrated ecosystems also improve operational planning by aligning capital purchases with recurring consumables usage. Vendor support models and service coverage further influence multi-year procurement decisions in large hospital networks.
Growing Investment in EP Lab Infrastructure Across Regions
Cardiac mapping market momentum is reinforced by expanding EP lab footprints as hospitals modernize cardiovascular care pathways. Investments in advanced cath lab capabilities and specialist staffing increase readiness for complex mapping procedures. Healthcare systems also prioritize earlier intervention and improved procedural success, supporting adoption of sophisticated mapping solutions. Regional expansion of EP capacity creates additional demand for installation, training, and ongoing software and consumable upgrades.
Cardiac Mapping Market Challenges
Cardiac mapping market expansion faces constraints from high capital costs and procurement cycles that can delay system upgrades, especially for smaller hospitals and emerging-market providers. Budget prioritization often competes with other cardiovascular investments, leading to extended replacement timelines. Advanced mapping procedures also require skilled electrophysiologists and trained staff, creating operational bottlenecks where specialist availability is limited. Workflow variability across centers can slow adoption of newer modules without structured training pathways.
- For instance, Boston Scientific states that its RHYTHMIA HDx platform has no point limitation, while the INTELLAMAP ORION mapping catheter uses 64 electrodes and has been shown to generate 5x higher point densities than competing automated mapping systems.
Cardiac mapping market adoption is also challenged by integration complexity across multi-vendor cath lab environments, where compatibility and interoperability influence purchasing decisions. Hospitals frequently evaluate mapping platforms alongside ablation technologies and imaging workflows, increasing evaluation time and administrative approvals. Data management and cybersecurity expectations add additional requirements for networked software and analytics features. Reimbursement variability for advanced EP procedures can further influence expansion of mapping utilization across care settings.
Cardiac Mapping Market Trends and Opportunities
Cardiac mapping market opportunity is increasing through AI-assisted signal interpretation and workflow automation that improves speed, consistency, and operator confidence. Advanced analytics that support substrate mapping and lesion validation can strengthen clinical outcomes and reduce repeat procedures. Adoption of high-density mapping strategies also supports differentiated value propositions for complex cases. Vendors that deliver scalable upgrades and modular software pathways can capture repeat revenue from installed bases.
- For instance, Volta Medical reported in the TAILORED-AF randomized trial that its AI-guided ablation strategy delivered 88% freedom from atrial fibrillation at 12 months versus 70% with pulmonary vein isolation alone, with the study run across 26 centers by 51 electrophysiologists in 5 countries.
Cardiac mapping market growth potential also expands through broader access to minimally invasive electrophysiology in outpatient and regional centers, supported by standardization and training programs. Expansion of EP labs in Asia Pacific and select European markets supports new installations and service contracts. Demand for integrated ecosystems that align mapping with evolving ablation modalities encourages portfolio bundling strategies. Emerging use of cloud-enabled collaboration and structured data sharing can support longitudinal patient management and network-level care pathways.
Regional Insights
North America
North America accounted for 36.9% of Cardiac mapping market revenue in 2025, supported by high electrophysiology procedure volumes, strong adoption of advanced mapping workflows, and extensive availability of specialized EP labs. The region benefits from mature reimbursement pathways in many care settings and broad access to high-acuity hospital infrastructure. Innovation uptake is reinforced by frequent technology upgrades, established vendor service networks, and clinician training ecosystems across major cardiovascular centers.
Europe
Europe represented 30.6% of Cardiac mapping market revenue in 2025, driven by strong hospital-based electrophysiology capability and steady adoption of advanced mapping platforms for complex arrhythmias. Regional demand is supported by structured care pathways, expansion of minimally invasive cardiac interventions, and continued modernization of cath labs. Large tertiary hospitals and specialized centers contribute significantly through high caseloads and preference for advanced visualization and workflow efficiency.
Asia Pacific
Asia Pacific captured 26.8% of Cardiac mapping market revenue in 2025, supported by accelerating investments in hospital infrastructure and rising access to electrophysiology procedures. Large patient populations and increasing cardiovascular disease burden expand procedural demand, encouraging new EP lab creation and upgrades. Adoption is further reinforced by expanding training capacity and growing presence of regional and global suppliers supporting mapping systems, catheters, and software modules.
Latin America
Latin America held 3.9% of Cardiac mapping market revenue in 2025, reflecting developing EP capacity concentrated in major urban hospitals and private healthcare networks. Growth is supported by gradual expansion of specialized cardiac care and increasing availability of trained electrophysiology teams in key markets. Procurement often favors phased upgrades and selective installations due to capital constraints, while vendor training and service support remains a key adoption lever.
Middle East & Africa
Middle East & Africa accounted for 1.8% of Cardiac mapping market revenue in 2025, with demand concentrated in advanced hospitals and flagship cardiovascular centers. Adoption is influenced by specialist availability, variable reimbursement structures, and uneven distribution of EP lab infrastructure. Growth opportunities remain linked to expansion of tertiary care capacity, structured training programs, and investments in catheter-based cardiac intervention capabilities.
Competitive Landscape
Cardiac mapping market competition is shaped by integrated technology ecosystems, where suppliers differentiate through mapping accuracy, signal fidelity, workflow efficiency, and compatibility with broader electrophysiology suites. Competitive strategies emphasize software upgrades, high-density mapping capabilities, and procedural standardization tools that reduce operator variability. Service coverage, training programs, and long-term consumables pull-through also influence purchasing decisions in large hospital networks. Portfolio breadth across mapping systems, catheters, and complementary cardiovascular platforms strengthens supplier positioning.
Biosense Webster (Johnson & Johnson MedTech) maintains a strong presence through broad electrophysiology workflow coverage and continued investments in mapping system evolution. Product development emphasis typically targets improved mapping efficiency, high-resolution visualization, and structured procedural workflows that support complex arrhythmia cases. Commercial strategy often leverages installed-base upgrades, clinician education, and catheter ecosystem alignment to sustain repeat demand. Ongoing platform enhancements reinforce relevance in high-volume electrophysiology centers.
The industry research and growth report includes detailed analyses of the competitive landscape of the market and information about key companies, including:
- Biosense Webster (Johnson & Johnson MedTech)
- Abbott
- Boston Scientific Corporation
- Medtronic plc
- MicroPort Scientific Corporation
- Koninklijke Philips N.V.
- Siemens Healthineers
- Acutus Medical
- Stereotaxis, Inc.
- BIOTRONIK SE & Co. KG
- Lepu Medical
Qualitative and quantitative analysis of companies has been conducted to help clients understand the wider business environment as well as the strengths and weaknesses of key industry players. Data is qualitatively analyzed to categorize companies as pure play, category-focused, industry-focused, and diversified; it is quantitatively analyzed to categorize companies as dominant, leading, strong, tentative, and weak.
Recent Developments
- In January 2026, Corify Care announced its proprietary Global Volumetric Mapping technology, which it said is the first system capable of mapping all four heart chambers at the same time and giving physicians a real-time view of arrhythmias.
- In July 2025, Johnson & Johnson MedTech launched the VARIPULSE Platform across Asia-Pacific for atrial fibrillation treatment. The company said the platform is fully integrated with the CARTO 3 electroanatomical mapping system, strengthening its position in cardiac mapping-guided ablation workflows.
- In July 2025, EnChannel Medical announced a definitive agreement to acquire Acutus Medical’s AcQMap High Resolution Imaging and Mapping platform assets. The acquisition included intellectual property, clinical and regulatory documentation, selected AcQMap systems, and related catheter devices, expanding EnChannel’s capabilities in non-contact cardiac mapping.
- In April 2025, Boston Scientific launched the next generation of cardiac mapping for its FARAPULSE pulsed field ablation platform. The launch combined the FARAWAVE NAV ablation catheter and FARAVIEW software with the OPAL HDx mapping system to improve visualization during pulsed field ablation procedures.
Report Scope
| Report Attribute | Details |
| Market size value in 2025 | USD 3764 million |
| Revenue forecast in 2032 | USD 7864.22 million |
| Growth rate (CAGR) | 11.1% (2025–2032) |
| Base year | 2025 |
| Forecast period | 2026-2032 |
| Quantitative units | USD million |
| Segments covered | By Product Type Outlook; By Indication Outlook; By End User Outlook |
| Regional scope | North America, Europe, Asia Pacific, Latin America, Middle East & Africa |
| Key companies profiled | Biosense Webster (Johnson & Johnson MedTech), Abbott, Boston Scientific Corporation, Medtronic plc, MicroPort Scientific Corporation, Koninklijke Philips N.V., Siemens Healthineers, Acutus Medical, Stereotaxis, Inc., BIOTRONIK SE & Co. KG, Lepu Medical |
| No. of Pages | 328 |
Segmentation
By Product Type
- Contact Cardiac Mapping Systems
- Non-Contact Cardiac Mapping Systems
- Cardiac Mapping Catheters
- Software & Algorithms
- Accessories & Consumables
By Indication
- Atrial Fibrillation
- Atrial Flutter
- AV Nodal Reentrant Tachycardia (AVNRT)
- Ventricular Tachycardia
- Supraventricular Tachycardia
- Other Arrhythmias
By End User
- Hospitals
- Electrophysiology Labs
- Ambulatory Surgical Centers
- Research & Academic Institutes
- Others
By Region
- North America
- U.S.
- Canada
- Mexico
- Europe
- Germany
- France
- U.K.
- Italy
- Spain
- Rest of Europe
- Asia Pacific
- China
- Japan
- India
- South Korea
- South-east Asia
- Rest of Asia Pacific
- Latin America
- Brazil
- Argentina
- Rest of Latin America
- Middle East & Africa
- GCC Countries
- South Africa
- Rest of the Middle East and Africa
Request a Free Sample
Fill in your details and we'll send you a free sample report.
- Sample data tables & charts
- Research methodology
Need a Custom Version of This Report?
Tailor the scope, geography, or segments to your exact requirements.
- Custom geography or segment scope
- Direct access to our analyst team
Frequently Asked Questions
What is the Cardiac mapping market size in 2025 and forecast for 2032?
What is the CAGR for the Cardiac mapping market during 2025–2032?
What is the largest segment in the Cardiac mapping market?
What factors are driving Cardiac mapping market growth?
Who are the leading companies in the Cardiac mapping market?
Which region leads the Cardiac mapping market in 2025?
Table of Content
Chapter 1. Report Introduction
- 1.1 Report Description & Purpose
- 1.1.1 Report Title & Market Definition
- 1.1.2 Unique Selling Propositions (USP) & Key Differentiators
- 1.1.3 Value Proposition for Stakeholders
- 1.2 Research Objectives
- 1.2.1 Market Sizing Objectives (Volume & Revenue)
- 1.2.2 Segmentation Objectives
- 1.2.3 Competitive Intelligence Objectives
- 1.2.4 Forecast & Scenario Objectives
- 1.3 Report Scope
- 1.3.1 Cardiac Mapping Scope – Types & Subtypes Covered
- 1.3.2 Geographic Scope – Regions & Countries Covered
- 1.3.3 Historical Period, Base Year & Forecast Period (2025; forecast to 2032)
- 1.3.4 Inclusions & Exclusions
- 1.4 HS Code & Classification Framework
- 1.5 Currency, Units & Pricing Basis
- 1.6 Target Stakeholders
- 1.7 Limitations & Assumptions
Chapter 2. Executive Summary
- 2.1 Global Cardiac Mapping Market Snapshot
- 2.1.1 Market Size – Historical (2025) & Forecast (2025-2032) (2025: USD 3,764 million → 2032: USD 7,864.22 million)
- 2.1.2 Volume & Revenue – Global Totals
- 2.1.3 Key Market Highlights – Top Five Facts
- 2.2 Cardiac Mapping Market Segmentation Snapshot
- 2.2.1 Market Split by Region – 2025 vs. 2032
- 2.3 Competitive Snapshot
- 2.3.1 Top 10 Players by Revenue Share – 2025
- 2.3.2 Top 10 Players by Volume Share – 2025
- 2.3.3 Recent Strategic Developments (18-Month Summary)
- 2.4 Key Investment Highlights & Strategic Conclusions
Chapter 3. Cardiac Mapping Market Dynamics & Industry Analysis
- 3.1 Market Overview & Context
- 3.1.1 Cardiac Mapping Market Position in the Broader Automotive Value Chain
- 3.1.2 OEM vs. Replacement Market Dynamics
- 3.1.3 Market Maturity & Development Stage by Region
- 3.2 Cardiac Mapping Market Drivers
- 3.3 Cardiac Mapping Market Restraints & Challenges
- 3.4 Cardiac Mapping Market Opportunities
- 3.5 Porter's Five Forces Analysis
- 3.5.1 Threat of New Entrants
- 3.5.2 Bargaining Power of Suppliers
- 3.5.3 Bargaining Power of Buyers
- 3.5.4 Threat of Substitutes
- 3.5.5 Competitive Rivalry – Intensity Assessment
- 3.6 Cardiac Mapping Value Chain Analysis
- 3.6.1 Upstream – Raw Material/Input Suppliers
- 3.6.1.1 Raw Material/Input 1
- 3.6.1.2 Raw Material/Input 2
- 3.6.1.3 Raw Material/Input 3
- 3.6.2 Midstream – Production/Manufacturing/Service Delivery
- 3.6.2.1 Production/Process Overview
- 3.6.2.2 Key Facility Locations & Capacity by Manufacturer
- 3.6.3 Downstream – Distribution & End Consumer
- 3.6.3.1 Primary Channel – B2B/OEM
- 3.6.3.2 Secondary Channels – Dealer, Retail, Online, Direct
- 3.6.4 Value Chain Profitability Analysis
- 3.6.1 Upstream – Raw Material/Input Suppliers
- 3.7 PESTEL Analysis
- 3.7.1 Political Factors
- 3.7.2 Economic Factors
- 3.7.3 Social Factors
- 3.7.4 Technological Factors
- 3.7.5 Environmental Factors
- 3.7.6 Legal Factors
- 3.8 Cardiac Mapping Supply Chain Analysis
- 3.8.1 Raw Material/Input Supply Risk Assessment
- 3.8.2 Manufacturing Concentration Risk (Geographic Exposure)
- 3.8.3 Trade Disruption Impact Analysis
- 3.9 Regulatory & Policy Landscape
Note: The regulatory and policy landscape section covers regulations based on their applicability to the market, Cardiac Mapping category, geography, and scope of the study. Only regulatory frameworks with a material impact on operations, compliance, trade, sustainability, or market access are analyzed in detail.
Chapter 4. Key Investment Pockets & Opportunity Analysis
- 4.1 Cardiac Mapping Market Attractiveness Analysis
- 4.1.1 By Region – Investment Attractiveness Matrix (Volume × CAGR)
- 4.2 Absolute Revenue Growth Opportunity
- 4.2.1 By Region – Absolute USD Growth Through 2032
- 4.3 Incremental Volume Opportunity
- 4.3.1 By Region – Incremental Volume Through 2032
- 4.3.2 Segment – Incremental Volume
- 4.4 Emerging Submarket Opportunity Deep Dive (Subject to Applicability)
- 4.5 Emerging Market Opportunity Scorecards
- 4.5.1 United States
- 4.5.2 Europe
- 4.5.3 Asia
- 4.5.4 Middle East & Africa
Note: Emerging Market Opportunity Scorecards will be included based on relevance and strategic importance. Regions listed are indicative and may vary depending on data availability and market dynamics.
Chapter 5. Cardiac Mapping Import-Export Analysis & Trade Flows
- 5.1 Global Trade Overview
- 5.1.1 Global Export Value by Country (2025)
- 5.1.2 Global Export Volume by Country (2025)
- 5.1.3 Global Import Value by Country (2025)
- 5.1.4 Global Import Volume by Country (2025)
- 5.1.5 Net Trade Balance by Country (2025)
- 5.2 Export Analysis – Segment
- 5.2.1 Type 1 (HS Code)
- 5.2.2 Type 2 (HS Code)
- 5.2.3 Type 3 (HS Code)
- 5.2.4 Type 4 (HS Code)
- 5.2.5 Type 5 (HS Code)
- 5.3 Import Analysis – Segment
- 5.3.1 Type 1 (HS Code)
- 5.3.2 Type 2 (HS Code)
- 5.3.3 Type 3 (HS Code)
- 5.3.4 Type 4 (HS Code)
- 5.3.5 Type 5 (HS Code)
- 5.4 Average Unit Trade Prices
- 5.4.1 Average Export Price – Segment & Country
- 5.4.2 Average Import Price – Segment & Source Country
- 5.4.3 Price Trends (2025)
- 5.5 Key Trade Route Analysis
- 5.5.1 Trade Route 1
- 5.5.2 Trade Route 2
- 5.5.3 Trade Route 3
- 5.5.4 Trade Route 4
- 5.5.5 Trade Route 5
- 5.6 Trade Policy Impact Assessment
- 5.6.1 US Anti-Dumping & Section 301 Tariffs
- 5.6.2 EU Customs Union Impact
- 5.6.3 Major Free Trade Agreements
- 5.6.4 USMCA Rules of Origin
Note: Trade policy analysis will be included only where relevant to the Cardiac Mapping market.
Chapter 6. Competitive Landscape & Company Benchmarking
- 6.1 Cardiac Mapping Market Concentration & Structure
- 6.1.1 Herfindahl-Hirschman Index (HHI) – vs. 2025
- 6.1.2 Tier 1, Tier 2 & Tier 3 Market Structure
- 6.1.3 Global, Regional & Local Player Dynamics
- 6.2 Cardiac Mapping Market Share Analysis – 2025
- 6.2.1 Global Revenue Share by Company
- 6.2.2 Global Volume Share by Company
- 6.2.3 Regional Revenue Share
- 6.2.4 Market Share Evolution ( vs. 2025)
- 6.2.5 OEM Segment Share by Company
- 6.2.6 Replacement Segment Share by Company
- 6.3 Production/Delivery Capacity & Facility Analysis
- 6.3.1 Global Installed Capacity
- 6.3.2 Capacity Utilization Rates
- 6.3.3 Production/Output Volume
- 6.3.4 Facility Locations & Capacity Map
- 6.3.5 Planned Capacity Additions
- 6.4 Cardiac Mapping Competitive Benchmarking Matrix
- 6.4.1 Revenue, Volume, CAGR & Profitability Comparison
- 6.4.2 Channel Revenue Mix
- 6.4.3 Geographic Revenue Exposure
- 6.4.4 R&D Intensity
- 6.4.5 Sustainability Maturity
- 6.5 Strategic Developments in Cardiac Mapping (Last 24 Months)
- 6.5.1 Mergers, Acquisitions & Divestments
- 6.5.2 New Cardiac Mapping Launches
- 6.5.3 Facility Expansions
- 6.5.4 Strategic Alliances, Joint Ventures & Partnerships
- 6.5.5 Distribution Expansion & Market Entry
- 6.5.6 Sustainability & ESG Initiatives
- 6.6 Competitive Strategy Mapping
- 6.6.1 Leader, Challenger, Follower & Niche Classification
- 6.6.2 Pricing Strategy Comparison
- 6.6.3 Channel Strategy Matrix
Note: Strategic developments are included based on their materiality and the availability of reliable information.
Chapter 7. Global Cardiac Mapping Market – By Distribution Channel
- 7.1 Segment Overview
- 7.1.1 Volume & Revenue Split by Channel (2025 & 2032)
- 7.1.2 Channel Mix Evolution (2025-2032)
Chapter 8. Regional Market Analysis – Global Overview
- 8.1 Global Regional Overview
- 8.1.1 Regional Volume Share
- 8.1.2 Regional Revenue Share
- 8.1.3 Regional Volume by Region
- 8.1.4 Regional Revenue by Region
- 8.1.5 Regional Forecast Through 2032
- 8.2 Cross-Regional Segment Analysis
- 8.2.1 By Distribution Channel
- 8.2.2 By Brand/Price Tier
Chapter 9. North America Cardiac Mapping Market
- 9.1 United States
- 9.2 Canada
- 9.3 Mexico
Chapter 10. Europe Cardiac Mapping Market
- 10.1 Germany
- 10.2 France
- 10.3 Italy
- 10.4 United Kingdom
- 10.5 Spain
- 10.6 Poland
- 10.7 Russia
- 10.8 Netherlands
- 10.9 Belgium
- 10.10 Sweden
- 10.11 Denmark
- 10.12 Norway
- 10.13 Rest of Europe
Chapter 11. Asia Pacific Cardiac Mapping Market
- 11.1 China
- 11.2 India
- 11.3 Japan
- 11.4 South Korea
- 11.5 Thailand
- 11.6 Indonesia
- 11.7 Vietnam
- 11.8 Malaysia
- 11.9 Australia
- 11.10 Rest of Asia Pacific
Chapter 12. Latin America Cardiac Mapping Market
- 12.1 Brazil
- 12.2 Argentina
- 12.3 Colombia
- 12.4 Chile
- 12.5 Rest of Latin America
Chapter 13. Middle East Cardiac Mapping Market
- 13.1 Saudi Arabia
- 13.2 United Arab Emirates
- 13.3 Turkey
- 13.4 Israel
- 13.5 Iran
- 13.6 Rest of the Middle East
Chapter 14. Africa Cardiac Mapping Market
- 14.1 South Africa
- 14.2 Egypt
- 14.3 Nigeria
- 14.4 Morocco
- 14.5 Rest of Africa
Chapter 15. Cardiac Mapping Company Profiles
- 15.1 [Company 01]
- 15.1.1 Company Overview
- 15.1.2 Key Management Personnel
- 15.1.3 Products & Services Portfolio
- 15.1.4 Financial Performance
- 15.1.5 Key Market Focus & Geographic Presence
- 15.1.6 Recent Developments & Strategic Initiatives
Note: The company profile list is preliminary and may change based on research findings, market developments, data availability, and client requirements.
Chapter 16. Appendices
- Appendix A – List of Abbreviations & Acronyms
- Appendix B – Industry Classification Code Reference – Full Series
- Appendix C – Production & Capacity Data Tables
- Appendix D – End-Use & Demand Base Tables
- Appendix E – Consumption & Replacement Rate Assumptions
- Appendix F – ASP Reference Tables
- Appendix G – Manufacturing & Facility Database
- Appendix H – Import-Export Data Tables
- Appendix I – Regulatory Summary Tables
- Appendix J – Primary Research Participant List (Anonymized)
- Appendix K – Primary Research Questionnaire Framework
- Appendix L – Data Sources & Bibliography
- Appendix M – Market Size Divergence & Source Comparison
Chapter 17. Research Methodology
- 17.1 Research Framework & Philosophy
- 17.2 Secondary Research – Sources, Hierarchy & Data Extraction
- 17.3 Data Modeling – Bottom-Up & Top-Down Market Sizing
- 17.4 Primary Research – Stakeholder Framework, LOI & Sample Sizes
- 17.5 Forecast Methodology – Regression, Scenario & Sensitivity Analysis
- 17.6 Quality Control – Four-Layer Validation Framework
- 17.7 Limitations & Standard Assumptions
- 17.8 Disclaimer
