
Cell Proliferation Kit Market Overview:
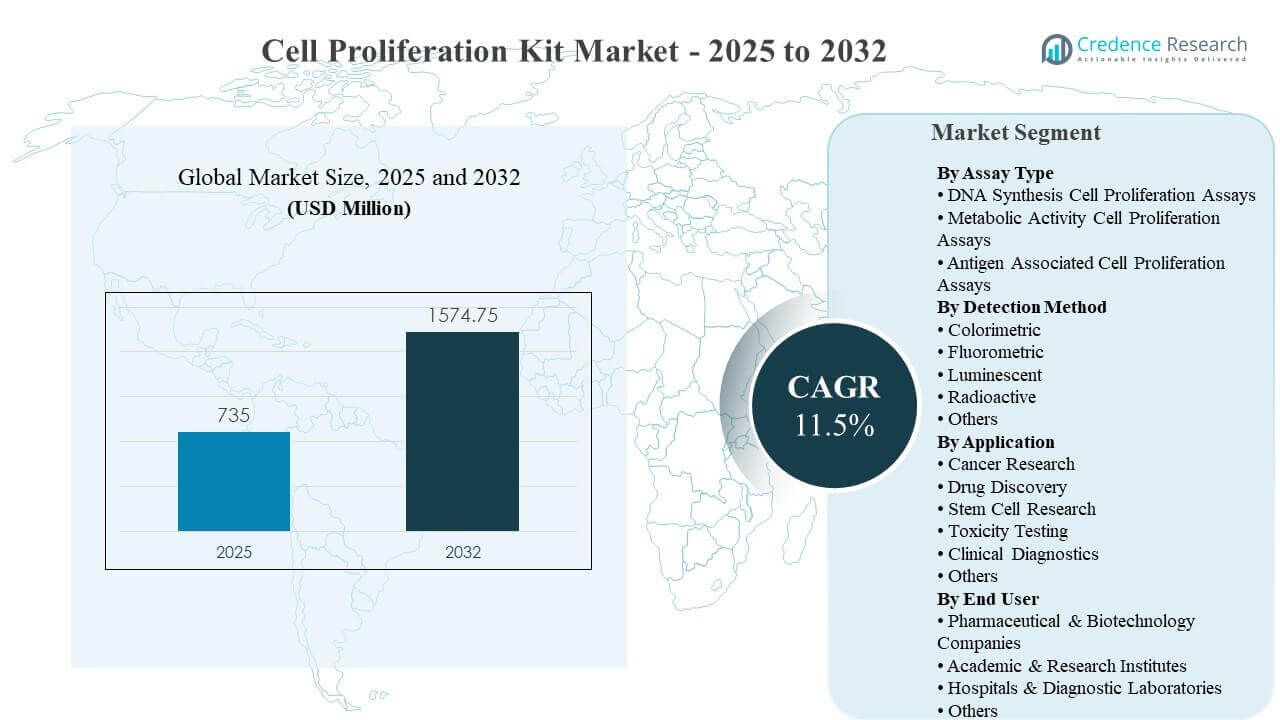
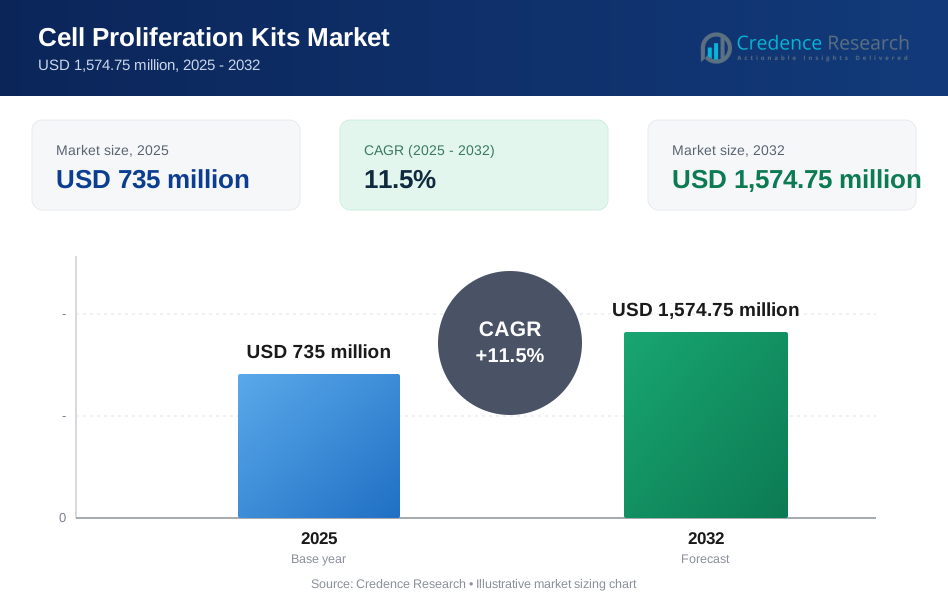
The global Cell Proliferation Kit Market size was estimated at USD 735 million in 2025 and is expected to reach USD 1,574.75 million by 2032, growing at a CAGR of 11.5% from 2025 to 2032. Demand expansion is strongly supported by rising cell-based experimentation across oncology programs and high-throughput screening workflows where proliferation readouts remain a primary endpoint for hit triage and lead optimization. Growth momentum is also reinforced by increasing adoption of standardized microplate formats across research and industrial laboratories, improving throughput and repeatability across multicenter projects.
| REPORT ATTRIBUTE | DETAILS |
|---|---|
| Historical Period | 2020-2024 |
| Base Year | 2025 |
| Forecast Period | 2026-2032 |
| Cell Proliferation Kit Market Size 2025 | USD 735 million |
| Cell Proliferation Kit Market, CAGR | 11.5% |
| Cell Proliferation Kit Market Size 2032 | USD 1,574.75 million |
Key Market Trends & Insights
- North America accounted for 39.6% share in 2025, supported by strong pharma R&D intensity and mature screening infrastructure.
- Asia Pacific captured 28.7% share in 2025, reflecting accelerating capacity additions in life-science research and bioprocess development hubs.
- Drug Discovery represented the leading application with 36.9% share in 2025, driven by routine proliferation and viability endpoints in primary and secondary screening.
- Pharmaceutical & Biotechnology Companies led end-user adoption with 47.8% share in 2025, supported by automation-ready assay formats and standardized workflows.
- Metabolic Activity Cell Proliferation Assays held the largest assay-type share at 41.6% in 2025, reflecting broad usability in routine viability/proliferation testing.
Segment Analysis
Cell Proliferation Kit Market demand is anchored in routine quantification needs across discovery, translational research, and quality-controlled cell workflows where proliferation endpoints guide decision-making. Preference trends favor assay formats that fit existing plate-reader ecosystems and automation, especially across multiwell formats that improve throughput and comparability. Assay selection also reflects cell type, expected signal range, and interference risks from test compounds, culture media components, and metabolic modifiers that can bias results.
End-user purchasing behavior is influenced by reproducibility, validated protocols, sensitivity, and compatibility with common instruments used across screening and research labs. Portfolio breadth remains important because procurement teams often standardize around a small number of vendors for cross-lab harmonization. Workflow fit across cancer biology studies, toxicity profiling, and stem cell expansion programs continues to shape kit choice, with growing emphasis on robust controls and streamlined data pipelines.
By Assay Type Insights
Metabolic Activity Cell Proliferation Assays accounted for the largest share of 41.6% in 2025. Leadership is supported by rapid workflows that align with routine viability and proliferation assessment in discovery labs. Broad compatibility with standard microplate readers supports scale across multiwell formats and automated pipelines. High adoption is also reinforced by streamlined protocol steps that help reduce hands-on time across large experimental sets.
By Detection Method Insights
Colorimetric accounted for the largest share of 34.6% in 2025. Widespread use reflects cost-effective testing and strong fit with common plate readers already deployed across laboratories. Colorimetric formats also support high sample volumes without specialized imaging requirements. Standardized, well-understood readouts help laboratory teams maintain operational consistency across routine screening and validation studies.
By Application Insights
Drug Discovery accounted for the largest share of 36.9% in 2025. Leadership is driven by frequent use of proliferation endpoints in hit identification, mechanism studies, and compound ranking. High-throughput compatibility supports repeat testing across dose-response curves and time-course experiments. The Cell Proliferation Kit Market continues to benefit from expansion of targeted therapy pipelines that require robust cell response characterization.
By End User Insights
Pharmaceutical & Biotechnology Companies accounted for the largest share of 47.8% in 2025. Adoption strength reflects standardized screening workflows, automation, and routine assay repetition across programs. Procurement preferences also favor validated kits with consistent performance across multiple cell lines and assay conditions. The Cell Proliferation Kit Market gains additional support from process discipline and quality requirements in regulated development environments.
Cell Proliferation Kit Market Drivers
Expanding Oncology Research Workloads
Cell Proliferation Kit Market growth is supported by increasing oncology research intensity across academic and industrial settings. Proliferation endpoints remain central to tumor biology studies, pathway validation, and therapy response characterization. Cancer programs frequently require rapid, repeatable measurements across multiple cell models and experimental conditions. Broader adoption of standardized assay workflows improves comparability across internal teams and external collaborators, strengthening purchase continuity for validated kits.
Growth of High-Throughput Screening and Automation
Cell Proliferation Kit Market demand benefits from growth in automation-ready screening platforms that rely on plate-based assays. Screening pipelines require fast turnaround, scalable formats, and robust signal capture across large compound libraries. Automated liquid handling and standardized microplate workflows increase throughput and reduce variability across runs. Laboratories also prioritize kits that integrate cleanly with existing readers and analysis software to support faster decision cycles.
Rising Use in Toxicity Testing and Safety Profiling
Cell Proliferation Kit Market expansion is reinforced by increasing emphasis on early toxicity and safety profiling in drug development workflows. Proliferation and viability endpoints help teams filter cytotoxic compounds and refine dosing windows. Preclinical programs also require repeat testing across different cell types and exposure durations to assess risk profiles. Reliable proliferation kits support consistent workflows that are practical for routine, high-volume evaluation.
- For instance, Agilent’s xCELLigence RTCA SP cytotoxicity workflow uses a single 96-well electronic microplate, seeds A549 cells at 5,000 cells per 100 µL, and monitors response every hour for 72 hours after compound addition, enabling continuous toxicity profiling instead of relying only on a single endpoint measurement.
Wider Adoption in Stem Cell Research and Cell Workflow QC
Cell Proliferation Kit Market growth is strengthened by increasing stem cell research activity and broader adoption of cell-based workflows requiring monitoring of growth and expansion. Proliferation assays support optimization of culture conditions, passaging schedules, and differentiation protocols. Quality control needs also increase as laboratories standardize cell handling across projects and sites. Demand is supported by requirements for reproducible readouts that align with controlled, repeat testing practices.
- For instance, STEMCELL Technologies offers a CD34+ expansion assay that evaluates test compounds in a 96-well format over 10 days and measures both fold expansion and the percentage of CD34+ cells, with the cited results reported as the mean of three donor cell lots, supporting standardized stem cell monitoring across repeated workflows.
Cell Proliferation Kit Market Challenges
Cell Proliferation Kit Market adoption faces challenges from assay interference risks that can distort results, especially when test compounds alter metabolism or produce optical artifacts. Variability across cell lines, culture conditions, and signal timing can affect comparability across studies. Laboratory teams must also manage trade-offs between sensitivity, cost, and throughput, which can complicate standardization. Additional complexity arises when workflows require cross-platform comparability across different readers and analysis tools.
Cell Proliferation Kit Market competition also creates operational challenges for buyers due to overlapping product claims and varying protocol requirements across vendors. Reproducibility expectations increase scrutiny on lot-to-lot consistency and control design. Regulatory and quality frameworks in certain clinical-adjacent environments add documentation burdens. These factors elevate evaluation time and can slow purchasing decisions for new assay formats.
- For instance, Thermo Fisher reports that its alamarBlue HS reagent provides a greater than 10-fold assay signal window versus the non-HS assay, while the standard alamarBlue workflow requires 1-4 hours of incubation with signal stability for 7 hours, and the company separately positions PrestoBlue for a typical 10-minute incubation, illustrating how vendor-specific performance claims and protocol differences can extend assay qualification and procurement review.
Cell Proliferation Kit Market Trends and Opportunities
Cell Proliferation Kit Market opportunity is supported by increasing preference for assays that reduce protocol complexity and improve reproducibility across large experimental sets. Demand growth favors formats compatible with automation and standardized data pipelines that simplify analysis. Expanded use of multiplexing and combined readouts increases interest in kits that fit multi-parameter workflows. Vendors that improve robustness against compound interference can gain traction across screening-heavy environments.
- For instance, Promega’s CellTiter-Glo 2.0 Cell Viability Assay uses a ready-to-use single reagent, produces results in 10 minutes, and maintains more than 85% light output after 2 months at 4°C or 7 days at room temperature, which directly supports simpler setup and more consistent handling across large plate batches.
Cell Proliferation Kit Market trend momentum also reflects broader movement toward standardized workflows across multi-site research programs and outsourced testing. Partnerships between kit suppliers and instrument ecosystems can strengthen adoption through validated performance across common platforms. Growth opportunities also emerge from expanding research capacity across Asia Pacific and continued modernization of laboratory infrastructure. Application breadth across oncology, toxicity, and cell workflow QC supports sustained demand across multiple end-user categories.
Regional Insights
North America
North America led the Cell Proliferation Kit Market with 39.6% share in 2025. Regional demand is supported by strong pharmaceutical R&D intensity and mature screening infrastructure across industry and academic centers. High adoption of automation and standardized microplate workflows supports recurring consumption of routine proliferation kits. Procurement preferences also emphasize validated protocols and consistent performance across high-volume testing environments.
Europe
Europe accounted for 24.1% share in 2025. Regional demand is supported by established biomedical research networks, oncology programs, and translational initiatives requiring consistent proliferation measurement. Laboratory standardization across collaborative research supports use of validated kits that improve comparability. Growth is reinforced by quality expectations and disciplined assay governance across many institutional settings.
Asia Pacific
Asia Pacific represented 28.7% share in 2025. Regional growth is supported by expanding research capacity, increasing drug discovery activity, and infrastructure investments that improve access to modern assay tools. Large and growing academic and biotech ecosystems increase recurring demand for cost-effective, scalable assay formats. Strong uptake of standardized microplate workflows also supports broader adoption across discovery and toxicity testing use cases.
Latin America
Latin America held 4.6% share in 2025. Market development is supported by gradual laboratory modernization and increasing participation in clinical and translational research programs. Demand concentration is typically strongest in major research hubs and private diagnostic or contract research settings. Opportunities are tied to improved procurement access, training, and workflow standardization.
Middle East & Africa
Middle East & Africa accounted for 3.0% share in 2025. Demand is supported by selective investments in research infrastructure and growing interest in advanced diagnostics and biomedical research capabilities. Adoption is often centered in leading academic institutions and specialized healthcare hubs. Market expansion depends on broader availability of laboratory platforms and reliable supply chains for consumables.
Competitive Landscape
Cell Proliferation Kit Market competition is shaped by breadth of assay chemistries, protocol reliability, instrument compatibility, and the ability to support high-throughput workflows. Vendors differentiate through validated performance across multiple cell types, robustness against assay interference, and workflow convenience across microplate formats. Portfolio depth across colorimetric, fluorometric, and luminescent readouts supports cross-application coverage, while service and technical support strengthens customer retention.
Thermo Fisher Scientific Inc. maintains competitive strength through broad assay portfolio coverage, workflow alignment with widely used laboratory platforms, and strong distribution reach across research and industrial customers. Thermo Fisher Scientific Inc. positioning is reinforced by an integrated offering approach that supports routine proliferation workflows alongside complementary reagents and instruments. Thermo Fisher Scientific Inc. customer adoption is supported by standardization needs across multi-site programs that value consistent protocols and reliable supply continuity.
The industry research and growth report includes detailed analyses of the competitive landscape of the market and information about key companies, including:
- Thermo Fisher Scientific Inc.
- Merck KGaA (Sigma-Aldrich)
- Bio-Rad Laboratories, Inc.
- Becton, Dickinson and Company (BD)
- Agilent Technologies Inc.
- PerkinElmer Inc.
- F. Hoffmann-La Roche AG
- GE Healthcare
- Biological Industries
- Promega Corporation
- Abcam plc
- Biotium, Inc.
- Cell Signaling Technology
- Mindray Medical International
Qualitative and quantitative analysis of companies has been conducted to help clients understand the wider business environment as well as the strengths and weaknesses of key industry players. Data is qualitatively analyzed to categorize companies as pure play, category-focused, industry-focused, and diversified; it is quantitatively analyzed to categorize companies as dominant, leading, strong, tentative, and weak.
Recent Developments
- In May 2025, Amerigo Scientific launched an expanded line of cell proliferation and viability assay kits aimed at supporting research in drug discovery, cancer studies, immunology, and regenerative medicine. In the announcement, the company said the kits were designed to deliver sensitive and reliable measurement of cell growth and health, with user-friendly workflows and compatibility with multiple analytical platforms.
- In October 2025, MilliporeSigma partnered with Promega to co-develop new technologies for drug screening and discovery by combining MilliporeSigma’s organoid expertise with Promega’s assay and reporter technologies. In this collaboration, the two companies said they plan to develop assays that can track cellular activity in real time within three-dimensional cell cultures, which are more physiologically relevant than traditional 2D models.
- In December 2024, Merck KGaA, Darmstadt, Germany acquired HUB Organoids B.V., a company focused on organoid technology. In the same company statement, MilliporeSigma said the acquisition expanded Merck’s capabilities in 3D cell culture and added HUB’s foundational patents, advanced model generation, and high-throughput screening services.
Report Scope
| Report Attribute | Details |
| Market size value in 2025 | USD 735 million |
| Revenue forecast in 2032 | USD 1,574.75 million |
| Growth rate (CAGR) | 11.5% (2025–2032) |
| Base year | 2025 |
| Forecast period | 2026-2032 |
| Quantitative units | USD million |
| Segments covered | By Assay Type; By Detection Method; By Application; By End User |
| Regional scope | North America, Europe, Asia Pacific, Latin America, Middle East & Africa |
| Key companies profiled | Thermo Fisher Scientific Inc.; Merck KGaA (Sigma-Aldrich); Bio-Rad Laboratories, Inc.; Becton, Dickinson and Company (BD); Agilent Technologies Inc.; PerkinElmer Inc.; F. Hoffmann-La Roche AG; GE Healthcare; Biological Industries; Promega Corporation; Abcam plc; Biotium, Inc.; Cell Signaling Technology; Mindray Medical International |
| No.of Pages | 326 |
Segmentation
By Assay Type
- DNA Synthesis Cell Proliferation Assays
- Metabolic Activity Cell Proliferation Assays
- Antigen Associated Cell Proliferation Assays
By Detection Method
- Colorimetric
- Fluorometric
- Luminescent
- Radioactive
- Others
By Application
- Cancer Research
- Drug Discovery
- Stem Cell Research
- Toxicity Testing
- Clinical Diagnostics
- Others
By End User
- Pharmaceutical & Biotechnology Companies
- Academic & Research Institutes
- Hospitals & Diagnostic Laboratories
- Others
By Region
- North America
- U.S.
- Canada
- Mexico
- Europe
- Germany
- France
- U.K.
- Italy
- Spain
- Rest of Europe
- Asia Pacific
- China
- Japan
- India
- South Korea
- South-east Asia
- Rest of Asia Pacific
- Latin America
- Brazil
- Argentina
- Rest of Latin America
- Middle East & Africa
- GCC Countries
- South Africa
- Rest of the Middle East and Africa
Request a Free Sample
Fill in your details and we'll send you a free sample report.
- Sample data tables & charts
- Research methodology
Need a Custom Version of This Report?
Tailor the scope, geography, or segments to your exact requirements.
- Custom geography or segment scope
- Direct access to our analyst team
Frequently Asked Questions
What is the current size and forecast value of the Cell Proliferation Kit Market?
What is the CAGR for the Cell Proliferation Kit Market during 2025–2032?
Which segment is the largest in the Cell Proliferation Kit Market?
What factors are driving growth in the Cell Proliferation Kit Market?
Who are the leading companies in the Cell Proliferation Kit Market?
Which region leads the Cell Proliferation Kit Market?
Table of Content
Chapter 1. Report Introduction
- 1.1 Report Description & Purpose
- 1.1.1 Report Title & Market Definition
- 1.1.2 Unique Selling Propositions (USP) & Key Differentiators
- 1.1.3 Value Proposition for Stakeholders
- 1.2 Research Objectives
- 1.2.1 Market Sizing Objectives (Volume & Revenue)
- 1.2.2 Segmentation Objectives
- 1.2.3 Competitive Intelligence Objectives
- 1.2.4 Forecast & Scenario Objectives
- 1.3 Report Scope
- 1.3.1 Cell Proliferation Kits Scope – Types & Subtypes Covered
- 1.3.2 Geographic Scope – Regions & Countries Covered
- 1.3.3 Historical Period, Base Year & Forecast Period (2025; forecast to 2032)
- 1.3.4 Inclusions & Exclusions
- 1.4 HS Code & Classification Framework
- 1.5 Currency, Units & Pricing Basis
- 1.6 Target Stakeholders
- 1.7 Limitations & Assumptions
Chapter 2. Executive Summary
- 2.1 Global Cell Proliferation Kits Market Snapshot
- 2.1.1 Market Size – Historical (2025) & Forecast (2025-2032) (2025: USD 735 million → 2032: USD 1,574.75 million)
- 2.1.2 Volume & Revenue – Global Totals
- 2.1.3 Key Market Highlights – Top Five Facts
- 2.2 Cell Proliferation Kits Market Segmentation Snapshot
- 2.2.1 Market Split by Region – 2025 vs. 2032
- 2.3 Competitive Snapshot
- 2.3.1 Top 10 Players by Revenue Share – 2025
- 2.3.2 Top 10 Players by Volume Share – 2025
- 2.3.3 Recent Strategic Developments (18-Month Summary)
- 2.4 Key Investment Highlights & Strategic Conclusions
Chapter 3. Cell Proliferation Kits Market Dynamics & Industry Analysis
- 3.1 Market Overview & Context
- 3.1.1 Cell Proliferation Kits Market Position in the Broader Automotive Value Chain
- 3.1.2 OEM vs. Replacement Market Dynamics
- 3.1.3 Market Maturity & Development Stage by Region
- 3.2 Cell Proliferation Kits Market Drivers
- 3.3 Cell Proliferation Kits Market Restraints & Challenges
- 3.4 Cell Proliferation Kits Market Opportunities
- 3.5 Porter's Five Forces Analysis
- 3.5.1 Threat of New Entrants
- 3.5.2 Bargaining Power of Suppliers
- 3.5.3 Bargaining Power of Buyers
- 3.5.4 Threat of Substitutes
- 3.5.5 Competitive Rivalry – Intensity Assessment
- 3.6 Cell Proliferation Kits Value Chain Analysis
- 3.6.1 Upstream – Raw Material/Input Suppliers
- 3.6.1.1 Raw Material/Input 1
- 3.6.1.2 Raw Material/Input 2
- 3.6.1.3 Raw Material/Input 3
- 3.6.2 Midstream – Production/Manufacturing/Service Delivery
- 3.6.2.1 Production/Process Overview
- 3.6.2.2 Key Facility Locations & Capacity by Manufacturer
- 3.6.3 Downstream – Distribution & End Consumer
- 3.6.3.1 Primary Channel – B2B/OEM
- 3.6.3.2 Secondary Channels – Dealer, Retail, Online, Direct
- 3.6.4 Value Chain Profitability Analysis
- 3.6.1 Upstream – Raw Material/Input Suppliers
- 3.7 PESTEL Analysis
- 3.7.1 Political Factors
- 3.7.2 Economic Factors
- 3.7.3 Social Factors
- 3.7.4 Technological Factors
- 3.7.5 Environmental Factors
- 3.7.6 Legal Factors
- 3.8 Cell Proliferation Kits Supply Chain Analysis
- 3.8.1 Raw Material/Input Supply Risk Assessment
- 3.8.2 Manufacturing Concentration Risk (Geographic Exposure)
- 3.8.3 Trade Disruption Impact Analysis
- 3.9 Regulatory & Policy Landscape
Note: The regulatory and policy landscape section covers regulations based on their applicability to the market, Cell Proliferation Kits category, geography, and scope of the study. Only regulatory frameworks with a material impact on operations, compliance, trade, sustainability, or market access are analyzed in detail.
Chapter 4. Key Investment Pockets & Opportunity Analysis
- 4.1 Cell Proliferation Kits Market Attractiveness Analysis
- 4.1.1 By Region – Investment Attractiveness Matrix (Volume × CAGR)
- 4.2 Absolute Revenue Growth Opportunity
- 4.2.1 By Region – Absolute USD Growth Through 2032
- 4.3 Incremental Volume Opportunity
- 4.3.1 By Region – Incremental Volume Through 2032
- 4.3.2 Segment – Incremental Volume
- 4.4 Emerging Submarket Opportunity Deep Dive (Subject to Applicability)
- 4.5 Emerging Market Opportunity Scorecards
- 4.5.1 United States
- 4.5.2 Europe
- 4.5.3 Asia
- 4.5.4 Middle East & Africa
Note: Emerging Market Opportunity Scorecards will be included based on relevance and strategic importance. Regions listed are indicative and may vary depending on data availability and market dynamics.
Chapter 5. Cell Proliferation Kits Import-Export Analysis & Trade Flows
- 5.1 Global Trade Overview
- 5.1.1 Global Export Value by Country (2025)
- 5.1.2 Global Export Volume by Country (2025)
- 5.1.3 Global Import Value by Country (2025)
- 5.1.4 Global Import Volume by Country (2025)
- 5.1.5 Net Trade Balance by Country (2025)
- 5.2 Export Analysis – Segment
- 5.2.1 Type 1 (HS Code)
- 5.2.2 Type 2 (HS Code)
- 5.2.3 Type 3 (HS Code)
- 5.2.4 Type 4 (HS Code)
- 5.2.5 Type 5 (HS Code)
- 5.3 Import Analysis – Segment
- 5.3.1 Type 1 (HS Code)
- 5.3.2 Type 2 (HS Code)
- 5.3.3 Type 3 (HS Code)
- 5.3.4 Type 4 (HS Code)
- 5.3.5 Type 5 (HS Code)
- 5.4 Average Unit Trade Prices
- 5.4.1 Average Export Price – Segment & Country
- 5.4.2 Average Import Price – Segment & Source Country
- 5.4.3 Price Trends (2025)
- 5.5 Key Trade Route Analysis
- 5.5.1 Trade Route 1
- 5.5.2 Trade Route 2
- 5.5.3 Trade Route 3
- 5.5.4 Trade Route 4
- 5.5.5 Trade Route 5
- 5.6 Trade Policy Impact Assessment
- 5.6.1 US Anti-Dumping & Section 301 Tariffs
- 5.6.2 EU Customs Union Impact
- 5.6.3 Major Free Trade Agreements
- 5.6.4 USMCA Rules of Origin
Note: Trade policy analysis will be included only where relevant to the Cell Proliferation Kits market.
Chapter 6. Competitive Landscape & Company Benchmarking
- 6.1 Cell Proliferation Kits Market Concentration & Structure
- 6.1.1 Herfindahl-Hirschman Index (HHI) – vs. 2025
- 6.1.2 Tier 1, Tier 2 & Tier 3 Market Structure
- 6.1.3 Global, Regional & Local Player Dynamics
- 6.2 Cell Proliferation Kits Market Share Analysis – 2025
- 6.2.1 Global Revenue Share by Company
- 6.2.2 Global Volume Share by Company
- 6.2.3 Regional Revenue Share
- 6.2.4 Market Share Evolution ( vs. 2025)
- 6.2.5 OEM Segment Share by Company
- 6.2.6 Replacement Segment Share by Company
- 6.3 Production/Delivery Capacity & Facility Analysis
- 6.3.1 Global Installed Capacity
- 6.3.2 Capacity Utilization Rates
- 6.3.3 Production/Output Volume
- 6.3.4 Facility Locations & Capacity Map
- 6.3.5 Planned Capacity Additions
- 6.4 Cell Proliferation Kits Competitive Benchmarking Matrix
- 6.4.1 Revenue, Volume, CAGR & Profitability Comparison
- 6.4.2 Channel Revenue Mix
- 6.4.3 Geographic Revenue Exposure
- 6.4.4 R&D Intensity
- 6.4.5 Sustainability Maturity
- 6.5 Strategic Developments in Cell Proliferation Kits (Last 24 Months)
- 6.5.1 Mergers, Acquisitions & Divestments
- 6.5.2 New Cell Proliferation Kits Launches
- 6.5.3 Facility Expansions
- 6.5.4 Strategic Alliances, Joint Ventures & Partnerships
- 6.5.5 Distribution Expansion & Market Entry
- 6.5.6 Sustainability & ESG Initiatives
- 6.6 Competitive Strategy Mapping
- 6.6.1 Leader, Challenger, Follower & Niche Classification
- 6.6.2 Pricing Strategy Comparison
- 6.6.3 Channel Strategy Matrix
Note: Strategic developments are included based on their materiality and the availability of reliable information.
Chapter 7. Global Cell Proliferation Kits Market – By Distribution Channel
- 7.1 Segment Overview
- 7.1.1 Volume & Revenue Split by Channel (2025 & 2032)
- 7.1.2 Channel Mix Evolution (2025-2032)
Chapter 8. Regional Market Analysis – Global Overview
- 8.1 Global Regional Overview
- 8.1.1 Regional Volume Share
- 8.1.2 Regional Revenue Share
- 8.1.3 Regional Volume by Region
- 8.1.4 Regional Revenue by Region
- 8.1.5 Regional Forecast Through 2032
- 8.2 Cross-Regional Segment Analysis
- 8.2.1 By Distribution Channel
- 8.2.2 By Brand/Price Tier
Chapter 9. North America Cell Proliferation Kits Market
- 9.1 United States
- 9.2 Canada
- 9.3 Mexico
Chapter 10. Europe Cell Proliferation Kits Market
- 10.1 Germany
- 10.2 France
- 10.3 Italy
- 10.4 United Kingdom
- 10.5 Spain
- 10.6 Poland
- 10.7 Russia
- 10.8 Netherlands
- 10.9 Belgium
- 10.10 Sweden
- 10.11 Denmark
- 10.12 Norway
- 10.13 Rest of Europe
Chapter 11. Asia Pacific Cell Proliferation Kits Market
- 11.1 China
- 11.2 India
- 11.3 Japan
- 11.4 South Korea
- 11.5 Thailand
- 11.6 Indonesia
- 11.7 Vietnam
- 11.8 Malaysia
- 11.9 Australia
- 11.10 Rest of Asia Pacific
Chapter 12. Latin America Cell Proliferation Kits Market
- 12.1 Brazil
- 12.2 Argentina
- 12.3 Colombia
- 12.4 Chile
- 12.5 Rest of Latin America
Chapter 13. Middle East Cell Proliferation Kits Market
- 13.1 Saudi Arabia
- 13.2 United Arab Emirates
- 13.3 Turkey
- 13.4 Israel
- 13.5 Iran
- 13.6 Rest of the Middle East
Chapter 14. Africa Cell Proliferation Kits Market
- 14.1 South Africa
- 14.2 Egypt
- 14.3 Nigeria
- 14.4 Morocco
- 14.5 Rest of Africa
Chapter 15. Cell Proliferation Kits Company Profiles
- 15.1 [Company 01]
- 15.1.1 Company Overview
- 15.1.2 Key Management Personnel
- 15.1.3 Products & Services Portfolio
- 15.1.4 Financial Performance
- 15.1.5 Key Market Focus & Geographic Presence
- 15.1.6 Recent Developments & Strategic Initiatives
Note: The company profile list is preliminary and may change based on research findings, market developments, data availability, and client requirements.
Chapter 16. Appendices
- Appendix A – List of Abbreviations & Acronyms
- Appendix B – Industry Classification Code Reference – Full Series
- Appendix C – Production & Capacity Data Tables
- Appendix D – End-Use & Demand Base Tables
- Appendix E – Consumption & Replacement Rate Assumptions
- Appendix F – ASP Reference Tables
- Appendix G – Manufacturing & Facility Database
- Appendix H – Import-Export Data Tables
- Appendix I – Regulatory Summary Tables
- Appendix J – Primary Research Participant List (Anonymized)
- Appendix K – Primary Research Questionnaire Framework
- Appendix L – Data Sources & Bibliography
- Appendix M – Market Size Divergence & Source Comparison
Chapter 17. Research Methodology
- 17.1 Research Framework & Philosophy
- 17.2 Secondary Research – Sources, Hierarchy & Data Extraction
- 17.3 Data Modeling – Bottom-Up & Top-Down Market Sizing
- 17.4 Primary Research – Stakeholder Framework, LOI & Sample Sizes
- 17.5 Forecast Methodology – Regression, Scenario & Sensitivity Analysis
- 17.6 Quality Control – Four-Layer Validation Framework
- 17.7 Limitations & Standard Assumptions
- 17.8 Disclaimer
