Market Overview:
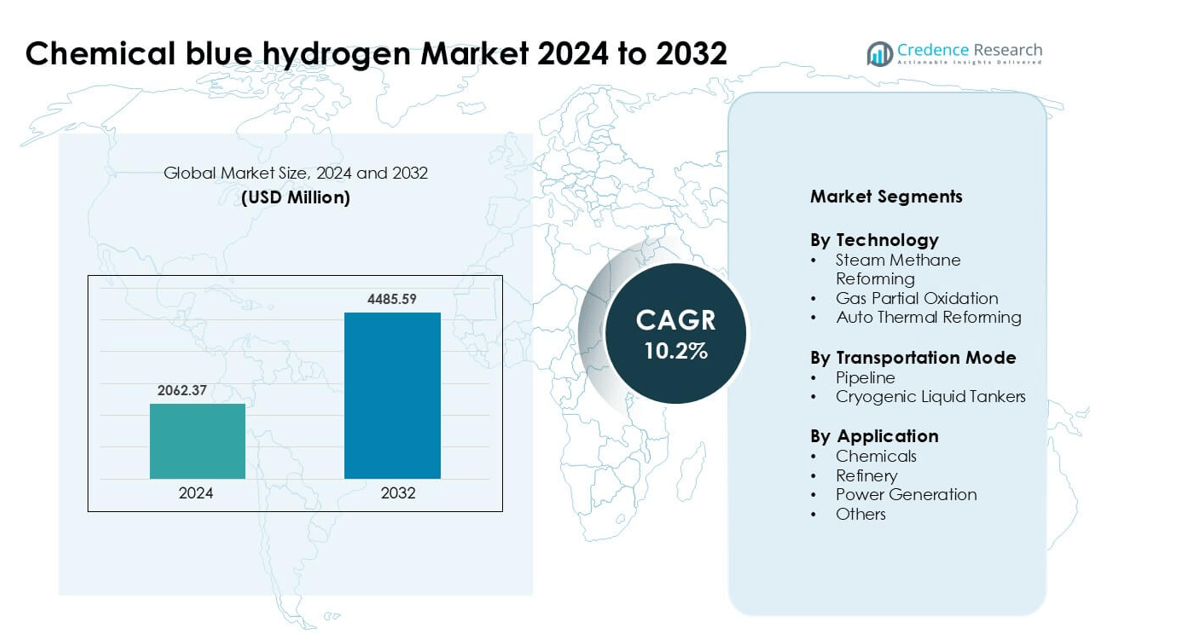
Chemical blue hydrogen market was valued at USD 2062.37 million in 2024 and is anticipated to reach USD 4485.59 million by 2032, growing at a CAGR of 10.2% during the forecast period.
| REPORT ATTRIBUTE |
DETAILS |
| Historical Period |
2020-2023 |
| Base Year |
2024 |
| Forecast Period |
2025-2032 |
| Chemical Blue Hydrogen Market Size 2024 |
USD 2062.37 million |
| Chemical Blue Hydrogen Market, CAGR |
10.2% |
| Chemical Blue Hydrogen MarketSize 2032 |
USD 4485.59 million |
The chemical blue hydrogen market features strong competition from major industrial gas suppliers and energy companies. Key players include Linde plc, Air Liquide, Air Products and Chemicals, INOX Air Products, Shell, Exxon Mobil, Equinor, ENGIE, Iwatani Corporation, and SOL Group. These companies invest in reforming units equipped with carbon capture systems, long-term offtake agreements, and hydrogen-ready infrastructure. Strategic partnerships with refineries, chemical plants, and pipeline operators support large-scale deployment. North America leads the market with a 36% share, driven by hydrogen hubs, supportive tax credits, and expanding carbon storage capacity.
Market Insights
- The chemical blue hydrogen market reached USD 2062.37 million in 2024 and is expected to grow at a CAGR of 10.2% through 2032.
- Rising carbon-reduction mandates, industrial decarbonization policies, and refinery upgrades drive demand, as chemical and fertilizer plants replace grey hydrogen with low-carbon feedstock.
- Steam Methane Reforming leads with a 61% share due to high output and mature infrastructure, while pipeline transport dominates with a 67% share supported by hydrogen-ready gas networks and industrial clusters.
- Competition intensifies as Linde, Air Liquide, Air Products, Shell, and Exxon Mobil invest in carbon capture systems, export-linked ammonia projects, and long-term supply contracts with chemical producers.
- North America leads with a 36% market share, followed by Europe at 30%, supported by hydrogen hubs, CO₂ storage reservoirs, and tax incentives; the chemicals segment remains largest with a 54% share across global demand.
Access crucial information at unmatched prices!
Request your sample report today & start making informed decisions powered by Credence Research Inc.!
Download Sample
Market Segmentation Analysis:
By Technology
Steam Methane Reforming (SMR) leads the technology segment with a 61% market share due to its established infrastructure, high hydrogen yield, and lower production cost compared to alternative routes. Industries prefer SMR because existing natural gas networks and reforming units can be upgraded with carbon capture systems, reducing emissions. Auto Thermal Reforming captures growing interest from integrated energy complexes that require flexible feedstock and better heat balance. Gas Partial Oxidation holds a smaller share and is used mainly in heavy industrial plants processing residue fuels. Investments in carbon capture integration continue to reinforce SMR’s dominance.
- For instance, Air Products operates a large-scale carbon capture system on two steam methane reformer (SMR) hydrogen production plants at the in Port Arthur, Texas. The facility has the capacity to and successfully captures approximately 1 million tonnes (or short tons) of CO₂ annually.
By Transportation Mode
Pipeline transport dominates the segment with a 67% market share, driven by cost efficiency, continuous flow, and large-volume industrial supply. Countries with well-established gas pipeline grids convert sections for hydrogen blending and transmission, reducing the need for new infrastructure. Cryogenic liquid tankers serve cross-border and long-distance delivery where pipeline networks are limited. The demand for tankers increases in industrial clusters and export terminals, but higher storage and liquefaction costs keep pipeline transport ahead. Growing refinery and chemical consumption further supports pipeline expansion across major industrial zones.
- For instance, Air Liquide operates a hydrogen pipeline network that extends 700 kilometers across France, Belgium, and the Netherlands, supplying continuous hydrogen flow to refineries and chemical plants, and maintaining industrial-grade purity levels through automated pressure control systems.
By Application
The chemicals segment holds a 54% market share, making it the largest application area for blue hydrogen. Ammonia, methanol, and other hydrogen-intensive chemicals rely on continuous feedstock supply, and carbon-captured hydrogen helps producers meet emission standards. Refineries follow as they replace grey hydrogen in desulfurization and hydrocracking units. Power generation gains momentum in pilot plants using hydrogen-fired turbines and blended fuel systems, but remains smaller in scale. Industrial decarbonization mandates, combined with carbon pricing policies, strengthen chemical sector dominance and long-term procurement contracts.
Key Growth Drivers
Carbon Reduction Mandates and Net-Zero Commitments
Global emission reduction targets act as a major catalyst for blue hydrogen adoption. Countries implement carbon pricing, tax credits, and mandatory decarbonization policies across chemicals, refineries, and power sectors. Industrial plants replace grey hydrogen with carbon-captured alternatives to cut direct emissions without redesigning processes. Energy companies invest in carbon capture facilities, enabling hydrogen production with reduced carbon intensity. Governments support large-scale projects through subsidies, investment guarantees, and hydrogen corridors. This regulatory support accelerates commercialization and helps heavy industries meet climate targets while maintaining operational continuity. The push for net-zero also drives oil and gas companies to diversify into low-carbon hydrogen, creating long-term demand certainty.
- For instance, Equinor’s Northern Lights CCS project in Norway captures 1,500,000 tonnes of CO₂ every year and stores it in offshore reservoirs, supporting blue hydrogen production for industrial users in Northern Europe.
Expansion of Hydrogen Infrastructure and Industrial Clusters
Pipeline modernization, hydrogen-ready transmission networks, and storage terminals strengthen the supply chain. Large industrial zones integrate blue hydrogen into existing chemical, fuel, and fertilizer plants. Shared carbon capture units and transport pipelines reduce project costs and increase scalability. Export terminals for ammonia and liquefied hydrogen grow in regions with abundant natural gas resources. Strategic partnerships between utilities, refiners, and gas producers help establish hubs with offtake agreements. This cluster-based approach lowers infrastructure barriers and accelerates commercial deployment across major demand centers.
- For instance, The Port of Rotterdam area is home to a large industrial cluster with over 120 industrial companies in total, including 4-5 world-scale oil refineries and more than 40 petrochemical companies.
Cost Advantage Over Green Hydrogen in Near Term
Blue hydrogen remains more cost-competitive than renewable-based production in many regions. Existing natural gas availability, operational reforming units, and maturing carbon capture technologies reduce production cost. Companies can modify current reformers rather than build new electrolysis facilities, lowering capital requirements. Power constraints also favor blue hydrogen in markets with limited renewable generation capacity. These financial benefits attract industrial users that require large, continuous energy feedstock. As a result, blue hydrogen acts as a transitional pathway to decarbonize sectors that lack immediate electrification options.
Key Trends & Opportunities
Rising Investment in Carbon Capture and Storage (CCS) Technology
Energy companies deploy advanced capture systems with higher efficiency and lower energy penalties. Offshore and depleted onshore reservoirs expand long-term CO₂ storage capacity. Integrated capture-to-storage networks enable large volumes of hydrogen production with reduced emissions. Oil and gas operators repurpose pipelines and drilling assets for CO₂ transport and injection. Successful CCS scaling unlocks opportunities for large blue hydrogen export projects linked to ammonia and synthetic fuel markets. This trend supports global decarbonization while keeping production costs stable.
- For instance, ExxonMobil’s CCS facility in LaBarge captures 7,000,000 tonnes of CO₂ each year and transports it through dedicated pipelines to permanent geological storage sites, making it one of the highest-volume CO₂ capture operations in the energy sector.
Growth of Hydrogen-Powered Power Plants and Gas Blending
Utilities test hydrogen-fired turbines and combined-cycle plants to reduce carbon output. Several regions blend hydrogen with natural gas in existing transmission systems, lowering emissions while avoiding major infrastructure upgrades. Equipment manufacturers develop turbines designed for high hydrogen ratios, expanding demand in power generation. Long-term opportunities emerge as hydrogen-to-power projects gain investment support and carbon credits. Pilots in industrial parks and ports demonstrate grid-scale feasibility, prompting wider adoption.
- For instance, GE has supplied 9F turbines to South Korea, and there are discussions/plans to explore hydrogen co-firing, such as at Sembcorp’s Sakra power plant in Singapore.
Key Challenges
High Capital Investment and Infrastructure Limitations
Blue hydrogen requires investment in reforming units, capture systems, pipelines, and storage networks. Many regions lack carbon transport systems or safe geological storage sites. Building new infrastructure demands policy clarity, long permitting timelines, and stable financing. Smaller companies face high entry barriers due to heavy capex requirements. These factors slow scale-up and restrict adoption to well-funded markets with strong government support.
Natural Gas Price Volatility and Supply Risk
Blue hydrogen depends on natural gas as a feedstock, making production costs sensitive to market fluctuations. Geopolitical conflicts, supply constraints, and export restrictions cause price spikes that undermine cost stability. Volatile gas prices limit long-term procurement contracts and discourage industrial switching from grey hydrogen. Regions with limited domestic gas resources face additional import costs and energy security issues. As a result, market growth can fluctuate with global energy dynamics.
Regional Analysis
North America
North America leads the chemical blue hydrogen market with a 36% share, driven by strong carbon reduction policies, tax incentives, and expansion of large hydrogen hubs. The U.S. develops carbon capture and storage networks linked to existing natural gas infrastructure, enabling cost-efficient production at scale. Refineries and chemical plants in the Gulf Coast sign long-term offtake agreements to replace grey hydrogen. Canada invests in blue ammonia export terminals targeting Asian and European buyers. Growing pipeline modernization and clean fuel standards reinforce regional leadership and attract multinational energy companies to launch new low-carbon hydrogen projects.
Europe
Europe holds a 30% market share, supported by strict emission regulations, carbon pricing mechanisms, and major industrial decarbonization programs. Countries such as the U.K., Germany, and the Netherlands develop hydrogen-ready pipeline networks and offshore CO₂ storage sites in depleted reservoirs. Chemical manufacturers transition to blue hydrogen to comply with sustainability targets and maintain competitiveness in international markets. EU funding and hydrogen strategies enable cross-border supply chains and energy imports through ammonia carriers. Growing demand from refineries and fertilizer producers strengthens adoption, while partnerships with Middle Eastern gas suppliers create long-term supply security.
Asia-Pacific
Asia-Pacific accounts for a 22% market share, primarily led by Japan, South Korea, China, and Australia. The region focuses on blue ammonia and liquefied hydrogen exports to supply power utilities and industrial consumers. Countries with large natural gas reserves—such as Australia and Malaysia—invest in integrated capture and storage sites linked to export ports. Japan and South Korea sign supply agreements to ensure fuel availability for hydrogen turbines and chemical plants. China expands demonstration projects under national carbon reduction plans. Growing LNG infrastructure and heavy industrial demand support regional growth.
Middle East & Africa
The Middle East & Africa region holds an 8% market share, driven by abundant natural gas resources and growing investment in blue ammonia export facilities. Countries including Saudi Arabia, the UAE, and Qatar develop large hydrogen projects integrated with offshore CO₂ storage and petrochemical complexes. Energy companies target European and Asian buyers seeking low-carbon fuel for power generation and chemical production. The region focuses on cost-competitive production, benefiting from low gas extraction costs and existing industrial clusters. Government-led energy diversification programs strengthen long-term prospects.
Latin America
Latin America captures a 4% share, with early-stage adoption led by Brazil, Chile, and Argentina. The region explores blue hydrogen to decarbonize refining, fertilizer, and chemical production. Existing offshore basins and depleted reservoirs offer storage options for captured CO₂. Government policies and pilot projects remain limited, but multinational energy companies assess export opportunities. Growth depends on investment incentives, pipeline development, and integration with LNG terminals. While still emerging, Latin America holds long-term potential due to natural gas availability and competitive production costs in selected countries.
Market Segmentations:
By Technology
- Steam Methane Reforming
- Gas Partial Oxidation
- Auto Thermal Reforming
By Transportation Mode
- Pipeline
- Cryogenic Liquid Tankers
By Application
- Chemicals
- Refinery
- Power Generation
- Others
By Geography
- North America
- Europe
- Germany
- France
- U.K.
- Italy
- Spain
- Rest of Europe
- Asia Pacific
- China
- Japan
- India
- South Korea
- South-east Asia
- Rest of Asia Pacific
- Latin America
- Brazil
- Argentina
- Rest of Latin America
- Middle East & Africa
- GCC Countries
- South Africa
- Rest of the Middle East and Africa
Competitive Landscape
The competitive landscape of the chemical blue hydrogen market features participation from global energy giants, industrial gas suppliers, and emerging low-carbon technology developers. Companies such as Linde plc, Air Liquide, Air Products and Chemicals, and INOX Air Products expand production capacity by integrating carbon capture units into existing hydrogen plants. Oil companies including Exxon Mobil, Shell, and Equinor invest in large reforming projects connected to geological CO₂ storage and export terminals for ammonia and synthetic fuels. Strategic partnerships between utilities, pipeline operators, and chemical manufacturers help secure long-term offtake agreements and reduce project risk. Firms compete on carbon reduction efficiency, production cost, and access to natural gas reserves. Government incentives and certification schemes increase transparency around carbon intensity, encouraging producers to scale operations while meeting regulatory standards. As infrastructure expands and industrial clusters develop, competition is expected to intensify across regional markets.
Shape Your Report to Specific Countries or Regions & Enjoy 30% Off!
Key Player Analysis
- SOL Group
- Exxon Mobil Corp.
- Air Products and Chemicals, Inc.
- Engie
- Iwatani Corp.
- Equinor ASA
- Air Liquide
- INOX Air Products Ltd.
- Shell Group of Companies
- Linde plc
Recent Developments
- In 2025, Air Products firm applied for new air permits for the Louisiana blue hydrogen plant in Ascension Parish. Regulatory steps indicate the project remains active despite schedule changes.
- In February 2025, Air Products company exited three U.S. hydrogen projects unrelated to the Louisiana blue hydrogen complex. Portfolio changes underscore a focus shift while progressing the Louisiana sit
Report Coverage
The research report offers an in-depth analysis based on Technology, Transportation Mode, Application and Geography. It details leading market players, providing an overview of their business, product offerings, investments, revenue streams, and key applications. Additionally, the report includes insights into the competitive environment, SWOT analysis, current market trends, as well as the primary drivers and constraints. Furthermore, it discusses various factors that have driven market expansion in recent years. The report also explores market dynamics, regulatory scenarios, and technological advancements that are shaping the industry. It assesses the impact of external factors and global economic changes on market growth. Lastly, it provides strategic recommendations for new entrants and established companies to navigate the complexities of the market.
Future Outlook
- Demand will rise as chemical and refining companies replace grey hydrogen to meet emission targets.
- More carbon capture units will attach to existing reformers, reducing project timelines and cost.
- Pipeline networks will convert to hydrogen-ready transmission, improving large-volume supply.
- Blue ammonia exports will expand to Asia and Europe for fuel, power, and fertilizer use.
- Utilities will test hydrogen-fired turbines, opening new opportunities in low-carbon power generation.
- Government incentives and carbon credit schemes will increase investment in large-scale projects.
- Oil and gas companies will diversify into hydrogen to protect long-term revenue.
- Technology upgrades will improve capture efficiency and reduce operating cost.
- Partnerships between energy companies, chemical producers, and pipeline operators will strengthen offtake security.
- Regional industrial hubs will form around CCS pipelines and storage reservoirs, pushing faster commercial adoption.


