
Market Overview:
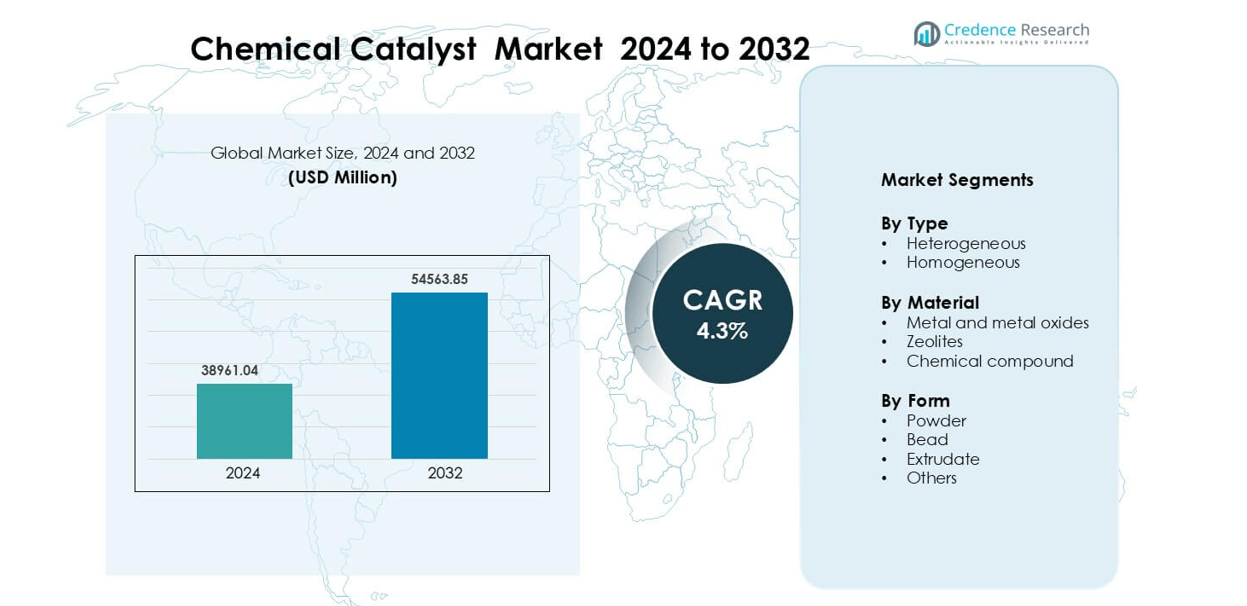
Chemical Catalyst Market was valued at USD 38961.04 million in 2024 and is anticipated to reach USD 54563.85 million by 2032, growing at a CAGR of 4.3 % during the forecast period.
| REPORT ATTRIBUTE | DETAILS |
|---|---|
| Historical Period | 2020-2023 |
| Base Year | 2024 |
| Forecast Period | 2025-2032 |
| Chemical Catalyst Market Size 2024 | USD 38961.04 million |
| Chemical Catalyst Market, CAGR | 4.3% |
| Chemical Catalyst Market Size 2032 | USD 54563.85 million |
The Chemical Catalyst Market is shaped by major players including Albemarle Corporation, BASF SE, Evonik Industries AG, Johnson Matthey, W. R. Grace & Co.-Conn., Haldor Topsoe A/S, LyondellBasell Industries Holdings B.V., Arkema, and The Dow Chemical Company. These companies supply catalysts for refining, petrochemicals, polymers, emission control, and specialty chemical production, competing on catalyst life, selectivity, and conversion efficiency. Asia Pacific leads the global market with 36% share, driven by expanding refinery capacity, polymer production, and strong automotive emission control demand in China, India, South Korea, and Southeast Asia. Strategic collaborations, technology licensing, and catalyst regeneration services allow top manufacturers to strengthen customer relationships and expand global reach
Market Insights
- The Chemical Catalyst Market was valued at USD 38961.04 in 2024 and is expected to reach USD 54563.85 by 2032, expanding at a CAGR of 4.3% during the forecast period.
- Strong demand from refining, petrochemicals, polymers, and pharmaceuticals drives catalyst adoption as industries seek higher conversion efficiency, cleaner fuels, and reduced emissions.
- Nano-structured and metal-oxide catalysts gain traction in hydrogen production, plastic recycling, and bio-fuel processing, while digital monitoring systems help extend catalyst life and improve reactor performance.
- Competition remains strong among Albemarle, BASF, Johnson Matthey, Evonik, Haldor Topsoe, Arkema, W. R. Grace, LyondellBasell, and Dow, with companies focusing on long-term supply contracts, catalyst regeneration, and specialty formulations for complex feedstocks.
- Asia Pacific holds the largest regional share at 36%, while heterogeneous catalysts lead by type due to easy separation and longer cycle life; extrudates dominate by form because they improve flow distribution and reduce pressure drop in large reactor systems.
Market Segmentation Analysis:
By Type
Heterogeneous catalysts hold the dominant share because they offer easy separation, reusability, and lower purification costs. These catalysts support large-scale petrochemical, polymer, and refining processes where high thermal stability and long operating life are essential. Fixed-bed reactors and fluid catalytic cracking units rely heavily on solid-phase catalysts to improve yield and reduce energy losses. Homogeneous catalysts grow in fine chemicals and pharmaceuticals because they enable precise selectivity and faster reaction rates. However, challenges in recovery and disposal keep heterogeneous catalysts ahead in industrial adoption and commercial capacity.
- For instance, the permitted daily exposure (PDE) of many precious-metal homogeneous catalyst residues (such as palladium or platinum) in pharmaceuticals, when administered orally, is typically set around 100 µg/day by guidelines like ICH Q3D.
By Material
Metal and metal oxide catalysts lead the market with the highest share due to strong demand in hydrogen production, exhaust treatment, and refinery conversion units. Platinum, nickel, and palladium-based systems improve reaction speed and lower emissions in fuel reforming and automotive catalytic converters. Zeolites gain traction in isomerization, cracking, and adsorption processes, supported by their high surface area and shape-selective capabilities. Chemical compound catalysts remain relevant in polymerization and specialty chemical synthesis, but wider usage of metal-based formulations keeps this segment dominant.
- For instance, a PLATIRUS project report on spent automotive catalysts documented that processing ~1.3 kg of spent milled autocatalyst yielded about 1.2 g of palladium and 0.8 g of platinum in the recovered metal fraction - concrete recovery figures used to plan recycling and supply flows for PGM-based converter systems.
By Form
Extrudate catalysts dominate the market as refineries and chemical plants require high mechanical strength, low pressure drop, and uniform flow distribution. Their cylindrical or multi-lobed shapes improve gas and liquid contact efficiency in large fixed-bed reactors. Bead catalysts maintain a strong share in fluidized-bed operations due to better fluid movement and reduced attrition. Powder catalysts find use in laboratory and batch processes where quick dispersion is needed. Although other forms exist for niche setups, extrudates remain preferred in continuous and high-capacity production lines.
Key Growth Drivers
Rising Adoption of Green Chemistry and Renewable Feedstocks
The shift toward sustainable chemistry drives stronger use of catalysts for bio-based fuels, bio-plastics, and waste-to-chemical processes. Enzymatic, metal, and zeolite catalysts enable selective conversion of agricultural waste, biomass, and waste oils into ethanol, biodiesel, and specialty chemicals. Industries invest in catalytic depolymerization and pyrolysis to recycle plastics into monomers and fuel products. Chemical manufacturers also use catalysts to cut energy use and prevent hazardous by-products, aligning with environmental regulations. Government incentives for clean fuel blending and circular economy projects support wider deployment of advanced catalytic systems. Green hydrogen production through reforming and electrolysis increases demand for catalysts with higher stability and poisoning resistance. This trend boosts development of customized catalysts for renewable feedstock processing in refineries and chemical facilities.
- For instance, Heraeus Precious Metals reports that its precious-metal-based heterogeneous catalysts are used for conversion of biomass (e.g., lignocellulose, 5-HMF) into chemical intermediates and offer tailored solutions at the full scale from pilot to industrial level.
Expansion of Petrochemical and Refining Capacity
The chemical catalyst market grows as refineries and petrochemical complexes expand capacity to meet rising fuel and polymer demand. Companies upgrade hydroprocessing, catalytic cracking, and reforming units to increase yield and achieve cleaner emissions. Catalyst suppliers develop high-surface-area materials, improved thermal stability, and longer regeneration cycles to reduce downtime in large plants. Growth in polypropylene, polyethylene, and aromatics production further stimulates catalyst demand because cracking and isomerization units rely on efficient catalytic beds to control reaction speed and purity levels. Many governments promote cleaner fuel standards, pushing refiners to adopt desulfurization and hydro-treating catalysts for low-sulfur gasoline and diesel. As global energy consumption shifts toward higher-value chemical feedstocks, catalysts remain essential for improving conversion efficiency, extending reactor life, and lowering greenhouse gases. This expansion strengthens long-term demand across developing and developed economies.
Demand for High-Performance Catalysts in Fine Chemicals and Pharmaceuticals
Pharmaceutical and specialty chemical companies rely on catalysts for selective reactions, precise molecular control, and high purity levels. Homogeneous and supported metal catalysts drive innovation in drug synthesis, agrochemicals, and fragrance compounds. Growth in biologics, specialty polymers, and active pharmaceutical ingredients expands usage of chiral and enzyme-based catalysts. Manufacturers prefer catalysts that reduce steps in synthesis, limit waste, and improve yield per batch. Continuous manufacturing systems use compact reactors and structured catalysts to accelerate processing and reduce cost. As healthcare spending rises and specialty formulations gain traction, demand for tailored catalytic systems grows across research labs and production plants. This segment pushes suppliers to develop catalysts offering minimal contamination, high recyclability, and consistent reaction behavior.
Key Trend & Opportunity
Nano-Engineered and Structured Catalysts
Nano-structured catalysts gain momentum because they improve activity, selectivity, and durability at lower metal usage. High surface area and controlled pore size allow faster reaction kinetics and better product purity. Refineries and chemical companies adopt nano-engineered materials for hydrogenation, emission control, and reforming processes. Structured catalysts, including monoliths and coated foams, reduce pressure drop and improve heat transfer in continuous reactors. Their reduced metal loading lowers operational cost while extending cycle time. This segment offers strong opportunities in automotive converters, green fuel production, and large-scale petrochemical plants. Research partnerships between catalyst manufacturers, universities, and energy companies accelerate commercial adoption.
- For instance, Corning’s Celcor® cordierite monolith substrates are supplied in standard cell densities of 400 cpsi and 600 cpsi, with reported geometric surface areas of 28.7–36.2 cm²/cm³ and bulk densities in the range 220–324 g/L, metrics used by OEMs to specify washcoat and catalyst loading for automotive and industrial converters.
Digital Monitoring and Predictive Catalyst Maintenance
Industries adopt digital tools and sensor-enabled reactors to monitor catalyst behavior in real time. Smart reactors track bed temperature, pressure fluctuations, and deactivation rates, allowing operators to adjust conditions before performance loss occurs. Predictive analytics extend catalyst life, reduce regeneration frequency, and limit plant shutdowns. Cloud platforms help refineries compare performance across multiple units and optimize catalyst selection for feedstock variations. Data-driven operations create opportunities for suppliers offering catalytic systems bundled with monitoring software and technical services. As chemical plants digitalize, demand for intelligent catalyst management systems expands in ammonia, methanol, polymer, and refining applications.
- For instance, Honeywell does offer comprehensive predictive maintenance solutions, specifically through their Honeywell Forge Performance+ for Industrials | Asset Performance Management (APM) software.
Key Challenge
Catalyst Deactivation and Short Replacement Cycles
Catalyst deactivation due to fouling, poisoning, sintering, and thermal stress remains a major barrier for cost-efficient operations. Impurities in feedstocks, such as sulfur, metals, and chlorine compounds, reduce catalyst activity and shorten life. Refineries handling heavy or crude-to-chemicals feeds face higher replacement frequency and regeneration expenses. Handling, disposal, and recycling of spent catalysts increase operational cost and raise environmental concerns. Catalyst suppliers continue developing formulations with higher poisoning resistance and longer operating hours, but extreme processing conditions still limit durability in hydroprocessing and cracking units. This challenge pushes companies to invest in advanced purification and pre-treatment technologies.
Volatile Metal Prices and Limited Supply Chain Stability
Precious metals such as platinum, palladium, nickel, and rhodium remain core to many catalytic systems. Price fluctuations and limited mining capacity strain catalyst procurement budgets for refineries, chemical plants, and automotive manufacturers. Supply disruptions due to geopolitical conditions, export regulations, and logistics delays impact production schedules and catalyst availability. Although recycling and metal recovery technologies grow, they do not fully offset demand from large-scale users. Manufacturers attempt to reduce precious metal loading through improved dispersion and nano-structuring, but cost pressures persist. These constraints slow adoption of advanced systems in cost-sensitive regions and smaller chemical facilities.
Regional Analysis
North America
North America holds 28% share of the Chemical Catalyst Market, supported by strong refining and petrochemical capacity across the United States and Canada. Refineries upgrade hydrotreating and catalytic cracking units to produce low-sulfur fuels, increasing demand for high-performance heterogeneous catalysts. Pharmaceutical and specialty chemical industries adopt selective catalysts to enhance purity and reduce waste. Growth in renewable diesel, bio-refineries, and carbon capture projects further boosts catalyst consumption. Well-established technology providers, strong R&D activity, and adoption of advanced reactor systems keep North America a major revenue contributor with steady long-term demand.
Europe
Europe accounts for 25% share, driven by strict environmental policies, advanced manufacturing infrastructure, and strong automotive emission standards. Germany, the Netherlands, France, and the UK remain major users of zeolite, metal, and oxidation catalysts across refineries and polymer plants. Euro-VI and Euro-VII norms sustain large automotive catalyst consumption. Growing investment in green hydrogen, ammonia, and waste-to-chemical projects increases demand for high-efficiency catalytic systems. The region also leads in the adoption of catalysts for recycling and low-carbon fuels, supported by strong chemical R&D and established multinational catalyst suppliers.
Asia Pacific
Asia Pacific holds 36% share, making it the largest regional market. China, India, South Korea, and Southeast Asia continue expanding petrochemical, polymer, fertilizer, and pharmaceutical production, increasing demand for heterogeneous and metal-based catalysts. China leads due to large automotive catalyst usage and fuel-desulfurization requirements. India invests in polypropylene, PTA, and green chemical plants, increasing catalyst consumption in refinery and specialty chemical segments. Rapid industrialization, cost-competitive manufacturing, rising energy demand, and supportive government policies for cleaner fuels keep Asia Pacific the strongest growth hub for catalyst suppliers.
Latin America
Latin America holds 6% share, with gradual growth driven by refinery modernization in Brazil, Mexico, and Argentina. Hydrocracking and hydrotreating catalysts gain traction as countries adopt cleaner fuel standards. Brazil’s ethanol-to-chemicals and polymer sectors bring opportunities for metal and zeolite catalysts. Fertilizer manufacturing and petrochemical upgrades also support demand. Economic uncertainty and delayed industrial investments slow rapid expansion, but partnerships between global catalyst suppliers and national oil companies ensure steady adoption. Technical service support and cost-efficient catalyst formulations help increase competitiveness in refining and chemical processing.
Middle East & Africa
The Middle East & Africa accounts for 5% share, driven by large gas-processing and refinery complexes in Saudi Arabia, UAE, Qatar, and Kuwait. Hydrocracking, reforming, and catalytic cracking units rely on advanced metal and zeolite catalysts to improve conversion efficiency and product yields. Gas-to-chemicals, methanol, and ammonia projects also stimulate catalyst usage. In Africa, South Africa and Egypt grow through fuel upgrading, polymer production, and emission-control requirements. Although the region has fewer downstream units than Asia Pacific, long-term crude-to-chemical and hydrogen investments support a rising consumption trend.
Market Segmentations:
By Type
- Heterogeneous
- Homogeneous
By Material
- Metal and metal oxides
- Zeolites
- Chemical compound
By Form
- Powder
- Bead
- Extrudate
- Others
By Geography
- North America
- U.S.
- Canada
- Mexico
- Europe
- Germany
- France
- U.K.
- Italy
- Spain
- Rest of Europe
- Asia Pacific
- China
- Japan
- India
- South Korea
- South-east Asia
- Rest of Asia Pacific
- Latin America
- Brazil
- Argentina
- Rest of Latin America
- Middle East & Africa
- GCC Countries
- South Africa
- Rest of the Middle East and Africa
Competitive Landscape
The competitive landscape of the Chemical Catalyst Market includes global chemical manufacturers, specialized catalyst developers, and technology licensors serving refineries, petrochemical plants, polymer producers, and emission control systems. Companies compete on catalytic efficiency, selectivity, regeneration life, and suitability for complex feedstocks, pushing continuous innovation. Albemarle Corporation, BASF SE, Johnson Matthey, W. R. Grace & Co.-Conn., and Evonik Industries AG invest in metal-based and zeolite catalysts for hydroprocessing, reforming, and cracking units. Haldor Topsoe A/S and LyondellBasell focus on ammonia, methanol, and polymer catalysts supported by proprietary reactor designs and licensing agreements. The Dow Chemical Company and Arkema develop catalysts for specialty chemicals and environmental applications, targeting lower emissions and higher conversion rates. Many players expand technical service offerings, digital reactor monitoring, and catalyst recycling programs to strengthen customer retention. Strategic partnerships with refineries and chemical producers help suppliers build long-term supply contracts and accelerate commercialization of next-generation catalytic systems.
Key Player Analysis
- Evonik Industries AG
- Haldor Topsoe A/S
- Albemarle Corporation
- R. Grace & Co.-Conn.
- Arkema
- Johnson Matthey
- The Dow Chemical Company
- BASF SE
- Haldor Topsoe A/S
- LyondellBasell Industries Holdings B.V.
Recent Developments
- In October 2025, Haldor Topsoe A/S (Topsoe) Chosen to license SynCOR™ technology for a 3,000 MTPD blue methanol plant in Texas. The scope includes Topsoe technology and catalysts.
- In October 2025, Evonik Industries AG Reported a new iridium-palladium bimetallic catalyst system enabling direct ester formation from olefins using CO₂ and green hydrogen.
- In September 2025, Haldor Topsoe A/S (Topsoe) Launched third-generation SiliconTrap™ guard-bed catalysts TK-461 and TK-467 for improved silicon removal in coker naphtha hydrotreating.
Report Coverage
The research report offers an in-depth analysis based on Type, Material, Form and Geography. It details leading market players, providing an overview of their business, product offerings, investments, revenue streams, and key applications. Additionally, the report includes insights into the competitive environment, SWOT analysis, current market trends, as well as the primary drivers and constraints. Furthermore, it discusses various factors that have driven market expansion in recent years. The report also explores market dynamics, regulatory scenarios, and technological advancements that are shaping the industry. It assesses the impact of external factors and global economic changes on market growth. Lastly, it provides strategic recommendations for new entrants and established companies to navigate the complexities of the market.
Future Outlook
- Demand will rise as refineries upgrade hydrotreating and cracking units for cleaner fuels.
- Catalyst use in biofuels, waste-to-chemicals, and circular plastic recycling will accelerate.
- Nano-structured catalysts with higher surface activity will gain wider commercial adoption.
- Digital monitoring and predictive maintenance will extend catalyst life and reduce shutdowns.
- Hydrogen production, green ammonia, and methanol plants will expand catalyst consumption.
- Metal recovery and catalyst recycling programs will grow to lower operating costs.
- Pharmaceutical and specialty chemical companies will adopt more selective and chiral catalysts.
- Catalyst suppliers will increase licensing partnerships with refineries and chemical producers.
- Emerging regions will invest in refinery modernisation and petrochemical capacity expansion.
- Development of low-metal and poison-resistant catalysts will support complex feedstock processing.

Request a Free Sample
Fill in your details and we'll send you a free sample report.
- Sample data tables & charts
- Research methodology
Need a Custom Version of This Report?
Tailor the scope, geography, or segments to your exact requirements.
- Custom geography or segment scope
- Direct access to our analyst team
Frequently Asked Questions
What is the current market size for the Chemical Catalyst Market, and what is its projected size in 2032?
At what Compound Annual Growth Rate is the Chemical Catalyst Market projected to grow between 2025 and 2032?
Which Chemical Catalyst Market segment held the largest share in 2024?
What are the primary factors fueling the growth of the Chemical Catalyst Market?
Who are the leading companies in the Chemical Catalyst Market?
Which region commanded the largest share of the Chemical Catalyst Market in 2024?
Table of Content
Chapter 1 Market Segmentation
- 1.1 Segmentation Framework
- 1.1.1 Product and Service Classification
- 1.1.2 Application and End-Use Classification
- 1.1.3 Technology and Solution Classification
- 1.1.4 Customer and Distribution Channel Classification
- 1.1.5 Geographic Segmentation
- 1.1.6 Market Segment Definitions and Boundaries
Chapter 2 Introduction
- 2.1 Report Objectives and Scope
- 2.2 Product Definition and Industry Terminology
- 2.3 Market Inclusions and Exclusions
- 2.4 Research Process
- 2.4.1 Primary Research and Expert Interviews
- 2.4.2 Secondary Research and Source Review
- 2.4.3 Top-Down and Bottom-Up Estimation
- 2.4.4 Data Triangulation and Verification
- 2.5 Market Size Measurement Basis
- 2.5.1 2024: USD 38,961.04 million → 2032: USD 54,563.85 million
- 2.6 Historical and Forecast Reference Periods
- 2.6.1 Base Year: 2024
- 2.6.2 Forecast Period: 2024-2032
- 2.7 Research Assumptions and Limitations
Chapter 3 Executive Summary
- 3.1 Market Snapshot and Key Findings
- 3.2 Base-Year Market Size, 2024
- 3.3 Forecast Market Size, 2032
- 3.4 Revenue and Volume Growth Outlook
- 3.5 Key Demand and Supply Indicators
- 3.6 Leading Market Segments
- 3.7 Fastest-Growing Market Opportunities
- 3.8 Regional Performance Highlights
- 3.9 Technology and Industry Transformation
- 3.10 Competitive Landscape Summary
- 3.11 Analyst View and Strategic Implications
Chapter 4 Global Chemical Catalyst Market Trends and Developments
- 4.1 Historical Industry Development
- 4.2 Recent Market Trends and Developments
- 4.3 Demand and Customer Behavior Trends
- 4.4 Technology and Product Innovation
- 4.5 Artificial Intelligence, Automation and Digitalization
- 4.6 Local Manufacturing and Supply Chain Realignment
- 4.7 Industry Partnerships, Mergers and Acquisitions
- 4.8 Sustainability and Circular Economy Developments
- 4.9 Government and Private Sector Investment Trends
- 4.10 Emerging Business Models and Commercialization
- 4.11 Industry Developments and Announcements
Chapter 5 Global Chemical Catalyst Market Production, Supply and Demand Analysis
- 5.1 Demand Trend and Consumption Analysis
- 5.2 Demand Forecast, 2024-2032
- 5.3 Production and Output Trend
- 5.4 Production and Output Forecast, 2024-2032
- 5.5 Installed Capacity and Capacity Utilization
- 5.6 Company-Wise Production Plants and Statistics
- 5.6.1 Installed Production Capacity
- 5.6.2 Actual Production
- 5.6.3 Planned Capacity and Expansion Targets
- 5.7 Supply Chain Structure and Procurement Trends
- 5.8 Supply-Demand Gap and Bottlenecks
- 5.9 Import Dependence and Sourcing Structure
- 5.10 Contract Manufacturing and Outsourcing
- 5.11 Regional Supply and Demand Concentration
Chapter 6 Global Chemical Catalyst Market Pricing Analysis
- 6.1 Pricing Structure and Measurement
- 6.2 Historical Pricing Trends
- 6.3 Pricing Outlook, 2024-2032
- 6.4 Average Selling Price and Unit Economics
- 6.5 Pricing by Product and Market Segment
- 6.6 Geographic Pricing Differences
- 6.7 Key Input, Energy, Labor and Logistics Costs
- 6.8 Contract Pricing and Purchasing Models
- 6.9 Pricing Sensitivity and Competitive Positioning
- 6.10 Price, Margin and Profitability Implications
Chapter 7 Global Chemical Catalyst Market Dynamics
- 7.1 Market Growth Drivers
- 7.1.1 Demand-Side Drivers
- 7.1.2 Technology and Innovation Drivers
- 7.1.3 Infrastructure and Investment Drivers
- 7.1.4 Regulatory and Policy Drivers
- 7.2 Market Restraints
- 7.2.1 Cost and Affordability Constraints
- 7.2.2 Technology and Adoption Barriers
- 7.2.3 Supply Chain and Operational Constraints
- 7.3 Market Challenges
- 7.3.1 Competitive Pressure and Margin Erosion
- 7.3.2 Skills, Infrastructure and Implementation Gaps
- 7.4 Emerging Market Opportunities
- 7.5 Market Dynamics Impact and Time-Horizon Assessment
Chapter 8 Global Chemical Catalyst Value Chain Analysis
- 8.1 Industry Value Chain Overview
- 8.2 Upstream Suppliers and Critical Inputs
- 8.3 Technology and Component Providers
- 8.4 Manufacturing or Service Delivery
- 8.5 Distribution, Channel Partners and Integrators
- 8.6 Downstream Applications and End Users
- 8.7 Value Addition and Profit Pools
- 8.8 Vertical Integration and Outsourcing
- 8.9 Supplier Concentration and Risk
- 8.10 Supply Chain Localization and Resilience
Chapter 9 Global Chemical Catalyst Market Regulations and Policies
- 9.1 Relevant Laws, Standards and Compliance Frameworks
- 9.2 Product, Service, Safety and Quality Requirements
- 9.3 Government Policies, Incentives and Subsidies
- 9.4 Imports, Exports and Trade Barriers
- 9.5 Public Procurement and Local Content Requirements
- 9.6 Environmental and Sustainability Compliance
- 9.7 Upcoming Policy Changes and Market Implications
Chapter 10 Global Chemical Catalyst Market Hotspots and Opportunities
- 10.1 Market Opportunity Mapping and Growth Hotspots
- 10.2 High-Growth Applications and Customer Groups
- 10.3 Underserved Markets and White-Space Opportunities
- 10.4 Emerging Technology and Product Opportunities
- 10.5 New Capacity and Investment Hotspots
- 10.6 Market Entry and Expansion Opportunities
- 10.7 Distribution and Partnership Opportunities
- 10.8 Near-Term and Long-Term Commercial Potential
- 10.9 Opportunity Attractiveness and Execution Risks
Chapter 11 Global Chemical Catalyst Market Outlook, 2024-2032
- 11.1 Market Size and Analysis
- 11.1.1 Revenue (Market Measurement: 2024: USD 38,961.04 million → 2032: USD 54,563.85 million)
- 11.1.2 Market Volume and Quantity Sold
- 11.1.3 Historical Market Size
- 11.1.4 Base-Year Market Size, 2024
- 11.2 Market Forecast, 2024-2032
- 11.2.1 Revenue Forecast to 2032
- 11.2.2 Volume Forecast to 2032
- 11.2.3 CAGR and Year-on-Year Growth
- 11.2.4 Incremental Revenue Opportunity
- 11.3 Forecast Assumptions and Scenario Analysis
- 11.3.1 Base-Case Forecast
- 11.3.2 Optimistic and Conservative Scenarios
- 11.3.3 Technology, Pricing and Policy Sensitivities
- 11.4 Market Attractiveness and Growth Outlook
Chapter 12 Global Chemical Catalyst Market Segmentation and Outlook
- 12.1 Segmentation Summary and Market Shares, 2024
- 12.2 Largest and Fastest-Growing Segments
- 12.3 Segment Growth Comparison
- 12.4 Segment Attractiveness and Priority Matrix
Chapter 13 Global Chemical Catalyst Geographic Market Outlook, 2024-2032
- 13.1 Regional Market Size and Share, 2024
- 13.2 Regional Market Forecast, 2024-2032
- 13.3 Regional Pricing, Production and Demand Differences
- 13.4 North America
- 13.4.1 United States
- 13.4.2 Canada
- 13.4.3 Mexico
- 13.5 Europe
- 13.5.1 Germany
- 13.5.2 France
- 13.5.3 Italy
- 13.5.4 United Kingdom
- 13.5.5 Spain
- 13.5.6 Poland
- 13.5.7 Russia
- 13.5.8 Netherlands
- 13.5.9 Belgium
- 13.5.10 Sweden
- 13.5.11 Denmark
- 13.5.12 Norway
- 13.5.13 Rest of Europe
- 13.6 Asia Pacific
- 13.6.1 China
- 13.6.2 India
- 13.6.3 Japan
- 13.6.4 South Korea
- 13.6.5 Thailand
- 13.6.6 Indonesia
- 13.6.7 Vietnam
- 13.6.8 Malaysia
- 13.6.9 Australia
- 13.6.10 Rest of Asia Pacific
- 13.7 Latin America
- 13.7.1 Brazil
- 13.7.2 Argentina
- 13.7.3 Colombia
- 13.7.4 Chile
- 13.7.5 Rest of Latin America
- 13.8 Middle East
- 13.8.1 Saudi Arabia
- 13.8.2 United Arab Emirates
- 13.8.3 Turkey
- 13.8.4 Israel
- 13.8.5 Iran
- 13.8.6 Rest of the Middle East
- 13.9 Africa
- 13.9.1 South Africa
- 13.9.2 Egypt
- 13.9.3 Nigeria
- 13.9.4 Morocco
- 13.9.5 Rest of Africa
- 13.10 Regional Investment, Policy and Supply Chain Differences
- 13.11 Regional Competitive Landscape
- 13.12 Geographic Growth Hotspots
Chapter 14 Global Chemical Catalyst Technology, Innovation and Sustainability Outlook
- 14.1 Technology Landscape and Maturity
- 14.2 Product, Process and Service Innovation
- 14.3 AI, Automation and Digital Tools in the Industry
- 14.4 Technology Adoption and Performance Benchmarking
- 14.5 Innovation Pipeline and R&D Investment
- 14.6 Patent and Intellectual Property Trends
- 14.7 Energy Efficiency and Resource Management
- 14.8 Sustainability, Recycling and Circularity
- 14.9 Technology Roadmap, 2024-2032
- 14.10 Risks of Obsolescence and Technology Substitution
Chapter 15 Global Chemical Catalyst Market Key Strategic Imperatives
- 15.1 Growth and Market Entry Priorities
- 15.2 High-Return Products and Segments
- 15.3 Pricing, Profitability and Cost Optimization
- 15.4 Technology Investment and Product Differentiation
- 15.5 Supply Chain Localization and Resilience
- 15.6 Distribution and Customer Acquisition
- 15.7 Partnership, Acquisition and Capacity Strategy
- 15.8 Regional Expansion Priorities
- 15.9 Short-, Medium- and Long-Term Actions
Chapter 16 Competition Outlook
- 16.1 Industry Competition Characteristics
- 16.2 Market Structure and Concentration
- 16.3 Market Share and Competitive Positioning, 2024
- 16.4 Company-Wise Revenue and Product Benchmarking
- 16.5 Production and Service Capacity Benchmarking
- 16.6 Technology, Pricing and Differentiation
- 16.7 Regional Footprint and Distribution Strength
- 16.8 Mergers, Acquisitions and Strategic Alliances
- 16.9 New Entrants and Competitive Threats
- 16.10 Porter's Five Forces and Industry Attractiveness
- 16.11 Competitive Outlook, 2024-2032
Chapter 17 Company Profiles
- 17.1 Company Coverage and Selection Criteria
- 17.2 Leading Market Participants – Standard Profile Structure
- 17.2.1 Business Description
- 17.2.2 Company Ownership and Geographic Presence
- 17.2.3 Product and Service Portfolio
- 17.2.4 Manufacturing and Operating Footprint
- 17.2.5 Production Capacity and Expansion Plans
- 17.2.6 Financial Performance and Investment
- 17.2.7 Market Share and Competitive Position
- 17.2.8 Technology and Innovation Capabilities
- 17.2.9 Strategic Alliances or Partnerships
- 17.2.10 Recent Developments
- 17.2.11 Growth Strategy and Outlook
- 17.3 Other Relevant Market Participants
Note: Every listed company is profiled on the structure shown under the first company. The company list is preliminary and may change based on research findings, market developments, data availability and client requirements.
Chapter 18 Disclaimer
- 18.1 Research and Forecast Disclaimer
- 18.2 Data Source and Estimation Limitations
Note: The depth of individual sections depends on data availability for this market. Volume, capacity, trade and other unit-based metrics are included where applicable.

