Market Overview
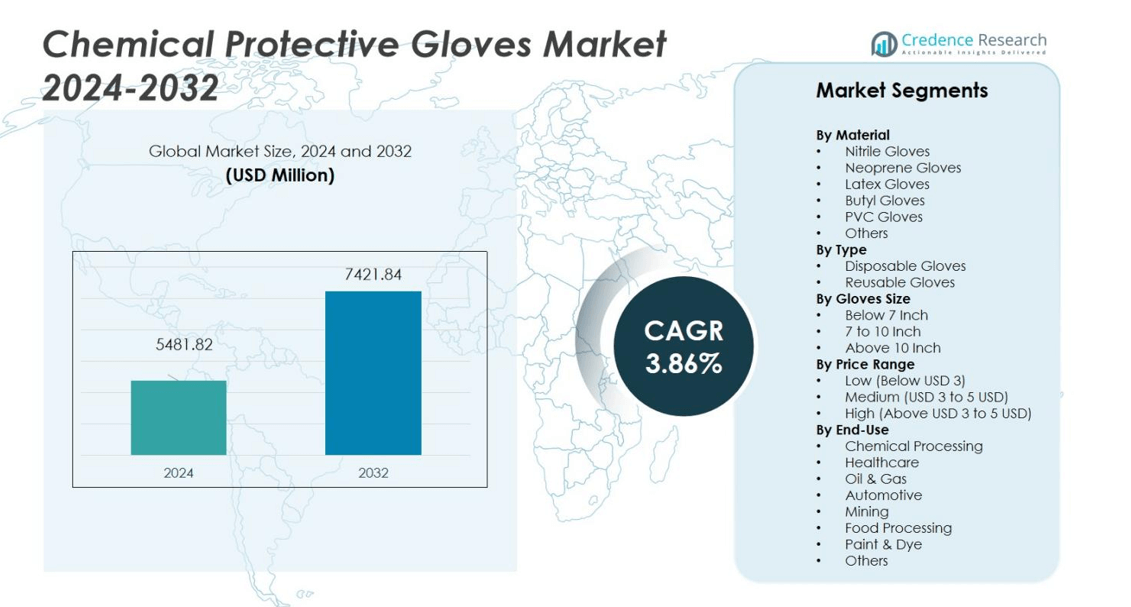
The Chemical Protective Gloves Market was valued at USD 5481.82 million in 2024 and is anticipated to reach USD 7421.84 million by 2032, at a CAGR of 3.86% during the forecast period.
| REPORT ATTRIBUTE | DETAILS |
|---|---|
| Historical Period | 2020-2023 |
| Base Year | 2024 |
| Forecast Period | 2025-2032 |
| Chemical Protective Gloves Market Size 2024 | USD 5481.82 million |
| Chemical Protective Gloves Market, CAGR | 3.86% |
| Chemical Protective Gloves Market Size 2032 | USD 7421.84 million |
The chemical protective gloves market, major players such as Ansell Ltd., Honeywell International Inc., and the 3M Company lead through robust product portfolios and global distribution networks. These firms prioritise advanced material development and ergonomic design, reinforcing their strategic positions across key end use industries. Regionally, North America commands a dominant share of 41% in the global market, underpinned by strict regulatory frameworks and high adoption of premium protective solutions. This regional leadership highlights not only market maturity but also the capacity of leading companies to leverage innovation and regulatory compliance to sustain growth.
Market Insights
- The Chemical Protective Gloves Market was valued at USD 5,481.82 million in 2024 and is expected to reach USD 7,421.84 million by 2032, growing at a CAGR of 3.86% during the forecast period.
- Rising health and safety regulations globally are driving demand for chemical protective gloves, particularly in industries like healthcare, manufacturing, and oil & gas, where worker protection from hazardous chemicals is critical.
- Key market trends include sustainability initiatives with increased use of biodegradable and recyclable materials, as well as the adoption of smart gloves featuring chemical exposure sensors.
- The competitive landscape is marked by key players like Ansell Ltd., Honeywell International Inc., and the 3M Company, who dominate with innovations and strong distribution networks. Smaller players focus on niche segments and regional demand.
- North America holds a 41% market share in 2024, leading in both production and consumption, followed by Europe, which captures 30% of the market share.
Market Segmentation Analysis:
By Material
The nitrile gloves sub‑segment dominates the material category, capturing 29.8% of revenue in 2025. Nitrile gloves are preferred for their excellent chemical resistance, puncture resistance, and durability compared to other materials, making them ideal for industries like chemical processing, healthcare, and manufacturing. The continuous improvement in nitrile formulations, which enhance comfort and performance, is driving its widespread adoption, particularly in environments requiring protection from hazardous chemicals. This dominance is further supported by growing global safety awareness and stringent regulations that prioritize worker protection.
- For instance, Hartalega's COATS® (Colloidal Oatmeal System) nitrile gloves feature a patented coating technology utilizing FDA-recognized colloidal oatmeal to provide enhanced barrier protection and ergonomic comfort.
By Type
The disposable gloves segment leads the market with 63.2% share in 2025. Disposable gloves are crucial in high‑risk sectors like healthcare, food processing, and laboratories, where hygiene and contamination control are paramount. Their widespread use is driven by convenience, cost‑effectiveness, and compliance with health and safety standards that recommend one‑time use to minimize cross‑contamination risks. The growing demand for personal protective equipment (PPE) in pandemic preparedness and industrial safety further fuels the expansion of disposable gloves in these sectors.
- For instance, Radians, a prominent PPE manufacturer, launched 14 styles of powder-free disposable gloves to address growing demands for protective gear across healthcare and industrial markets.
By Gloves Size
The 7-to-10-inch size category holds the largest share, 41.2% in 2025. This size range is the most commonly used by adults in industrial, laboratory, and chemical handling environments. It strikes an ideal balance between protection and dexterity, making it suitable for a wide variety of applications, from general industry to healthcare. As businesses focus on ergonomics and regulatory compliance, the 7-to-10-inch size remains the preferred choice for many industries, ensuring broad adoption and continued growth in this segment.
Key Growth Drivers
Rising Health and Safety Regulations
Stringent health and safety regulations are a major driver for the growth of the chemical protective gloves market. Increasing awareness of worker protection and the risks associated with chemical exposure has led to the implementation of more rigorous safety standards. Governments and industries across the globe are enforcing regulations that mandate the use of protective gloves, especially in high-risk sectors like healthcare, manufacturing, and chemical processing. This regulatory push is fueling demand for high-quality, reliable chemical protective gloves to ensure worker safety and compliance.
- For instance, 3M’s chemical protective gloves adhere to rigorous use and care standards to ensure ongoing protection, emphasizing compliance with safety protocols for workers in high-risk environments.
Growth in Industrial and Chemical Applications
The demand for chemical protective gloves is growing significantly due to the expansion of industries such as manufacturing, chemicals, and oil & gas. As industrial activities increase globally, there is a rising need for personal protective equipment (PPE) to safeguard workers from chemical hazards, including exposure to toxic, flammable, or corrosive substances. The growing adoption of automated systems in chemical plants and increased investments in the chemical industry are driving the market for protective gloves, where safety remains a priority in production processes and labor-intensive tasks.
- For instance, Honeywell has developed chemical resistant gloves with high protection against acids and solvents, widely used in automotive, chemical, and safety industries to prevent burns and allergies.
Rising Awareness About Hygiene and Safety
The heightened awareness of hygiene and safety, particularly post-pandemic, is driving the growth of the chemical protective gloves market. Industries like healthcare, food processing, and pharmaceuticals are increasingly focused on maintaining hygienic standards to protect workers from contamination and reduce infection risks. This shift in mindset has expanded the demand for gloves not only in healthcare settings but also across industrial sectors. As global hygiene standards become more stringent, the need for chemical protective gloves in a variety of applications continues to rise, driving market growth.
Key Trends & Opportunities
Increased Adoption of Sustainable Materials
One of the emerging trends in the chemical protective gloves market is the growing shift toward sustainable materials. With increased consumer and regulatory focus on environmental sustainability, manufacturers are exploring eco-friendly alternatives to traditional glove materials like latex and nitrile. The adoption of biodegradable, recyclable, or plant-based materials, such as compostable gloves or those made from recycled plastics, is gaining momentum. This trend not only appeals to environmentally conscious consumers but also aligns with government initiatives to reduce plastic waste and promote circular economies, presenting an opportunity for manufacturers to differentiate themselves in the market.
- For instance, INTCO Medical offers biodegradable nitrile gloves containing organic additives that enable them to decompose into natural compounds like methane and carbon dioxide after disposal, without compromising performance in medical and industrial applications.
Technological Advancements in Glove Manufacturing
Technological advancements in the production of chemical protective gloves are opening new opportunities in the market. Innovations in glove materials, such as improved chemical resistance, better comfort, and enhanced durability, are making gloves more effective and user-friendly. Additionally, the introduction of smart gloves, integrated with sensors to monitor exposure to harmful chemicals, offers a significant growth opportunity. These advancements in manufacturing processes and product offerings are driving the demand for next-generation chemical protective gloves, particularly in industries that require high-performance safety equipment.
- For instance, SHOWA introduced its Eco Best Technology® gloves that enhance both biodegradability and chemical protection, reflecting a focus on sustainability and advanced material science.
Key Challenges
Latex Allergy Concerns
Despite its widespread use, latex gloves pose a significant challenge in the market due to the growing concerns over latex allergies. This condition can cause severe reactions among workers who are sensitive to natural rubber latex, limiting the usage of latex gloves in certain industries. Although alternatives like nitrile gloves have mitigated this issue, the ongoing need for allergen-free options continues to drive innovation in glove materials. As demand for hypoallergenic and latex-free gloves increases, manufacturers must adapt to meet diverse consumer requirements while ensuring product safety and performance.
Supply Chain Disruptions
The chemical protective gloves market faces significant challenges due to supply chain disruptions, particularly in the wake of global events such as the COVID-19 pandemic. The increased demand for PPE during the crisis caused delays and shortages in glove production and distribution. Ongoing supply chain instability, caused by raw material shortages, transportation bottlenecks, and geopolitical factors, continues to affect glove manufacturers. This uncertainty in supply chains can lead to price volatility, reduced production capacity, and difficulties in meeting the rising demand for protective gloves in various sectors.
Regional Analysis
North America
The region accounts for a 41% market share in the global chemical protective gloves market as of 2024. Industries such as chemicals, oil & gas, and manufacturing maintain rigorous safety protocols under regulations like OSHA and ANSI, driving strong demand. The U.S. leads in both production and consumption, supported by high industrial activity and innovation in glove materials. Suppliers deploy advanced glove technologies and customised solutions to meet stringent safety needs. With ongoing pressure for worker protection and compliance, North America remains the largest region in this market.
Europe
Europe holds more than 30% of the global market share in 2024. The region’s strong industrial base including chemicals, automotive, and manufacturing and strict PPE standards (EN, ISO) underpin demand for chemical protective gloves. Germany, the UK, and France are key markets with well‑developed supply chains and high safety standards. Growth in Europe is driven by industrial safety regulation and increasing replacement of legacy glove materials with higher‑performance innovations. The region remains a stable, mature segment for glove manufacturers.
Asia Pacific
Asia Pacific represents 23% of global revenue in 2024 and exhibits the highest growth potential across regions. Rapid industrialisation in China, India, South Korea, and Southeast Asia expands manufacturing, chemical processing, and infrastructure activities-all of which increase glove demand. Market growth is fueled by rising worker safety awareness, regulatory improvement, and capacity expansion in local production. The dual role as a consumption and export hub positions Asia Pacific as a critical region for future market expansion.
Latin America
Latin America contributes over 5% of the global market share according to 2024 data. The region’s growth is supported by increased industrial diversification, expansion of chemical and food‑processing sectors, and rising regulation of workplace safety. Brazil, Argentina, and Colombia are showing above‑average growth as companies upgrade protective‑glove procurement. While size remains smaller than developed regions, Latin America offers emerging opportunities for glove manufacturers targeting mid‑tier demand and improved compliance.
Middle East & Africa
Middle East & Africa account for about 2% of the global market share in 2024. Demand arises from oil & gas, mining, heavy industry, and infrastructure projects, especially in Gulf‑Cooperation Council (GCC) countries. Although the region’s base is small, growing regulatory enforcement and increasing awareness of chemical‑hazard risks support future potential. Manufacturers may find opportunities through partnerships and localisation in this under‑penetrated region.
Market Segmentations:
By Material
- Nitrile Gloves
- Neoprene Gloves
- Latex Gloves
- Butyl Gloves
- PVC Gloves
- Others
By Type
- Disposable Gloves
- Reusable Gloves
By Gloves Size
- Below 7 Inch
- 7 to 10 Inch
- Above 10 Inch
By Price Range
- Low (Below USD 3)
- Medium (USD 3 to 5 USD)
- High (Above USD 3 to 5 USD)
By End-Use
- Chemical Processing
- Healthcare
- Oil & Gas
- Automotive
- Mining
- Food Processing
- Paint & Dye
- Others
By Region
- North America
- U.S.
- Canada
- Mexico
- Europe
- Germany
- France
- U.K.
- Italy
- Spain
- Rest of Europe
- Asia Pacific
- China
- Japan
- India
- South Korea
- South-east Asia
- Rest of Asia Pacific
- Latin America
- Brazil
- Argentina
- Rest of Latin America
- Middle East & Africa
- GCC Countries
- South Africa
- Rest of the Middle East and Africa
Competitive Landscape
The competitive landscape of the chemical protective gloves market is driven by prominent players such as Ansell Ltd., Honeywell International Inc., The 3M Company, Magid Glove & Safety Manufacturing Company, and SHOWA GROUP. These industry leaders maintain a strong market position through continuous innovation, extensive product portfolios, and global reach. They invest in advanced glove technologies, such as improved chemical resistance, durability, and comfort, to meet the growing safety standards across various industries. Additionally, these companies focus on strategic initiatives like acquisitions, partnerships, and expansions to enhance their distribution networks and production capabilities. Smaller players compete by offering specialized or region-specific products, catering to niche markets with custom solutions. With increasing regulatory demands, sustainability trends, and rising awareness of worker safety, companies in the market are also emphasizing environmentally friendly materials and eco-conscious manufacturing processes. As a result, competitive strategies are shifting towards product differentiation, innovation, and customer-centric approaches to maintain market leadership.
Key Player Analysis
- The W.W. Grainger, Inc.
- Ansell Ltd.
- Uvex Safety (Uvex Group)
- Newell Brands (Mapa Professional)
- Superior Glove
- Honeywell International, Inc.
- Lakeland Industries, Inc.
- The 3M Company
- SHOWA GROUP
- Magid Glove & Safety Manufacturing Company LLC.
Recent Developments
- In July 2024, Ansell Limited completed the acquisition of Kimberly-Clark Corporation's Personal Protective Equipment business, expanding its market presence and enhancing its product portfolio to meet the diverse needs of customers across various industries.
- In February 2024, Ansell introduced the MICROFLEX® Mega Texture 93-256, a new nitrile disposable glove tailored for industrial workers, providing superior protection against chemicals, oils, grime, and carcinogens.
- In January 2024, Kimberly-Clark Professional™ launched Kimtech™ Polaris™ Nitrile Gloves, a breakthrough in laboratory safety and comfort, designed to meet the rigorous demands of scientists in high‑performance work environments.
Report Coverage
The research report offers an in-depth analysis based on Material, Type, Gloves Size, Price Range, End Use and Region. It details leading market players, providing an overview of their business, product offerings, investments, revenue streams, and key applications. Additionally, the report includes insights into the competitive environment, SWOT analysis, current market trends, as well as the primary drivers and constraints. Furthermore, it discusses various factors that have driven market expansion in recent years. The report also explores market dynamics, regulatory scenarios, and technological advancements that are shaping the industry. It assesses the impact of external factors and global economic changes on market growth. Lastly, it provides strategic recommendations for new entrants and established companies to navigate the complexities of the market.
Future Outlook
- Demand will rise as workplace safety regulations strengthen globally.
- Adoption will increase in emerging industries such as chemicals, pharmaceuticals, and oil & gas.
- Growth in reusable gloves will accelerate as cost‑effectiveness and sustainability become more important.
- Innovations in materials will deliver gloves with enhanced chemical resistance, durability and comfort.
- Sustainable glove materials biodegradable or recycled will gain traction among manufacturers and users.
- Regional growth will shift toward Asia‑Pacific and Latin America due to industrialisation and rising safety awareness.
- Customisation and application‑specific gloves (e.g., for novel chemicals or micro‑electronics) will drive niche demand.
- Digital solutions such as sensor‑embedded gloves or smart monitoring will open new value propositions.
- Supply‑chain resilience and local manufacturing will become key competitive advantages.
- Cost pressures from raw‑material volatility and inflation will push manufacturers toward efficiency and premium product tiers.

Request a Free Sample
Fill in your details and we'll send you a free sample report.
- Sample data tables & charts
- Research methodology
Need a Custom Version of This Report?
Tailor the scope, geography, or segments to your exact requirements.
- Custom geography or segment scope
- Direct access to our analyst team
Frequently Asked Questions
What is the current market size for the Chemical Protective Gloves Market, and what is its projected size in 2032?
At what Compound Annual Growth Rate is the Chemical Protective Gloves Market projected to grow between 2025 and 2032?
Which Chemical Protective Gloves Market segment held the largest share in 2024?
What are the primary factors fueling the growth of the Chemical Protective Gloves Market?
Who are the leading companies in the Chemical Protective Gloves Market?
Which region commanded the largest share of the Chemical Protective Gloves Market in 2024?
Table of Content
Chapter 1 Market Segmentation
- 1.1 Segmentation Framework
- 1.1.1 Product and Service Classification
- 1.1.2 Application and End-Use Classification
- 1.1.3 Technology and Solution Classification
- 1.1.4 Customer and Distribution Channel Classification
- 1.1.5 Geographic Segmentation
- 1.1.6 Market Segment Definitions and Boundaries
Chapter 2 Introduction
- 2.1 Report Objectives and Scope
- 2.2 Product Definition and Industry Terminology
- 2.3 Market Inclusions and Exclusions
- 2.4 Research Process
- 2.4.1 Primary Research and Expert Interviews
- 2.4.2 Secondary Research and Source Review
- 2.4.3 Top-Down and Bottom-Up Estimation
- 2.4.4 Data Triangulation and Verification
- 2.5 Market Size Measurement Basis
- 2.5.1 2024: USD 5481.82 million → 2032: USD 7421.84 million
- 2.6 Historical and Forecast Reference Periods
- 2.6.1 Base Year: 2024
- 2.6.2 Forecast Period: 2024-2032
- 2.7 Research Assumptions and Limitations
Chapter 3 Executive Summary
- 3.1 Market Snapshot and Key Findings
- 3.2 Base-Year Market Size, 2024
- 3.3 Forecast Market Size, 2032
- 3.4 Revenue and Volume Growth Outlook
- 3.5 Key Demand and Supply Indicators
- 3.6 Leading Market Segments
- 3.7 Fastest-Growing Market Opportunities
- 3.8 Regional Performance Highlights
- 3.9 Technology and Industry Transformation
- 3.10 Competitive Landscape Summary
- 3.11 Analyst View and Strategic Implications
Chapter 4 Global Chemical Protective Gloves Market Trends and Developments
- 4.1 Historical Industry Development
- 4.2 Recent Market Trends and Developments
- 4.3 Demand and Customer Behavior Trends
- 4.4 Technology and Product Innovation
- 4.5 Artificial Intelligence, Automation and Digitalization
- 4.6 Local Manufacturing and Supply Chain Realignment
- 4.7 Industry Partnerships, Mergers and Acquisitions
- 4.8 Sustainability and Circular Economy Developments
- 4.9 Government and Private Sector Investment Trends
- 4.10 Emerging Business Models and Commercialization
- 4.11 Industry Developments and Announcements
Chapter 5 Global Chemical Protective Gloves Market Production, Supply and Demand Analysis
- 5.1 Demand Trend and Consumption Analysis
- 5.2 Demand Forecast, 2024-2032
- 5.3 Production and Output Trend
- 5.4 Production and Output Forecast, 2024-2032
- 5.5 Installed Capacity and Capacity Utilization
- 5.6 Company-Wise Production Plants and Statistics
- 5.6.1 Installed Production Capacity
- 5.6.2 Actual Production
- 5.6.3 Planned Capacity and Expansion Targets
- 5.7 Supply Chain Structure and Procurement Trends
- 5.8 Supply-Demand Gap and Bottlenecks
- 5.9 Import Dependence and Sourcing Structure
- 5.10 Contract Manufacturing and Outsourcing
- 5.11 Regional Supply and Demand Concentration
Chapter 6 Global Chemical Protective Gloves Market Pricing Analysis
- 6.1 Pricing Structure and Measurement
- 6.2 Historical Pricing Trends
- 6.3 Pricing Outlook, 2024-2032
- 6.4 Average Selling Price and Unit Economics
- 6.5 Pricing by Product and Market Segment
- 6.6 Geographic Pricing Differences
- 6.7 Key Input, Energy, Labor and Logistics Costs
- 6.8 Contract Pricing and Purchasing Models
- 6.9 Pricing Sensitivity and Competitive Positioning
- 6.10 Price, Margin and Profitability Implications
Chapter 7 Global Chemical Protective Gloves Market Dynamics
- 7.1 Market Growth Drivers
- 7.1.1 Demand-Side Drivers
- 7.1.2 Technology and Innovation Drivers
- 7.1.3 Infrastructure and Investment Drivers
- 7.1.4 Regulatory and Policy Drivers
- 7.2 Market Restraints
- 7.2.1 Cost and Affordability Constraints
- 7.2.2 Technology and Adoption Barriers
- 7.2.3 Supply Chain and Operational Constraints
- 7.3 Market Challenges
- 7.3.1 Competitive Pressure and Margin Erosion
- 7.3.2 Skills, Infrastructure and Implementation Gaps
- 7.4 Emerging Market Opportunities
- 7.5 Market Dynamics Impact and Time-Horizon Assessment
Chapter 8 Global Chemical Protective Gloves Value Chain Analysis
- 8.1 Industry Value Chain Overview
- 8.2 Upstream Suppliers and Critical Inputs
- 8.3 Technology and Component Providers
- 8.4 Manufacturing or Service Delivery
- 8.5 Distribution, Channel Partners and Integrators
- 8.6 Downstream Applications and End Users
- 8.7 Value Addition and Profit Pools
- 8.8 Vertical Integration and Outsourcing
- 8.9 Supplier Concentration and Risk
- 8.10 Supply Chain Localization and Resilience
Chapter 9 Global Chemical Protective Gloves Market Regulations and Policies
- 9.1 Relevant Laws, Standards and Compliance Frameworks
- 9.2 Product, Service, Safety and Quality Requirements
- 9.3 Government Policies, Incentives and Subsidies
- 9.4 Imports, Exports and Trade Barriers
- 9.5 Public Procurement and Local Content Requirements
- 9.6 Environmental and Sustainability Compliance
- 9.7 Upcoming Policy Changes and Market Implications
Chapter 10 Global Chemical Protective Gloves Market Hotspots and Opportunities
- 10.1 Market Opportunity Mapping and Growth Hotspots
- 10.2 High-Growth Applications and Customer Groups
- 10.3 Underserved Markets and White-Space Opportunities
- 10.4 Emerging Technology and Product Opportunities
- 10.5 New Capacity and Investment Hotspots
- 10.6 Market Entry and Expansion Opportunities
- 10.7 Distribution and Partnership Opportunities
- 10.8 Near-Term and Long-Term Commercial Potential
- 10.9 Opportunity Attractiveness and Execution Risks
Chapter 11 Global Chemical Protective Gloves Market Outlook, 2024-2032
- 11.1 Market Size and Analysis
- 11.1.1 Revenue (Market Measurement: 2024: USD 5481.82 million → 2032: USD 7421.84 million)
- 11.1.2 Market Volume and Quantity Sold
- 11.1.3 Historical Market Size
- 11.1.4 Base-Year Market Size, 2024
- 11.2 Market Forecast, 2024-2032
- 11.2.1 Revenue Forecast to 2032
- 11.2.2 Volume Forecast to 2032
- 11.2.3 CAGR and Year-on-Year Growth
- 11.2.4 Incremental Revenue Opportunity
- 11.3 Forecast Assumptions and Scenario Analysis
- 11.3.1 Base-Case Forecast
- 11.3.2 Optimistic and Conservative Scenarios
- 11.3.3 Technology, Pricing and Policy Sensitivities
- 11.4 Market Attractiveness and Growth Outlook
Chapter 12 Global Chemical Protective Gloves Market Segmentation and Outlook
- 12.1 Segmentation Summary and Market Shares, 2024
- 12.2 Largest and Fastest-Growing Segments
- 12.3 Segment Growth Comparison
- 12.4 Segment Attractiveness and Priority Matrix
Chapter 13 Global Chemical Protective Gloves Geographic Market Outlook, 2024-2032
- 13.1 Regional Market Size and Share, 2024
- 13.2 Regional Market Forecast, 2024-2032
- 13.3 Regional Pricing, Production and Demand Differences
- 13.4 North America
- 13.4.1 United States
- 13.4.2 Canada
- 13.4.3 Mexico
- 13.5 Europe
- 13.5.1 Germany
- 13.5.2 France
- 13.5.3 Italy
- 13.5.4 United Kingdom
- 13.5.5 Spain
- 13.5.6 Poland
- 13.5.7 Russia
- 13.5.8 Netherlands
- 13.5.9 Belgium
- 13.5.10 Sweden
- 13.5.11 Denmark
- 13.5.12 Norway
- 13.5.13 Rest of Europe
- 13.6 Asia Pacific
- 13.6.1 China
- 13.6.2 India
- 13.6.3 Japan
- 13.6.4 South Korea
- 13.6.5 Thailand
- 13.6.6 Indonesia
- 13.6.7 Vietnam
- 13.6.8 Malaysia
- 13.6.9 Australia
- 13.6.10 Rest of Asia Pacific
- 13.7 Latin America
- 13.7.1 Brazil
- 13.7.2 Argentina
- 13.7.3 Colombia
- 13.7.4 Chile
- 13.7.5 Rest of Latin America
- 13.8 Middle East
- 13.8.1 Saudi Arabia
- 13.8.2 United Arab Emirates
- 13.8.3 Turkey
- 13.8.4 Israel
- 13.8.5 Iran
- 13.8.6 Rest of the Middle East
- 13.9 Africa
- 13.9.1 South Africa
- 13.9.2 Egypt
- 13.9.3 Nigeria
- 13.9.4 Morocco
- 13.9.5 Rest of Africa
- 13.10 Regional Investment, Policy and Supply Chain Differences
- 13.11 Regional Competitive Landscape
- 13.12 Geographic Growth Hotspots
Chapter 14 Global Chemical Protective Gloves Technology, Innovation and Sustainability Outlook
- 14.1 Technology Landscape and Maturity
- 14.2 Product, Process and Service Innovation
- 14.3 AI, Automation and Digital Tools in the Industry
- 14.4 Technology Adoption and Performance Benchmarking
- 14.5 Innovation Pipeline and R&D Investment
- 14.6 Patent and Intellectual Property Trends
- 14.7 Energy Efficiency and Resource Management
- 14.8 Sustainability, Recycling and Circularity
- 14.9 Technology Roadmap, 2024-2032
- 14.10 Risks of Obsolescence and Technology Substitution
Chapter 15 Global Chemical Protective Gloves Market Key Strategic Imperatives
- 15.1 Growth and Market Entry Priorities
- 15.2 High-Return Products and Segments
- 15.3 Pricing, Profitability and Cost Optimization
- 15.4 Technology Investment and Product Differentiation
- 15.5 Supply Chain Localization and Resilience
- 15.6 Distribution and Customer Acquisition
- 15.7 Partnership, Acquisition and Capacity Strategy
- 15.8 Regional Expansion Priorities
- 15.9 Short-, Medium- and Long-Term Actions
Chapter 16 Competition Outlook
- 16.1 Industry Competition Characteristics
- 16.2 Market Structure and Concentration
- 16.3 Market Share and Competitive Positioning, 2024
- 16.4 Company-Wise Revenue and Product Benchmarking
- 16.5 Production and Service Capacity Benchmarking
- 16.6 Technology, Pricing and Differentiation
- 16.7 Regional Footprint and Distribution Strength
- 16.8 Mergers, Acquisitions and Strategic Alliances
- 16.9 New Entrants and Competitive Threats
- 16.10 Porter's Five Forces and Industry Attractiveness
- 16.11 Competitive Outlook, 2024-2032
Chapter 17 Company Profiles
- 17.1 Company Coverage and Selection Criteria
- 17.2 Leading Market Participants – Standard Profile Structure
- 17.2.1 Business Description
- 17.2.2 Company Ownership and Geographic Presence
- 17.2.3 Product and Service Portfolio
- 17.2.4 Manufacturing and Operating Footprint
- 17.2.5 Production Capacity and Expansion Plans
- 17.2.6 Financial Performance and Investment
- 17.2.7 Market Share and Competitive Position
- 17.2.8 Technology and Innovation Capabilities
- 17.2.9 Strategic Alliances or Partnerships
- 17.2.10 Recent Developments
- 17.2.11 Growth Strategy and Outlook
- 17.3 Other Relevant Market Participants
Note: Every listed company is profiled on the structure shown under the first company. The company list is preliminary and may change based on research findings, market developments, data availability and client requirements.
Chapter 18 Disclaimer
- 18.1 Research and Forecast Disclaimer
- 18.2 Data Source and Estimation Limitations
Note: The depth of individual sections depends on data availability for this market. Volume, capacity, trade and other unit-based metrics are included where applicable.