
Chromatography Instrumentation Market Overview:
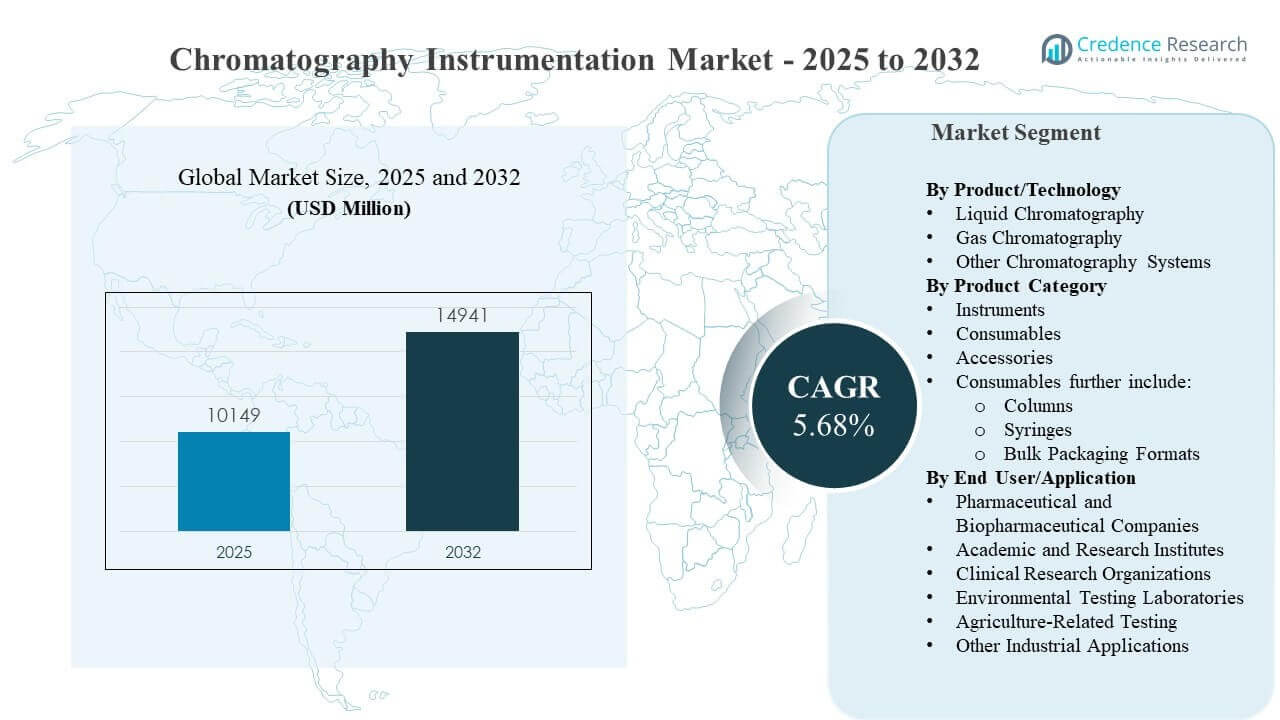
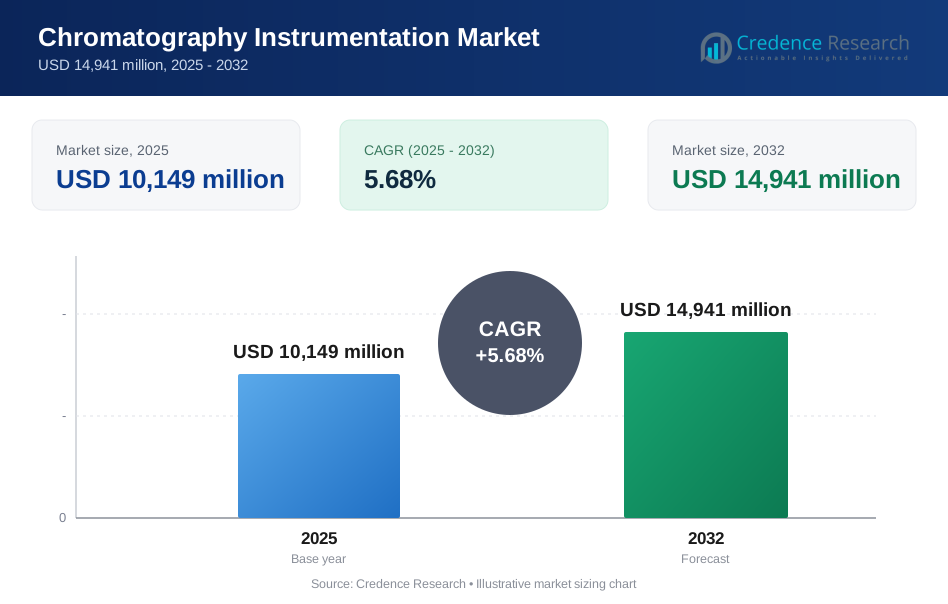
The global Chromatography Instrumentation Market size was estimated at USD 10,149 million in 2025 and is expected to reach USD 14,941 million by 2032, growing at a CAGR of 5.68% from 2025 to 2032. Demand is primarily driven by expanding quality-control intensity across pharmaceutical and biopharmaceutical manufacturing, where chromatographic testing remains central to release, stability, impurity profiling, and method validation. Accelerating adoption of advanced separation workflows in regulated laboratories and higher sample throughput requirements across research and industrial testing continue to reinforce replacement and upgrade cycles for chromatography platforms.
| REPORT ATTRIBUTE | DETAILS |
|---|---|
| Historical Period | 2020-2024 |
| Base Year | 2025 |
| Forecast Period | 2026-2032 |
| Chromatography Instrumentation Market Size 2025 | USD 10,149 million |
| Chromatography Instrumentation Market, CAGR | 5.68% |
| Chromatography Instrumentation Market Size 2032 | USD 14,941 million |
Key Market Trends & Insights
- The Chromatography Instrumentation Market is projected to expand at 5.68% CAGR during 2025–2032, moving from USD 10,149 million (2025) to USD 14,941 million (2032).
- North America accounted for 33.6% of Chromatography Instrumentation Market revenue in 2025, reflecting high regulated-lab density and strong instrument service ecosystems.
- Liquid Chromatography held 46.9% share in 2025, supported by broad use in high-sensitivity separations and LC-linked analytical workflows.
- Pharmaceutical and Biopharmaceutical Companies represented 52.6% of demand in 2025, driven by QC throughput and compliance-led test volumes.
- Asia Pacific captured 28.4% share in 2025, reflecting expanding pharma manufacturing capacity and rising testing intensity across multiple industries.
Segment Analysis
Chromatography Instrumentation Market segmentation indicates strong demand concentration in regulated testing environments where repeatability, traceability, and validated method performance drive procurement. Instrument buyers increasingly evaluate total cost of ownership across uptime, service responsiveness, consumable compatibility, and qualification support. Workflow integration also matters because laboratories aim to standardize platforms across multiple sites for consistent data quality. Higher sample volumes in pharma quality systems and growing analytical complexity increase the need for robust LC and GC configurations.
Chromatography Instrumentation Market purchasing behavior typically favors vendors that combine instruments, software ecosystems, and consumables that simplify method transfer and compliance documentation. Consumables adoption is shaped by method-specific requirements and validated column chemistries that determine separation performance. End users also value training, application support, and preventive maintenance programs to protect productivity. These factors reinforce long-term supplier relationships, especially for multi-instrument installed bases in manufacturing and contract testing laboratories.
By Product/Technology Insights
Liquid Chromatography accounted for the largest share of 46.9% in 2025. Liquid Chromatography leadership reflects broad applicability across pharmaceutical QC, biologics characterization, impurity profiling, and multi-analyte separations requiring high resolution. Liquid Chromatography systems also align well with evolving detection configurations that raise sensitivity and shorten time-to-result. Standardization of validated LC methods across sites supports repeat procurement of compatible platforms and service coverage that reduces operational variability.
By Product Category Insights
Chromatography Instrumentation Market demand across product categories is shaped by different replacement cycles and budget structures across laboratories. Instruments are typically purchased through capex planning that prioritizes throughput, compliance readiness, and uptime. Consumables create recurring spend tied to sample volumes, validated methods, and column lifecycle management. Accessories complement both categories by supporting sample introduction, fluidics stability, and day-to-day operational reliability in high-throughput environments.
By End User/Application Insights
Pharmaceutical and Biopharmaceutical Companies accounted for the largest share of 52.6% in 2025. Pharmaceutical and Biopharmaceutical Companies lead due to continuous QC testing requirements across raw materials, in-process controls, finished products, and stability programs. Regulatory expectations reinforce consistent analytical documentation and method performance, which increases reliance on qualified chromatography systems. High sample throughput and low tolerance for downtime strengthen adoption of service-backed platforms and standardized workflows across manufacturing networks.
Chromatography Instrumentation Market Drivers
Expanding pharmaceutical and biopharmaceutical quality-control throughput
Chromatography Instrumentation Market growth is closely linked to the rising intensity of analytical testing across pharmaceutical and biopharmaceutical production. Release testing, stability protocols, impurity profiling, and method validation create persistent demand for robust chromatography workflows. As drug pipelines diversify, laboratories require flexible separation performance across small molecules, complex mixtures, and challenging matrices. Manufacturing scale-up increases sample throughput, raising the need for uptime-focused systems and dependable maintenance. These factors push laboratories toward platform standardization and regular upgrade cycles.
Rising analytical complexity and method performance requirements
Chromatography Instrumentation Market demand increases as analytical complexity rises across regulated and industrial laboratories. More stringent specifications for detection limits, resolution, and reproducibility require stable fluidics, precise temperature control, and consistent column performance. Method transfer across sites raises expectations for instrument-to-instrument comparability and audit-ready documentation. Laboratories also seek improved automation to reduce human error and rework. Continuous emphasis on data integrity and traceability elevates the role of compliance-friendly instrumentation and qualification support.
Broadening industrial testing across environment, food, and agriculture
Chromatography Instrumentation Market expansion is reinforced by growing testing requirements outside pharma, including environmental monitoring and agriculture-related testing. Regulatory oversight and customer specifications increase routine measurement of contaminants, residues, and trace-level compounds. Wider test adoption raises demand for reliable instruments that can operate with diverse sample matrices and variable workloads. Many laboratories prioritize systems with application breadth and scalable configurations for different methods. This supports steady demand across both research-driven and compliance-driven testing programs.
- For instance, Shimadzu demonstrated a method using the Nexera UHPLC and LCMS-8040 for quantitation of 210 commonly analyzed pesticides in food samples, where limits of detection for 90% of compounds were below 0.001 mg/kg and calibration coefficients were typically above 0.997
Installed-base replacement and service-driven purchasing behavior
Chromatography Instrumentation Market growth also reflects ongoing replacement of aging installed bases in laboratories that prioritize uptime and long-term cost control. Instrument fleets in regulated environments are often refreshed to improve reliability and reduce unplanned downtime. Preventive maintenance and qualification services influence vendor selection because service responsiveness protects productivity. Standardized fleet strategies simplify training, method transfer, and spare parts planning across sites. Recurring service relationships also encourage ecosystem stickiness around compatible consumables and accessories.
- For instance, Agilent states that after LC system repairs, partial qualification testing can be performed only on the affected module or component, reducing the time the instrument is out of service, and the process is documented through an Equipment Qualification Report generated within its electronic ACE workflow.
Chromatography Instrumentation Market Challenges
Chromatography Instrumentation Market adoption can be constrained by high upfront capex for advanced systems and the operational costs tied to qualification, calibration, and maintenance. Budget cycles in academic and public laboratories can delay fleet upgrades even when analytical needs increase. Procurement complexity also rises when laboratories must align instruments, consumables, and service coverage under strict compliance requirements. Workforce constraints in method development and troubleshooting can slow adoption of higher-complexity systems. These factors can extend decision timelines and increase vendor evaluation rigor.
Chromatography Instrumentation Market buyers also face challenges related to method transfer variability, consumable qualification, and instrument-to-instrument comparability across multi-site operations. Differences in consumable availability, lead times, and local service capacity can disrupt standardized workflows. Managing data integrity expectations adds process overhead through documentation, validation, and change control. Instrument downtime creates significant productivity losses in high-throughput QC environments. As a result, laboratories prioritize robust support models, yet service quality can vary by geography and partner networks.
- For instance, Agilent’s 1290 Infinity LC is designed to operate across flow rates of 0.05 to 5 mL/min and pressures up to 1,200 bar, with detector data collection rates up to 160 Hz and pump control supporting 1,200 bar up to 2 mL/min before reducing to 800 bar at 5 mL/min; this broad operating envelope helps method transfer across column formats and workflows, but it also means multi-site users must tightly manage method settings, consumable standardization, and service consistency to maintain comparability.
Chromatography Instrumentation Market Trends and Opportunities
Chromatography Instrumentation Market trends increasingly emphasize smarter instrumentation that reduces setup variability and improves first-pass success rates for routine workflows. Laboratories value features that stabilize connections, reduce leaks, and simplify maintenance because these improvements lower rework and extend uptime. Workflow simplification supports broader adoption in high-volume environments that run standardized methods. Opportunities also expand where vendors provide strong application support for emerging analytes and complex matrices. These dynamics favor suppliers that combine instruments with guided workflows and reliable service programs.
- For instance, Waters’ Alliance iS HPLC System is designed to reduce human errors by up to 40% based on the company’s 2022 survey of 56 global pharma QC labs running more than 25 systems, while also offering sample carryover of less than or equal to 0.002%, maximum operating pressure of 12,000 psi, flow-rate capability from 0.001 to 10.000 mL/min, and RFID-enabled column tracking to improve setup consistency and uptime.
Chromatography Instrumentation Market opportunity is rising in harmonized platform strategies across global laboratory networks, where organizations aim to standardize systems to streamline method transfer and compliance documentation. Expansion of contract research and contract testing creates additional demand for scalable fleets and high-throughput configurations. Buyers increasingly seek predictable operating performance and faster turnaround times for regulated testing. Consumables optimization and validated column portfolios remain central to productivity. These trends create opportunities for vendors that bundle instruments, consumables, and service under integrated commercial models.
Regional Insights
North America
North America accounted for 33.6% of Chromatography Instrumentation Market revenue in 2025. North America demand is supported by high concentration of pharmaceutical and biopharmaceutical manufacturing, strong clinical and industrial testing ecosystems, and mature compliance frameworks. Laboratory networks in North America typically prioritize uptime, qualification support, and standardized workflows that reduce rework. Higher installed-base density supports recurring service demand and consistent replacement cycles. These factors keep North America positioned as a leading revenue contributor.
Europe
Europe captured 25.8% of Chromatography Instrumentation Market revenue in 2025. Europe benefits from established pharmaceutical manufacturing, chemical testing, and environmental monitoring capabilities across multiple countries. The region shows strong adoption of regulated analytical workflows and well-developed laboratory infrastructure. Europe procurement decisions often emphasize method robustness, documentation readiness, and lifecycle service coverage. Stable industrial testing requirements reinforce steady demand across both instruments and recurring consumables.
Asia Pacific
Asia Pacific represented 28.4% of Chromatography Instrumentation Market revenue in 2025. Asia Pacific demand is driven by expanding pharmaceutical production capacity, increasing analytical testing intensity, and broader adoption of quality systems across multiple industries. Growing laboratory networks in Asia Pacific also increase demand for scalable fleets and standardized methods across sites. Rising environmental and food safety testing contributes additional volume demand. These factors support sustained growth and strengthen the region’s contribution to global revenues.
Latin America
Latin America accounted for 7.1% of Chromatography Instrumentation Market revenue in 2025. Latin America demand is shaped by growth in generics manufacturing, food and beverage quality programs, and expanding environmental compliance testing. Laboratory investment tends to focus on pragmatic throughput improvements and platform reliability. Adoption is also influenced by local service coverage and consumable availability. These dynamics support gradual penetration increases across regulated and industrial testing environments.
Middle East & Africa
Middle East & Africa held 5.1% of Chromatography Instrumentation Market revenue in 2025. Middle East & Africa demand is supported by gradual expansion in food safety, petrochemical testing, and public health laboratory capacity. Many buyers prioritize durable platforms and dependable service support due to varied operating environments. Investment is often concentrated in national reference laboratories and large industrial operators. These factors contribute to steady growth from a smaller base.
Competitive Landscape
Chromatography Instrumentation Market competition is defined by platform performance, reliability, and ecosystem depth across instruments, consumables, software, and services. Vendors differentiate through application breadth, compliance-ready workflows, service responsiveness, and global support coverage for regulated laboratories. Portfolio strength across LC and GC, combined with validated consumable availability, influences long-term customer retention. Pricing strategies frequently reflect total cost of ownership positioning through service and consumables bundling. Competitive intensity remains high in pharmaceutical QC environments where switching costs can be meaningful.
Agilent Technologies positioning in the Chromatography Instrumentation Market is anchored in broad chromatography portfolios and workflow integration spanning instruments, software, and consumables. Agilent Technologies focus on productivity and method reliability aligns with demand from regulated laboratories that prioritize uptime and repeatability. Agilent Technologies also benefits from installed-base service models that support predictable lifecycle management for multi-instrument fleets. Agilent Technologies competitiveness is reinforced by application support depth that helps laboratories shorten method development cycles and standardize performance across sites.
The industry research and growth report includes detailed analyses of the competitive landscape of the market and information about key companies, including:
- Agilent Technologies
- Thermo Fisher Scientific
- Waters Corporation
- Shimadzu Corporation
- Merck KGaA
- Sartorius AG
- Bio-Rad Laboratories
- PerkinElmer
- Cytiva
- Pall Corporation
- Restek Corporation
- Phenomenex
- Gilson
- JASCO
- GL Sciences
- SCION Instruments
- Knauer
- Biotage
- YMC
Qualitative and quantitative analysis of companies has been conducted to help clients understand the wider business environment as well as the strengths and weaknesses of key industry players. Data is qualitatively analyzed to categorize companies as pure play, category-focused, industry-focused, and diversified; it is quantitatively analyzed to categorize companies as dominant, leading, strong, tentative, and weak.
Recent Developments
- In April 2026, Merck completed the acquisition of JSR Life Sciences’ chromatography business, expanding its downstream purification offering with next-generation Protein A chromatography technologies.
- In October 2025, Merck announced a definitive agreement to acquire the chromatography business of JSR Life Sciences, a move intended to strengthen its downstream processing portfolio with Protein A chromatography capabilities for biopharmaceutical manufacturing.
- In February 2025, KNAUER Wissenschaftliche Geräte GmbH and Labomatic Instruments AG announced a strategic cooperation to combine their complementary liquid chromatography portfolios, allowing both companies to offer each other’s systems and related service support to customers.
- In January 2025, Shimadzu Corporation launched seven new Brevis GC-2050 gas chromatograph systems for green transformation applications, including configurations such as automatic gas analysis, thermal desorption, pyrolysis analysis, and headspace sampler systems.
Report Scope
| Report Attribute | Details |
| Market size value in 2025 | USD 10149 million |
| Revenue forecast in 2032 | USD 14941 million |
| Growth rate (CAGR) | 5.68% (2025–2032) |
| Base year | 2025 |
| Forecast period | 2026-2032 |
| Quantitative units | USD million |
| Segments covered | By Product/Technology Outlook: Liquid Chromatography, Gas Chromatography, Other Chromatography Systems; By Product Category Outlook: Instruments, Consumables (Columns, Syringes, Bulk Packaging Formats), Accessories; By End User/Application Outlook: Pharmaceutical and Biopharmaceutical Companies, Academic and Research Institutes, Clinical Research Organizations, Environmental Testing Laboratories, Agriculture-Related Testing, Other Industrial Applications |
| Regional scope | North America, Europe, Asia Pacific, Latin America, Middle East & Africa |
| Key companies profiled | Agilent Technologies; Thermo Fisher Scientific; Waters Corporation; Shimadzu Corporation; Merck KGaA; Sartorius AG; Bio-Rad Laboratories; PerkinElmer; Cytiva; Pall Corporation; Restek Corporation; Phenomenex; Gilson; JASCO; GL Sciences; SCION Instruments; Knauer; Biotage; YMC |
| No. of Pages | 332 |
Segmentation
By Product/Technology
- Liquid Chromatography
- Gas Chromatography
- Other Chromatography Systems
By Product Category
- Instruments
- Consumables
- Accessories
- Consumables further include:
- Columns
- Syringes
- Bulk Packaging Formats
By End User/Application
- Pharmaceutical and Biopharmaceutical Companies
- Academic and Research Institutes
- Clinical Research Organizations
- Environmental Testing Laboratories
- Agriculture-Related Testing
- Other Industrial Applications
By Region
- North America
- U.S.
- Canada
- Mexico
- Europe
- Germany
- France
- U.K.
- Italy
- Spain
- Rest of Europe
- Asia Pacific
- China
- Japan
- India
- South Korea
- South-east Asia
- Rest of Asia Pacific
- Latin America
- Brazil
- Argentina
- Rest of Latin America
- Middle East & Africa
- GCC Countries
- South Africa
- Rest of the Middle East and Africa
Request a Free Sample
Fill in your details and we'll send you a free sample report.
- Sample data tables & charts
- Research methodology
Need a Custom Version of This Report?
Tailor the scope, geography, or segments to your exact requirements.
- Custom geography or segment scope
- Direct access to our analyst team
Frequently Asked Questions
What is the market size and forecast for the Chromatography Instrumentation Market?
What is the CAGR for the Chromatography Instrumentation Market?
Which segment leads the Chromatography Instrumentation Market by product/technology?
What factors are driving growth in the Chromatography Instrumentation Market?
Who are the leading companies in the Chromatography Instrumentation Market?
Which region leads the Chromatography Instrumentation Market?
Table of Content
Chapter 1. Report Introduction
- 1.1 Report Description & Purpose
- 1.1.1 Report Title & Market Definition
- 1.1.2 Unique Selling Propositions (USP) & Key Differentiators
- 1.1.3 Value Proposition for Stakeholders
- 1.2 Research Objectives
- 1.2.1 Market Sizing Objectives (Volume & Revenue)
- 1.2.2 Segmentation Objectives
- 1.2.3 Competitive Intelligence Objectives
- 1.2.4 Forecast & Scenario Objectives
- 1.3 Report Scope
- 1.3.1 Chromatography Instrumentation Scope – Types & Subtypes Covered
- 1.3.2 Geographic Scope – Regions & Countries Covered
- 1.3.3 Historical Period, Base Year & Forecast Period (2025; forecast to 2032)
- 1.3.4 Inclusions & Exclusions
- 1.4 HS Code & Classification Framework
- 1.5 Currency, Units & Pricing Basis
- 1.6 Target Stakeholders
- 1.7 Limitations & Assumptions
Chapter 2. Executive Summary
- 2.1 Global Chromatography Instrumentation Market Snapshot
- 2.1.1 Market Size – Historical (2025) & Forecast (2025-2032) (2025: USD 10,149 million → 2032: USD 14,941 million)
- 2.1.2 Volume & Revenue – Global Totals
- 2.1.3 Key Market Highlights – Top Five Facts
- 2.2 Chromatography Instrumentation Market Segmentation Snapshot
- 2.2.1 Market Split by Region – 2025 vs. 2032
- 2.3 Competitive Snapshot
- 2.3.1 Top 10 Players by Revenue Share – 2025
- 2.3.2 Top 10 Players by Volume Share – 2025
- 2.3.3 Recent Strategic Developments (18-Month Summary)
- 2.4 Key Investment Highlights & Strategic Conclusions
Chapter 3. Chromatography Instrumentation Market Dynamics & Industry Analysis
- 3.1 Market Overview & Context
- 3.1.1 Chromatography Instrumentation Market Position in the Broader Automotive Value Chain
- 3.1.2 OEM vs. Replacement Market Dynamics
- 3.1.3 Market Maturity & Development Stage by Region
- 3.2 Chromatography Instrumentation Market Drivers
- 3.3 Chromatography Instrumentation Market Restraints & Challenges
- 3.4 Chromatography Instrumentation Market Opportunities
- 3.5 Porter's Five Forces Analysis
- 3.5.1 Threat of New Entrants
- 3.5.2 Bargaining Power of Suppliers
- 3.5.3 Bargaining Power of Buyers
- 3.5.4 Threat of Substitutes
- 3.5.5 Competitive Rivalry – Intensity Assessment
- 3.6 Chromatography Instrumentation Value Chain Analysis
- 3.6.1 Upstream – Raw Material/Input Suppliers
- 3.6.1.1 Raw Material/Input 1
- 3.6.1.2 Raw Material/Input 2
- 3.6.1.3 Raw Material/Input 3
- 3.6.2 Midstream – Production/Manufacturing/Service Delivery
- 3.6.2.1 Production/Process Overview
- 3.6.2.2 Key Facility Locations & Capacity by Manufacturer
- 3.6.3 Downstream – Distribution & End Consumer
- 3.6.3.1 Primary Channel – B2B/OEM
- 3.6.3.2 Secondary Channels – Dealer, Retail, Online, Direct
- 3.6.4 Value Chain Profitability Analysis
- 3.6.1 Upstream – Raw Material/Input Suppliers
- 3.7 PESTEL Analysis
- 3.7.1 Political Factors
- 3.7.2 Economic Factors
- 3.7.3 Social Factors
- 3.7.4 Technological Factors
- 3.7.5 Environmental Factors
- 3.7.6 Legal Factors
- 3.8 Chromatography Instrumentation Supply Chain Analysis
- 3.8.1 Raw Material/Input Supply Risk Assessment
- 3.8.2 Manufacturing Concentration Risk (Geographic Exposure)
- 3.8.3 Trade Disruption Impact Analysis
- 3.9 Regulatory & Policy Landscape
Note: The regulatory and policy landscape section covers regulations based on their applicability to the market, Chromatography Instrumentation category, geography, and scope of the study. Only regulatory frameworks with a material impact on operations, compliance, trade, sustainability, or market access are analyzed in detail.
Chapter 4. Key Investment Pockets & Opportunity Analysis
- 4.1 Chromatography Instrumentation Market Attractiveness Analysis
- 4.1.1 By Region – Investment Attractiveness Matrix (Volume × CAGR)
- 4.2 Absolute Revenue Growth Opportunity
- 4.2.1 By Region – Absolute USD Growth Through 2032
- 4.3 Incremental Volume Opportunity
- 4.3.1 By Region – Incremental Volume Through 2032
- 4.3.2 Segment – Incremental Volume
- 4.4 Emerging Submarket Opportunity Deep Dive (Subject to Applicability)
- 4.5 Emerging Market Opportunity Scorecards
- 4.5.1 United States
- 4.5.2 Europe
- 4.5.3 Asia
- 4.5.4 Middle East & Africa
Note: Emerging Market Opportunity Scorecards will be included based on relevance and strategic importance. Regions listed are indicative and may vary depending on data availability and market dynamics.
Chapter 5. Chromatography Instrumentation Import-Export Analysis & Trade Flows
- 5.1 Global Trade Overview
- 5.1.1 Global Export Value by Country (2025)
- 5.1.2 Global Export Volume by Country (2025)
- 5.1.3 Global Import Value by Country (2025)
- 5.1.4 Global Import Volume by Country (2025)
- 5.1.5 Net Trade Balance by Country (2025)
- 5.2 Export Analysis – Segment
- 5.2.1 Type 1 (HS Code)
- 5.2.2 Type 2 (HS Code)
- 5.2.3 Type 3 (HS Code)
- 5.2.4 Type 4 (HS Code)
- 5.2.5 Type 5 (HS Code)
- 5.3 Import Analysis – Segment
- 5.3.1 Type 1 (HS Code)
- 5.3.2 Type 2 (HS Code)
- 5.3.3 Type 3 (HS Code)
- 5.3.4 Type 4 (HS Code)
- 5.3.5 Type 5 (HS Code)
- 5.4 Average Unit Trade Prices
- 5.4.1 Average Export Price – Segment & Country
- 5.4.2 Average Import Price – Segment & Source Country
- 5.4.3 Price Trends (2025)
- 5.5 Key Trade Route Analysis
- 5.5.1 Trade Route 1
- 5.5.2 Trade Route 2
- 5.5.3 Trade Route 3
- 5.5.4 Trade Route 4
- 5.5.5 Trade Route 5
- 5.6 Trade Policy Impact Assessment
- 5.6.1 US Anti-Dumping & Section 301 Tariffs
- 5.6.2 EU Customs Union Impact
- 5.6.3 Major Free Trade Agreements
- 5.6.4 USMCA Rules of Origin
Note: Trade policy analysis will be included only where relevant to the Chromatography Instrumentation market.
Chapter 6. Competitive Landscape & Company Benchmarking
- 6.1 Chromatography Instrumentation Market Concentration & Structure
- 6.1.1 Herfindahl-Hirschman Index (HHI) – vs. 2025
- 6.1.2 Tier 1, Tier 2 & Tier 3 Market Structure
- 6.1.3 Global, Regional & Local Player Dynamics
- 6.2 Chromatography Instrumentation Market Share Analysis – 2025
- 6.2.1 Global Revenue Share by Company
- 6.2.2 Global Volume Share by Company
- 6.2.3 Regional Revenue Share
- 6.2.4 Market Share Evolution ( vs. 2025)
- 6.2.5 OEM Segment Share by Company
- 6.2.6 Replacement Segment Share by Company
- 6.3 Production/Delivery Capacity & Facility Analysis
- 6.3.1 Global Installed Capacity
- 6.3.2 Capacity Utilization Rates
- 6.3.3 Production/Output Volume
- 6.3.4 Facility Locations & Capacity Map
- 6.3.5 Planned Capacity Additions
- 6.4 Chromatography Instrumentation Competitive Benchmarking Matrix
- 6.4.1 Revenue, Volume, CAGR & Profitability Comparison
- 6.4.2 Channel Revenue Mix
- 6.4.3 Geographic Revenue Exposure
- 6.4.4 R&D Intensity
- 6.4.5 Sustainability Maturity
- 6.5 Strategic Developments in Chromatography Instrumentation (Last 24 Months)
- 6.5.1 Mergers, Acquisitions & Divestments
- 6.5.2 New Chromatography Instrumentation Launches
- 6.5.3 Facility Expansions
- 6.5.4 Strategic Alliances, Joint Ventures & Partnerships
- 6.5.5 Distribution Expansion & Market Entry
- 6.5.6 Sustainability & ESG Initiatives
- 6.6 Competitive Strategy Mapping
- 6.6.1 Leader, Challenger, Follower & Niche Classification
- 6.6.2 Pricing Strategy Comparison
- 6.6.3 Channel Strategy Matrix
Note: Strategic developments are included based on their materiality and the availability of reliable information.
Chapter 7. Global Chromatography Instrumentation Market – By Distribution Channel
- 7.1 Segment Overview
- 7.1.1 Volume & Revenue Split by Channel (2025 & 2032)
- 7.1.2 Channel Mix Evolution (2025-2032)
Chapter 8. Regional Market Analysis – Global Overview
- 8.1 Global Regional Overview
- 8.1.1 Regional Volume Share
- 8.1.2 Regional Revenue Share
- 8.1.3 Regional Volume by Region
- 8.1.4 Regional Revenue by Region
- 8.1.5 Regional Forecast Through 2032
- 8.2 Cross-Regional Segment Analysis
- 8.2.1 By Distribution Channel
- 8.2.2 By Brand/Price Tier
Chapter 9. North America Chromatography Instrumentation Market
- 9.1 United States
- 9.2 Canada
- 9.3 Mexico
Chapter 10. Europe Chromatography Instrumentation Market
- 10.1 Germany
- 10.2 France
- 10.3 Italy
- 10.4 United Kingdom
- 10.5 Spain
- 10.6 Poland
- 10.7 Russia
- 10.8 Netherlands
- 10.9 Belgium
- 10.10 Sweden
- 10.11 Denmark
- 10.12 Norway
- 10.13 Rest of Europe
Chapter 11. Asia Pacific Chromatography Instrumentation Market
- 11.1 China
- 11.2 India
- 11.3 Japan
- 11.4 South Korea
- 11.5 Thailand
- 11.6 Indonesia
- 11.7 Vietnam
- 11.8 Malaysia
- 11.9 Australia
- 11.10 Rest of Asia Pacific
Chapter 12. Latin America Chromatography Instrumentation Market
- 12.1 Brazil
- 12.2 Argentina
- 12.3 Colombia
- 12.4 Chile
- 12.5 Rest of Latin America
Chapter 13. Middle East Chromatography Instrumentation Market
- 13.1 Saudi Arabia
- 13.2 United Arab Emirates
- 13.3 Turkey
- 13.4 Israel
- 13.5 Iran
- 13.6 Rest of the Middle East
Chapter 14. Africa Chromatography Instrumentation Market
- 14.1 South Africa
- 14.2 Egypt
- 14.3 Nigeria
- 14.4 Morocco
- 14.5 Rest of Africa
Chapter 15. Chromatography Instrumentation Company Profiles
- 15.1 [Company 01]
- 15.1.1 Company Overview
- 15.1.2 Key Management Personnel
- 15.1.3 Products & Services Portfolio
- 15.1.4 Financial Performance
- 15.1.5 Key Market Focus & Geographic Presence
- 15.1.6 Recent Developments & Strategic Initiatives
Note: The company profile list is preliminary and may change based on research findings, market developments, data availability, and client requirements.
Chapter 16. Appendices
- Appendix A – List of Abbreviations & Acronyms
- Appendix B – Industry Classification Code Reference – Full Series
- Appendix C – Production & Capacity Data Tables
- Appendix D – End-Use & Demand Base Tables
- Appendix E – Consumption & Replacement Rate Assumptions
- Appendix F – ASP Reference Tables
- Appendix G – Manufacturing & Facility Database
- Appendix H – Import-Export Data Tables
- Appendix I – Regulatory Summary Tables
- Appendix J – Primary Research Participant List (Anonymized)
- Appendix K – Primary Research Questionnaire Framework
- Appendix L – Data Sources & Bibliography
- Appendix M – Market Size Divergence & Source Comparison
Chapter 17. Research Methodology
- 17.1 Research Framework & Philosophy
- 17.2 Secondary Research – Sources, Hierarchy & Data Extraction
- 17.3 Data Modeling – Bottom-Up & Top-Down Market Sizing
- 17.4 Primary Research – Stakeholder Framework, LOI & Sample Sizes
- 17.5 Forecast Methodology – Regression, Scenario & Sensitivity Analysis
- 17.6 Quality Control – Four-Layer Validation Framework
- 17.7 Limitations & Standard Assumptions
- 17.8 Disclaimer
