
Market Overview
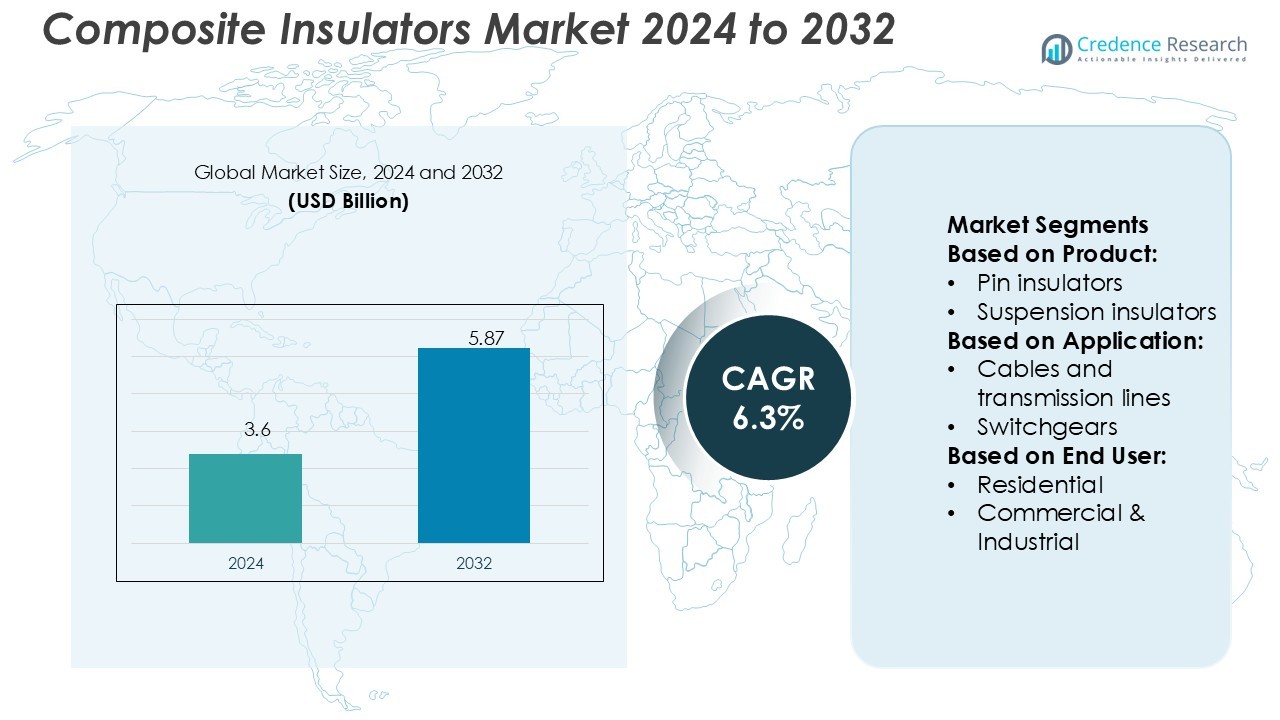
Composite Insulators Market size was valued USD 3.6 billion in 2024 and is anticipated to reach USD 5.87 billion by 2032, at a CAGR of 6.3% during the forecast period.
| REPORT ATTRIBUTE | DETAILS |
|---|---|
| Historical Period | 2020-2023 |
| Base Year | 2024 |
| Forecast Period | 2025-2032 |
| Composite Insulators Market Size 2024 | USD 3.6 Billion |
| Composite Insulators Market, CAGR | 6.3% |
| Composite Insulators Market Size 2032 | USD 5.87 Billion |
The composite insulators market is shaped by leading companies such as Kuvag, ENSTO, Hitachi Energy, CYG Insulator, Hubbell, Izoelektro, Gipro, Nanjing Electric Technology, Deccan Enterprises, and CTC Insulator. These players focus on advanced material technologies, smart grid compatibility, and performance-driven product designs to strengthen their market positions. Strategic investments in R&D, regional expansion, and sustainable manufacturing give them a competitive edge. Asia Pacific leads the global market with a 36% share, supported by rapid grid expansion, urbanization, and large-scale electrification initiatives. Strong demand from renewable energy projects further reinforces the region’s dominance in the composite insulators industry.
Market Insights
- The Composite Insulators Market was valued at USD 3.6 billion in 2024 and is expected to reach USD 5.87 billion by 2032, growing at a CAGR of 6.3%.
- Rising demand for renewable energy and grid modernization is driving the need for advanced insulation solutions in transmission and distribution systems.
- Growing adoption of lightweight and hydrophobic materials is shaping market trends, with major players focusing on product innovation and sustainable manufacturing.
- Asia Pacific holds a 36% share, leading the market due to large-scale electrification projects, while suspension insulators remain the dominant product segment with a 43% share.
- Intense competition among key players and high initial investment costs pose restraints, but strategic R&D, regional expansion, and renewable integration continue to create strong growth opportunities globally.
Market Segmentation Analysis:
By Product
Suspension insulators dominate the market with a 43% share due to their high mechanical strength and reliability in high-voltage applications. These insulators perform well in harsh weather conditions and heavy load environments, making them ideal for long-span transmission lines. Their modular design allows easy replacement and extended service life. Manufacturers focus on improving hydrophobicity and resistance to contamination to enhance performance. For example, composite suspension insulators with advanced silicone rubber sheaths provide better flashover resistance and reduced maintenance needs compared to traditional porcelain insulators.
- For instance, Ensto's product page for the SDI52.282 lists a creepage distance of 1,280 mm. Creepage distance is the shortest path along the surface of an insulator between two conducting parts, which is crucial for preventing flashovers in polluted conditions.
By Application
Cables and transmission lines account for the largest share at 48%, driven by increasing power demand and grid expansion. Composite insulators are used extensively in overhead lines to improve insulation performance and minimize leakage current. Their lightweight and high tensile strength make installation faster and more cost-efficient. Advanced polymer materials help reduce line losses and ensure consistent performance in polluted environments. Utilities are adopting these insulators to enhance grid stability and meet rising electrification targets, particularly in developing economies with rapid infrastructure growth.
- For instance, Hitachi Energy offers hollow composite insulators rated from 72 kV AC up to 1,200 kV AC (and 1,100 kV DC) in lengths up to 15 m, using HTV (high temperature vulcanized) silicone rubber materials.
By End User
Utilities lead the market with a 56% share, supported by large-scale power transmission and distribution investments. These organizations prefer composite insulators due to their long service life, superior weather resistance, and low maintenance costs. High-voltage substations and transmission lines rely on these insulators to improve system reliability and reduce outage risks. Utilities are increasingly replacing porcelain and glass units with composite alternatives to enhance performance and reduce operational expenses. This shift aligns with modernization goals and growing renewable energy integration into national grids.
Key Growth Drivers
Expansion of Power Transmission Infrastructure
Rising investments in power grid expansion drive composite insulator adoption. Governments and utilities are modernizing transmission networks to meet growing electricity demand. Composite insulators offer superior performance in high-voltage and harsh environmental conditions, making them ideal for long-distance lines. Their lightweight structure lowers installation and maintenance costs compared to traditional porcelain units. Rapid electrification in emerging economies supports strong demand. For example, large-scale transmission projects in India and China are increasing composite insulator deployment to improve power reliability and reduce operational downtime.
- For instance, Hubbell offers a T001A station post insulator (Electro Composites series) rated for 15.5 kV class, with 110 kV BIL, compressive strength 33,000 lb, tensile strength 5,500 lb, and cantilever bending strength 3,000 lb.
Rising Renewable Energy Integration
The growing integration of renewable energy sources boosts the need for advanced transmission systems. Wind and solar farms often operate in challenging environments that require durable and weather-resistant insulators. Composite insulators provide excellent hydrophobicity and pollution resistance, ensuring consistent performance. Utilities prefer these solutions to minimize line losses and improve efficiency. Expanding renewable capacity across Asia Pacific, North America, and Europe increases demand for grid modernization. This shift creates sustained opportunities for manufacturers offering reliable, lightweight, and high-strength insulators.
- For instance, Izoelektro’s NKI composite tension/suspension insulators are designed for overhead lines up to 52 kV, with a specified mechanical load (SML) of 90 kN and a maximum torsion load of 50 Nm.
Advancements in Material Technology
Ongoing innovations in polymer and silicone rubber materials enhance product durability and performance. Modern composite insulators feature superior resistance to UV radiation, contamination, and mechanical stress. Improved hydrophobic coatings extend service life and reduce maintenance needs. These technological improvements support lower lifecycle costs and greater reliability in power networks. Manufacturers are investing in R&D to create insulators suited for extreme climates. For example, advanced polymer composites can withstand higher voltages and reduce flashover risks, strengthening their position over traditional alternatives.
Key Trends & Opportunities
Shift Toward Smart Grid Modernization
Global grid modernization initiatives create new opportunities for composite insulator deployment. Utilities are upgrading outdated networks with intelligent monitoring systems that demand reliable insulation. Composite insulators support flexible installation and integrate easily with digital grid components. Their strong performance in compact and high-voltage networks aligns with smart grid goals. As countries push for reliable, efficient, and low-loss transmission systems, demand for these insulators grows. This trend also encourages collaborations between manufacturers and grid technology providers to enhance system compatibility.
- For instance, GIPRO manufactures pantograph insulators using cycloaliphatic cast resin. Its 25 kV isoFLEX pantograph insulator is certified to NF F 16-101 and NF F 16-102 standards.
Growing Preference for Lightweight and Eco-Friendly Solutions
The industry is witnessing a shift toward lightweight, sustainable products. Composite insulators weigh significantly less than porcelain, reducing transportation costs and installation time. Their lower environmental impact aligns with global sustainability targets and corporate ESG commitments. Manufacturers are focusing on recyclable materials and low-emission production processes. This trend is gaining traction in regions investing heavily in clean energy and green infrastructure. The adoption of eco-friendly insulation solutions positions companies competitively in both developed and emerging markets.
- For instance, Nanjing Electric reports a long-rod composite insulator production capacity > 1.3 million pieces (converted to 110 kV equivalents). Its manufacturing line includes > 20 sets of kneading, open-mill, and rubber extruder machines.
Rising Demand from Emerging Economies
Emerging economies in Asia, Africa, and Latin America offer strong growth potential. Governments are expanding rural electrification programs and upgrading transmission lines to support industrialization. Composite insulators’ cost-efficiency, durability, and easy handling make them ideal for large-scale deployment. Infrastructure projects in these regions create steady demand for long-lasting and reliable insulation products. Companies focusing on local manufacturing and affordable product lines are well-positioned to capture this opportunity and strengthen their market presence.
Key Challenges
High Initial Cost and Investment Barriers
Although composite insulators offer long-term cost benefits, their initial purchase price is higher than traditional materials. Utilities and smaller power companies with limited budgets may delay replacement or modernization plans. High upfront investment remains a key barrier in price-sensitive markets. The lack of financial incentives in some regions further slows adoption. Manufacturers need to address cost concerns through flexible pricing models, local production, or value-added services to improve affordability and boost market penetration.
Performance Concerns in Extreme Conditions
While composite insulators perform well in most environments, their long-term performance in extreme climates remains a challenge. Issues like erosion, aging, and tracking under severe pollution or UV exposure can reduce reliability. In some cases, utilities remain cautious about fully replacing porcelain systems. This creates hesitation in adopting newer technologies at scale. Continuous testing, standardization, and improved material coatings are necessary to address these concerns and build stronger confidence among end users and regulatory bodies.
Regional Analysis
North America
North America holds a 27% share of the composite insulators market, supported by grid modernization and renewable integration projects. The U.S. and Canada are investing in advanced transmission networks to enhance energy reliability and efficiency. Utilities are replacing traditional porcelain units with composite insulators due to their lightweight structure, superior weather resistance, and lower maintenance costs. High investments in offshore wind and solar power also boost demand. Manufacturers are focusing on durable and hydrophobic designs to meet performance standards. Strategic collaborations between utilities and technology providers strengthen the region’s position as a mature and stable market.
Europe
Europe accounts for a 24% market share, driven by strong regulatory support for sustainable grid infrastructure. Countries such as Germany, France, and the U.K. are investing in smart grid development and cross-border power transmission. Composite insulators are widely adopted to ensure efficient performance in polluted and coastal environments. Strict environmental standards and a focus on decarbonization drive utilities to modernize aging infrastructure. Growing renewable integration, particularly in wind energy, further supports demand. Companies in this region emphasize innovative material technologies and environmentally friendly production to meet EU sustainability targets and maintain market competitiveness.
Asia Pacific
Asia Pacific leads the market with a 36% share, driven by rapid urbanization, industrialization, and large-scale electrification programs. China and India dominate regional demand through extensive grid expansion and rural electrification initiatives. Governments are investing heavily in upgrading high-voltage transmission networks to meet rising power needs. Composite insulators are preferred for their cost efficiency, easy handling, and resistance to harsh weather. The strong presence of local manufacturers supports competitive pricing and faster deployment. Rapid renewable energy development, particularly in solar and wind, continues to strengthen the region’s dominant position in the global market.
Latin America
Latin America holds a 7% market share, supported by growing investments in grid expansion and rural electrification. Brazil and Mexico are key markets, focusing on modernizing outdated infrastructure to improve energy reliability. The region faces varied climatic conditions, making composite insulators an ideal choice for long-term performance and reduced maintenance. Expanding renewable energy projects also increase demand for durable insulation systems. However, budget constraints in some markets slow large-scale adoption. Manufacturers are targeting cost-effective solutions and partnerships with local utilities to strengthen their regional footprint and capture untapped growth potential.
Middle East & Africa
The Middle East & Africa region accounts for a 6% market share, driven by energy diversification and infrastructure development programs. Countries like Saudi Arabia, the UAE, and South Africa are upgrading transmission networks to support economic growth. Harsh environmental conditions, including high temperatures and dust exposure, increase the need for advanced composite insulators with strong hydrophobic properties. Renewable energy investments, particularly in solar, further accelerate demand. While adoption is rising, limited local manufacturing and financing remain challenges. Strategic partnerships and technology transfer initiatives are helping expand market reach and improve product accessibility across the region.
Market Segmentations:
By Product:
- Pin insulators
- Suspension insulators
By Application:
- Cables and transmission lines
- Switchgears
By End User:
- Residential
- Commercial & Industrial
By Geography
- North America
- U.S.
- Canada
- Mexico
- Europe
- Germany
- France
- U.K.
- Italy
- Spain
- Rest of Europe
- Asia Pacific
- China
- Japan
- India
- South Korea
- South-east Asia
- Rest of Asia Pacific
- Latin America
- Brazil
- Argentina
- Rest of Latin America
- Middle East & Africa
- GCC Countries
- South Africa
- Rest of the Middle East and Africa
Competitive Landscape
The competitive landscape of the composite insulators market includes Kuvag, ENSTO, Hitachi Energy, CYG Insulator, Hubbell, Izoelektro, Gipro, Nanjing Electric Technology, Deccan Enterprises, and CTC Insulator. The competitive landscape in the composite insulators market is shaped by strong emphasis on product innovation, advanced material engineering, and strategic collaborations. Leading manufacturers focus on developing lightweight, high-durability, and weather-resistant insulators suitable for modern transmission networks. Companies are investing in hydrophobic coatings and polymer technologies to improve performance and reduce maintenance costs. Expanding renewable energy projects and smart grid modernization drive demand for high-quality solutions. Many players strengthen their market position through regional expansion, joint ventures, and local manufacturing facilities. Intense competition encourages continuous R&D efforts, pricing optimization, and strict compliance with international performance and safety standards.
Key Player Analysis
- Kuvag
- ENSTO
- Hitachi Energy
- CYG Insulator
- Hubbell
- Izoelektro
- Gipro
- Nanjing Electric Technology
- Deccan Enterprises
- CTC Insulator
Recent Developments
- In June 2025, at the South Asia Expo in Kunming, Jiangxi Johnson Electric Co., Ltd., a prominent insulator manufacturer, showcased its latest high-voltage insulators and smart grid solutions. The company introduced three product lines including composite, porcelain, and glass insulators designed for ultra-high voltage lines.
- In June 2025, Järvi-Suomen Energia began testing Ensto's new composite line post insulators and compatible suspension crossarms in their 24 kV overhead network in Virtasalmi, Eastern Finland. These durable, high-quality products are part of a project to upgrade aging overhead lines to roadside configurations.
- In December 2024, PFISTERER is set to strengthen its international operations and solidify its foothold in Japan with its intent to increase collaborations with Japanese systems provider Nippon Katan Co., Ltd. Both companies have signed a joint venture cooperation contract to manufacture and promote composite insulators for overhead power lines in Japan.
- In December 2024, Contune International Co., Ltd has successfully fulfilled a contract and delivered a high-end thermal-mechanical testing machine to Mexico, thus demonstrating its capability in providing innovative testing services. This machine will significantly improve the manufacture and the quality control of composite insulators in the region which further underscores Continute’s commitment towards innovation and quality across different industries around the world.
Report Coverage
The research report offers an in-depth analysis based on Product, Application, End-User and Geography. It details leading market players, providing an overview of their business, product offerings, investments, revenue streams, and key applications. Additionally, the report includes insights into the competitive environment, SWOT analysis, current market trends, as well as the primary drivers and constraints. Furthermore, it discusses various factors that have driven market expansion in recent years. The report also explores market dynamics, regulatory scenarios, and technological advancements that are shaping the industry. It assesses the impact of external factors and global economic changes on market growth. Lastly, it provides strategic recommendations for new entrants and established companies to navigate the complexities of the market.
Future Outlook
- Demand for composite insulators will increase with expanding renewable energy projects.
- Grid modernization initiatives will create strong opportunities for advanced insulation solutions.
- Smart grid integration will drive the use of lightweight and high-performance materials.
- Investments in rural electrification will boost product adoption in emerging economies.
- Advanced polymer technologies will enhance product durability and service life.
- Manufacturers will focus on sustainable and eco-friendly production methods.
- Digital monitoring systems will support predictive maintenance and reliability.
- Strategic partnerships and local manufacturing will strengthen market reach.
- Regulatory standards will push utilities to replace traditional insulators.
- Rising infrastructure development will accelerate global market expansion.

Request a Free Sample
Fill in your details and we'll send you a free sample report.
- Sample data tables & charts
- Research methodology
Need a Custom Version of This Report?
Tailor the scope, geography, or segments to your exact requirements.
- Custom geography or segment scope
- Direct access to our analyst team
Frequently Asked Questions
What is the current market size for the Composite Insulators Market, and what is its projected size in 2032?
At what Compound Annual Growth Rate is the Composite Insulators Market projected to grow between 2025 and 2032?
Which Composite Insulators Market segment held the largest share in 2024?
What are the primary factors fueling the growth of the Composite Insulators Market?
Who are the leading companies in the Composite Insulators Market?
Which region commanded the largest share of the Composite Insulators Market in 2024?
Table of Content
Chapter 1 Market Segmentation
- 1.1 Segmentation Framework
- 1.1.1 Product and Service Classification
- 1.1.2 Application and End-Use Classification
- 1.1.3 Technology and Solution Classification
- 1.1.4 Customer and Distribution Channel Classification
- 1.1.5 Geographic Segmentation
- 1.1.6 Market Segment Definitions and Boundaries
Chapter 2 Introduction
- 2.1 Report Objectives and Scope
- 2.2 Product Definition and Industry Terminology
- 2.3 Market Inclusions and Exclusions
- 2.4 Research Process
- 2.4.1 Primary Research and Expert Interviews
- 2.4.2 Secondary Research and Source Review
- 2.4.3 Top-Down and Bottom-Up Estimation
- 2.4.4 Data Triangulation and Verification
- 2.5 Market Size Measurement Basis
- 2.5.1 2024: USD 3.6 billion → 2032: USD 5.87 billion
- 2.6 Historical and Forecast Reference Periods
- 2.6.1 Base Year: 2024
- 2.6.2 Forecast Period: 2024-2032
- 2.7 Research Assumptions and Limitations
Chapter 3 Executive Summary
- 3.1 Market Snapshot and Key Findings
- 3.2 Base-Year Market Size, 2024
- 3.3 Forecast Market Size, 2032
- 3.4 Revenue and Volume Growth Outlook
- 3.5 Key Demand and Supply Indicators
- 3.6 Leading Market Segments
- 3.7 Fastest-Growing Market Opportunities
- 3.8 Regional Performance Highlights
- 3.9 Technology and Industry Transformation
- 3.10 Competitive Landscape Summary
- 3.11 Analyst View and Strategic Implications
Chapter 4 Global Composite Insulators Market Trends and Developments
- 4.1 Historical Industry Development
- 4.2 Recent Market Trends and Developments
- 4.3 Demand and Customer Behavior Trends
- 4.4 Technology and Product Innovation
- 4.5 Artificial Intelligence, Automation and Digitalization
- 4.6 Local Manufacturing and Supply Chain Realignment
- 4.7 Industry Partnerships, Mergers and Acquisitions
- 4.8 Sustainability and Circular Economy Developments
- 4.9 Government and Private Sector Investment Trends
- 4.10 Emerging Business Models and Commercialization
- 4.11 Industry Developments and Announcements
Chapter 5 Global Composite Insulators Market Production, Supply and Demand Analysis
- 5.1 Demand Trend and Consumption Analysis
- 5.2 Demand Forecast, 2024-2032
- 5.3 Production and Output Trend
- 5.4 Production and Output Forecast, 2024-2032
- 5.5 Installed Capacity and Capacity Utilization
- 5.6 Company-Wise Production Plants and Statistics
- 5.6.1 Installed Production Capacity
- 5.6.2 Actual Production
- 5.6.3 Planned Capacity and Expansion Targets
- 5.7 Supply Chain Structure and Procurement Trends
- 5.8 Supply-Demand Gap and Bottlenecks
- 5.9 Import Dependence and Sourcing Structure
- 5.10 Contract Manufacturing and Outsourcing
- 5.11 Regional Supply and Demand Concentration
Chapter 6 Global Composite Insulators Market Pricing Analysis
- 6.1 Pricing Structure and Measurement
- 6.2 Historical Pricing Trends
- 6.3 Pricing Outlook, 2024-2032
- 6.4 Average Selling Price and Unit Economics
- 6.5 Pricing by Product and Market Segment
- 6.6 Geographic Pricing Differences
- 6.7 Key Input, Energy, Labor and Logistics Costs
- 6.8 Contract Pricing and Purchasing Models
- 6.9 Pricing Sensitivity and Competitive Positioning
- 6.10 Price, Margin and Profitability Implications
Chapter 7 Global Composite Insulators Market Dynamics
- 7.1 Market Growth Drivers
- 7.1.1 Demand-Side Drivers
- 7.1.2 Technology and Innovation Drivers
- 7.1.3 Infrastructure and Investment Drivers
- 7.1.4 Regulatory and Policy Drivers
- 7.2 Market Restraints
- 7.2.1 Cost and Affordability Constraints
- 7.2.2 Technology and Adoption Barriers
- 7.2.3 Supply Chain and Operational Constraints
- 7.3 Market Challenges
- 7.3.1 Competitive Pressure and Margin Erosion
- 7.3.2 Skills, Infrastructure and Implementation Gaps
- 7.4 Emerging Market Opportunities
- 7.5 Market Dynamics Impact and Time-Horizon Assessment
Chapter 8 Global Composite Insulators Value Chain Analysis
- 8.1 Industry Value Chain Overview
- 8.2 Upstream Suppliers and Critical Inputs
- 8.3 Technology and Component Providers
- 8.4 Manufacturing or Service Delivery
- 8.5 Distribution, Channel Partners and Integrators
- 8.6 Downstream Applications and End Users
- 8.7 Value Addition and Profit Pools
- 8.8 Vertical Integration and Outsourcing
- 8.9 Supplier Concentration and Risk
- 8.10 Supply Chain Localization and Resilience
Chapter 9 Global Composite Insulators Market Regulations and Policies
- 9.1 Relevant Laws, Standards and Compliance Frameworks
- 9.2 Product, Service, Safety and Quality Requirements
- 9.3 Government Policies, Incentives and Subsidies
- 9.4 Imports, Exports and Trade Barriers
- 9.5 Public Procurement and Local Content Requirements
- 9.6 Environmental and Sustainability Compliance
- 9.7 Upcoming Policy Changes and Market Implications
Chapter 10 Global Composite Insulators Market Hotspots and Opportunities
- 10.1 Market Opportunity Mapping and Growth Hotspots
- 10.2 High-Growth Applications and Customer Groups
- 10.3 Underserved Markets and White-Space Opportunities
- 10.4 Emerging Technology and Product Opportunities
- 10.5 New Capacity and Investment Hotspots
- 10.6 Market Entry and Expansion Opportunities
- 10.7 Distribution and Partnership Opportunities
- 10.8 Near-Term and Long-Term Commercial Potential
- 10.9 Opportunity Attractiveness and Execution Risks
Chapter 11 Global Composite Insulators Market Outlook, 2024-2032
- 11.1 Market Size and Analysis
- 11.1.1 Revenue (Market Measurement: 2024: USD 3.6 billion → 2032: USD 5.87 billion)
- 11.1.2 Market Volume and Quantity Sold
- 11.1.3 Historical Market Size
- 11.1.4 Base-Year Market Size, 2024
- 11.2 Market Forecast, 2024-2032
- 11.2.1 Revenue Forecast to 2032
- 11.2.2 Volume Forecast to 2032
- 11.2.3 CAGR and Year-on-Year Growth
- 11.2.4 Incremental Revenue Opportunity
- 11.3 Forecast Assumptions and Scenario Analysis
- 11.3.1 Base-Case Forecast
- 11.3.2 Optimistic and Conservative Scenarios
- 11.3.3 Technology, Pricing and Policy Sensitivities
- 11.4 Market Attractiveness and Growth Outlook
Chapter 12 Global Composite Insulators Market Segmentation and Outlook
- 12.1 Segmentation Summary and Market Shares, 2024
- 12.2 Largest and Fastest-Growing Segments
- 12.3 Segment Growth Comparison
- 12.4 Segment Attractiveness and Priority Matrix
Chapter 13 Global Composite Insulators Geographic Market Outlook, 2024-2032
- 13.1 Regional Market Size and Share, 2024
- 13.2 Regional Market Forecast, 2024-2032
- 13.3 Regional Pricing, Production and Demand Differences
- 13.4 North America
- 13.4.1 United States
- 13.4.2 Canada
- 13.4.3 Mexico
- 13.5 Europe
- 13.5.1 Germany
- 13.5.2 France
- 13.5.3 Italy
- 13.5.4 United Kingdom
- 13.5.5 Spain
- 13.5.6 Poland
- 13.5.7 Russia
- 13.5.8 Netherlands
- 13.5.9 Belgium
- 13.5.10 Sweden
- 13.5.11 Denmark
- 13.5.12 Norway
- 13.5.13 Rest of Europe
- 13.6 Asia Pacific
- 13.6.1 China
- 13.6.2 India
- 13.6.3 Japan
- 13.6.4 South Korea
- 13.6.5 Thailand
- 13.6.6 Indonesia
- 13.6.7 Vietnam
- 13.6.8 Malaysia
- 13.6.9 Australia
- 13.6.10 Rest of Asia Pacific
- 13.7 Latin America
- 13.7.1 Brazil
- 13.7.2 Argentina
- 13.7.3 Colombia
- 13.7.4 Chile
- 13.7.5 Rest of Latin America
- 13.8 Middle East
- 13.8.1 Saudi Arabia
- 13.8.2 United Arab Emirates
- 13.8.3 Turkey
- 13.8.4 Israel
- 13.8.5 Iran
- 13.8.6 Rest of the Middle East
- 13.9 Africa
- 13.9.1 South Africa
- 13.9.2 Egypt
- 13.9.3 Nigeria
- 13.9.4 Morocco
- 13.9.5 Rest of Africa
- 13.10 Regional Investment, Policy and Supply Chain Differences
- 13.11 Regional Competitive Landscape
- 13.12 Geographic Growth Hotspots
Chapter 14 Global Composite Insulators Technology, Innovation and Sustainability Outlook
- 14.1 Technology Landscape and Maturity
- 14.2 Product, Process and Service Innovation
- 14.3 AI, Automation and Digital Tools in the Industry
- 14.4 Technology Adoption and Performance Benchmarking
- 14.5 Innovation Pipeline and R&D Investment
- 14.6 Patent and Intellectual Property Trends
- 14.7 Energy Efficiency and Resource Management
- 14.8 Sustainability, Recycling and Circularity
- 14.9 Technology Roadmap, 2024-2032
- 14.10 Risks of Obsolescence and Technology Substitution
Chapter 15 Global Composite Insulators Market Key Strategic Imperatives
- 15.1 Growth and Market Entry Priorities
- 15.2 High-Return Products and Segments
- 15.3 Pricing, Profitability and Cost Optimization
- 15.4 Technology Investment and Product Differentiation
- 15.5 Supply Chain Localization and Resilience
- 15.6 Distribution and Customer Acquisition
- 15.7 Partnership, Acquisition and Capacity Strategy
- 15.8 Regional Expansion Priorities
- 15.9 Short-, Medium- and Long-Term Actions
Chapter 16 Competition Outlook
- 16.1 Industry Competition Characteristics
- 16.2 Market Structure and Concentration
- 16.3 Market Share and Competitive Positioning, 2024
- 16.4 Company-Wise Revenue and Product Benchmarking
- 16.5 Production and Service Capacity Benchmarking
- 16.6 Technology, Pricing and Differentiation
- 16.7 Regional Footprint and Distribution Strength
- 16.8 Mergers, Acquisitions and Strategic Alliances
- 16.9 New Entrants and Competitive Threats
- 16.10 Porter's Five Forces and Industry Attractiveness
- 16.11 Competitive Outlook, 2024-2032
Chapter 17 Company Profiles
- 17.1 Company Coverage and Selection Criteria
- 17.2 Leading Market Participants – Standard Profile Structure
- 17.2.1 Business Description
- 17.2.2 Company Ownership and Geographic Presence
- 17.2.3 Product and Service Portfolio
- 17.2.4 Manufacturing and Operating Footprint
- 17.2.5 Production Capacity and Expansion Plans
- 17.2.6 Financial Performance and Investment
- 17.2.7 Market Share and Competitive Position
- 17.2.8 Technology and Innovation Capabilities
- 17.2.9 Strategic Alliances or Partnerships
- 17.2.10 Recent Developments
- 17.2.11 Growth Strategy and Outlook
- 17.3 Other Relevant Market Participants
Note: Every listed company is profiled on the structure shown under the first company. The company list is preliminary and may change based on research findings, market developments, data availability and client requirements.
Chapter 18 Disclaimer
- 18.1 Research and Forecast Disclaimer
- 18.2 Data Source and Estimation Limitations
Note: The depth of individual sections depends on data availability for this market. Volume, capacity, trade and other unit-based metrics are included where applicable.

