
Market Overview
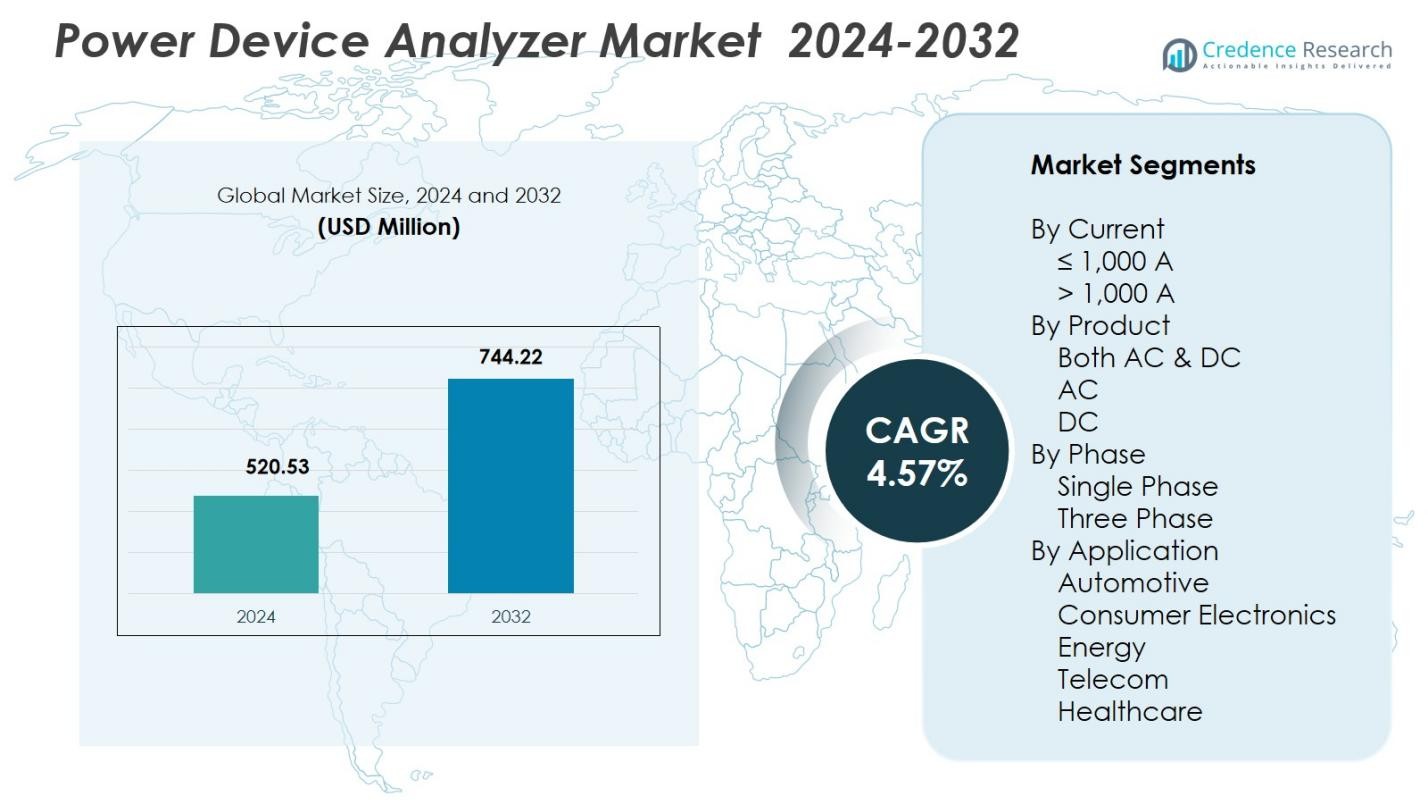
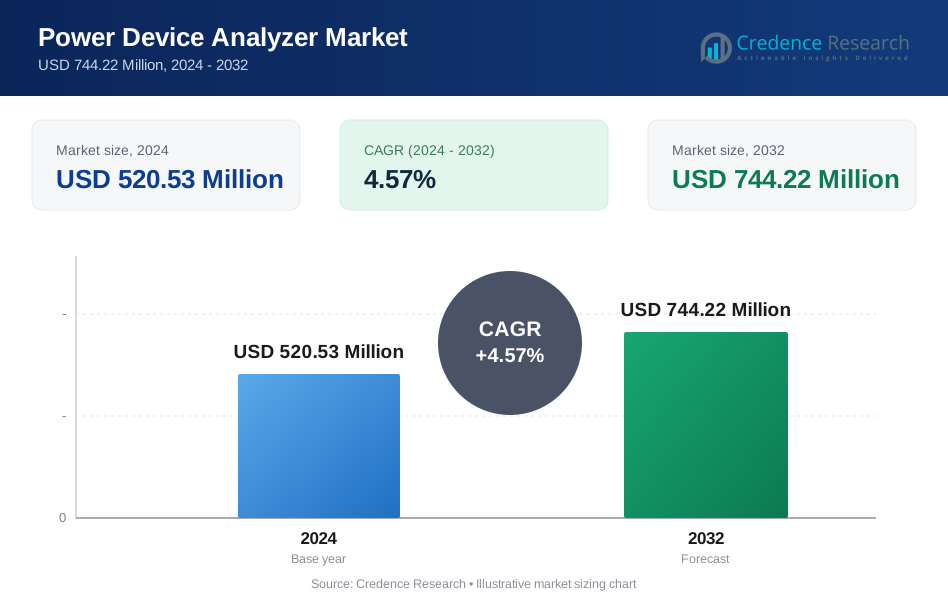
Power Device Analyzer Market size was valued at USD 520.53 Million in 2024 and is anticipated to reach USD 744.22 Million by 2032, at a CAGR of 4.57% during the forecast period.
| REPORT ATTRIBUTE | DETAILS |
|---|---|
| Historical Period | 2020-2023 |
| Base Year | 2024 |
| Forecast Period | 2025-2032 |
| Power Device Analyzer Market Size 2024 | USD 520.53 Million |
| Power Device Analyzer Market, CAGR | 4.57% |
| Power Device Analyzer Market Size 2032 | USD 744.22 Million |
Power Device Analyzer Market is characterized by strong participation from leading players such as DEWETRON, Carlo Gavazzi, Chroma ATE, Dewesoft, HIOKI E.E. CORPORATION, Fluke Corporation, Circutor, Arbiter Systems, Delta Electronics, and B&K Precision Corporation, each advancing high-accuracy measurement technologies to support evolving power electronics applications. These companies focus on enhancing bandwidth, precision, and AC/DC multifunctionality to address growing demand across automotive, renewable energy, and industrial sectors. Regionally, Asia-Pacific led the market with a 34.1% share, supported by large-scale electronics manufacturing and rapid EV expansion, followed by North America and Europe, which remain major hubs for advanced testing infrastructure and power system innovation.
Market Insights
- Power Device Analyzer Market reached USD 520.53 Million in 2024 and will grow at a CAGR of 4.57% through 2032, driven by rising demand for precision measurement.
- Market growth is supported by strong adoption of analyzers in EV systems, renewable inverters, and industrial automation, with the ≤1,000 A segment holding 63.4% share due to broad applicability across testing environments.
- Key trends include increasing use of SiC and GaN semiconductor devices, which accelerates demand for high-frequency, multi-channel analyzers offering advanced measurement accuracy.
- Leading players such as DEWETRON, Chroma ATE, HIOKI, Fluke, and Delta Electronics expand portfolios with enhanced AC/DC capabilities and smart, software-driven test automation.
- Regionally, Asia-Pacific leads with 34.1% share, followed by North America at 32.6% and Europe at 28.4%, while Latin America and Middle East & Africa show emerging adoption aligned with industrial modernization and renewable expansion.
Market Segmentation Analysis:
By Current
The ≤1,000 A segment held a 63.4% share in 2024, emerging as the dominant category in the Power Device Analyzer Market due to its extensive adoption across electronics testing, industrial automation, power supply validation, and renewable system monitoring. Its strong position is driven by the rising penetration of compact electronic devices and mid-range power systems requiring high-accuracy measurements within manageable current levels. Manufacturers increasingly integrate multifunctional analyzers in this range to support efficiency evaluations, design optimization, and compliance testing, reinforcing sustained demand across laboratories, R&D centers, and production environments.
- For instance, Keysight’s N6705C power analyzer supports multifunctional testing for industrial power supply validation, combining accuracy with compact design.
By Product
The Both AC & DC segment accounted for a 58.7% share in 2024, making it the leading product category as industries require analyzers capable of evaluating mixed-signal power systems in EV charging stations, solar inverters, UPS systems, and industrial drives. This segment grows strongly because engineers prefer unified analyzers that eliminate the need for separate AC- and DC-only devices, improving operational efficiency and reducing testing complexity. As hybrid energy systems expand globally, multifunctional AC/DC analyzers enable comprehensive performance validation, power efficiency measurements, and regulatory compliance, accelerating adoption across research, manufacturing, and grid applications.
- For instance, Tektronix’s PA4000 series offers integrated AC/DC power analysis, allowing manufacturers to test EV chargers’ complex waveforms with improved accuracy and reduced setup time.
By Phase
The Three Phase segment commanded a 61.9% share in 2024, dominating the market due to broad usage in heavy industrial machinery, energy distribution networks, renewable power plants, and high-capacity motor and drive testing. This segment benefits from increasing deployment of three-phase electrical infrastructure and rising emphasis on efficiency benchmarking for large-scale equipment. Engineers rely on these analyzers for harmonic evaluation, load balancing, system optimization, and high-precision fault detection. Growing modernization of industrial facilities and expansion of smart grid projects further strengthen demand for three-phase power device analyzers requiring advanced accuracy and multi-channel measurement capabilities.
Key Growth Drivers
Increasing Demand for High-Precision Power Measurement
Growing emphasis on energy efficiency, system optimization, and regulatory compliance is driving strong adoption of high-precision power device analyzers across industrial, automotive, and electronics sectors. Manufacturers increasingly rely on advanced analyzers to validate inverter efficiency, assess switching device performance, and measure real-time power quality under dynamic load conditions. The rising integration of power electronics in EVs, renewable energy, and automation systems further accelerates demand, as accurate electrical characterization becomes essential for improving reliability, extending operational life, and achieving performance certification.
- For instance, HIOKI launched the PW8001 Power Analyzer featuring eight-channel, high-bandwidth measurement to support EV inverter validation with superior accuracy.
Expansion of Renewable Energy and Smart Grid Infrastructure
The rapid expansion of solar, wind, and energy storage installations significantly boosts the requirement for power device analyzers capable of evaluating AC/DC hybrid systems. Utilities and developers depend on these analyzers to monitor inverter output, optimize grid integration, perform harmonic analysis, and ensure system stability under fluctuating generation conditions. Smart grid modernization initiatives also strengthen adoption as operators need advanced tools for load flow analysis, power factor correction, and real-time fault diagnostics. This infrastructure transformation enhances long-term demand for accurate and multifunctional power measurement solutions.
- For instance, Chroma ATE introduced its 8000 ATS platform to support high-precision PV inverter testing aligned with international grid-tie standards.
Accelerating Electrification in Automotive and Industrial Sectors
Electrification trends, including EV adoption, factory automation, and robotics deployment, are creating substantial need for analyzers that validate power electronics such as converters, batteries, and motor drives. Automotive OEMs use these analyzers to measure efficiency, switching behavior, and thermal performance of power modules across development and production cycles. Industrial users rely on them for motor control verification, predictive maintenance, and energy management. The rising use of semiconductor-based power devices like SiC and GaN amplifies demand for advanced testing capabilities, reinforcing the segment’s strong growth trajectory.
Key Trends & Opportunities
Shift Toward High-Frequency and Wide-Bandgap Device Testing
A major trend shaping the market is the transition to wide-bandgap semiconductor technologies, particularly SiC and GaN, which enable faster switching speeds and higher efficiency in power systems. This shift creates strong opportunities for analyzers capable of handling high-frequency harmonics, transient behaviors, and rapid switching dynamics. Manufacturers are introducing enhanced bandwidth and sampling-rate capabilities to support next-generation semiconductor testing. As industries adopt WBG devices for EV chargers, renewable inverters, and industrial drives, demand for advanced analyzers tailored to these applications continues to expand rapidly.
- For instance, Infineon Technologies has developed SiC MOSFETs that support higher voltage handling, simplifying designs for high-voltage DC/DC converters and DC/AC inverters used in electric vehicles and renewable energy systems.
Integration of IoT, Cloud Analytics, and Automation in Measurement Systems
Digital transformation is opening significant opportunities as power device analyzers integrate IoT connectivity, cloud-based data analytics, and automated testing workflows. These enhancements allow remote monitoring, real-time performance visualization, and predictive diagnostics, improving efficiency in R&D labs and production environments. Automated test sequencing reduces manual intervention, supporting repeatability and high-throughput validation for semiconductor and electronics manufacturing. Growing demand for connected test environments in smart factories and automotive electronics labs accelerates adoption, enabling deeper insights and faster decision-making through centralized data management and AI-enabled analysis.
- For instance, Tektronix has introduced automated test sequencing in their power analyzers, significantly reducing manual test interventions and enhancing throughput in semiconductor validation processes.
Key Challenges
High Cost of Advanced Power Device Analyzers
One of the major challenges is the high cost associated with advanced analyzers featuring multi-channel capability, high bandwidth, and wide dynamic measurement ranges. These units require sophisticated hardware, precision components, and specialized software, making them expensive for small laboratories and emerging manufacturers. Budget constraints often delay procurement or restrict upgrades, particularly in developing economies. The cost challenge also affects large-scale testing environments requiring multiple units. Vendors must innovate in modular designs and cost-optimized models to improve accessibility without compromising measurement accuracy or performance.
Complexity of Testing Advanced Power Electronics
The increasing sophistication of power electronics—especially systems based on SiC, GaN, and high-frequency switching architectures—creates substantial testing complexity. Engineers require deep expertise to analyze harmonics, switching losses, transient responses, and thermal interactions accurately. Misinterpretation of measurements or improper configuration can lead to incorrect system evaluations. Additionally, integrating analyzers with other lab instruments, automation platforms, and simulation tools adds operational challenges. The need for skilled professionals and extensive training slows adoption, making ease-of-use improvements essential for broader market penetration.
Regional Analysis
North America
North America held a 32.6% share in 2024, driven by strong adoption of advanced power testing solutions across automotive electrification, semiconductor R&D, and renewable energy expansion. The region benefits from extensive investments in EV charging infrastructure, power electronics innovation, and grid modernization programs that require high-precision measurement tools. U.S. and Canadian manufacturers increasingly integrate SiC and GaN device testing into product development cycles, strengthening demand for multi-channel, high-frequency analyzers. Supportive energy efficiency regulations and a well-established industrial base further reinforce the region’s leadership in technology adoption.
Europe
Europe accounted for a 28.4% share in 2024, supported by rapid advancements in renewable energy systems, industrial automation, and electric mobility. Countries including Germany, France, and the U.K. drive strong demand for power device analyzers to support inverter testing, grid stability assessments, and high-efficiency motor validation. The region’s stringent energy performance standards accelerate adoption in research laboratories and manufacturing facilities. Growing deployment of solar, wind, and storage technologies, along with widespread electrification initiatives under EU climate targets, continues to create significant opportunities for high-precision AC/DC and multi-phase analyzers.
Asia-Pacific
Asia-Pacific dominated with a 34.1% share in 2024, emerging as the fastest-growing region due to large-scale electronics manufacturing, rapid EV production expansion, and extensive renewable energy deployment. China, Japan, South Korea, and India are major contributors, leveraging advanced analyzers for semiconductor device validation, power converter efficiency testing, and industrial automation. Increasing investments in smart grid infrastructure and high-capacity power systems accelerate adoption across utilities and engineering facilities. The region’s strong semiconductor ecosystem, coupled with widespread adoption of SiC and GaN technologies, drives high demand for next-generation measurement solutions.
Latin America
Latin America represented a 2.6% share in 2024, with demand primarily supported by industrial modernization, energy infrastructure upgrades, and renewable project development in Brazil, Mexico, and Chile. The region is increasingly adopting power device analyzers for motor drive testing, power quality assessment, and inverter performance analysis as industries transition toward energy-efficient equipment. Growing solar and wind installations require precise AC/DC measurement capabilities, particularly for grid integration. While adoption is emerging, government-led energy reforms and increased foreign investment are strengthening the market’s long-term growth potential across utilities and manufacturing sectors.
Middle East & Africa
The Middle East & Africa accounted for a 2.3% share in 2024, driven by rising adoption of power analyzers in utility-scale renewable energy projects, industrial automation, and infrastructure expansion. Countries such as the UAE, Saudi Arabia, and South Africa are investing heavily in solar, hydrogen, and grid modernization initiatives, creating demand for precision testing tools. Growth is further supported by increased deployment of high-capacity motors, power distribution equipment, and advanced converters across oil & gas, mining, and manufacturing sectors. Despite relatively smaller market size, technology adoption is accelerating due to energy diversification efforts.
Market Segmentations:
By Current
- ≤ 1,000 A
- > 1,000 A
By Product
- Both AC & DC
- AC
- DC
By Phase
- Single Phase
- Three Phase
By Application
- Automotive
- Consumer Electronics
- Energy
- Telecom
- Healthcare
By Geography
- North America
- U.S.
- Canada
- Mexico
- Europe
- Germany
- France
- U.K.
- Italy
- Spain
- Rest of Europe
- Asia Pacific
- China
- Japan
- India
- South Korea
- South-east Asia
- Rest of Asia Pacific
- Latin America
- Brazil
- Argentina
- Rest of Latin America
- Middle East & Africa
- GCC Countries
- South Africa
- Rest of the Middle East and Africa
Competitive Landscape
Competitive landscape in the Power Device Analyzer Market includes major players such as DEWETRON, Carlo Gavazzi, Chroma ATE, Dewesoft, HIOKI E.E. CORPORATION, Fluke Corporation, Circutor, Arbiter Systems, Delta Electronics, and B&K Precision Corporation. The market reflects strong innovation dynamics as companies focus on advanced measurement accuracy, wider bandwidth capabilities, and integrated AC/DC testing platforms to support next-generation power electronics. Vendors actively expand product portfolios targeting applications such as EV powertrains, renewable inverters, semiconductor device characterization, and industrial automation. Strategic investments in high-frequency measurement technologies enable players to address growing demand for SiC and GaN device testing. Manufacturers also integrate IoT connectivity, automated test sequences, and cloud-enabled data analytics to enhance workflow efficiency in R&D and production environments. Partnerships with automotive OEMs, grid operators, and semiconductor firms further strengthen market penetration while continuous R&D ensures improved functionality, durability, and measurement reliability.
Key Player Analysis
- DEWETRON
- Carlo Gavazzi
- Chroma ATE
- Dewesoft
- HIOKI E.E. CORPORATION
- Fluke Corporation
- Circutor
- Arbiter Systems
- Delta Electronics
- B&K Precision Corporation
Recent Developments
- In October 2025, Hioki E.E. Corporation launched the PW4001 Power Analyzer, a compact and field-ready instrument designed for accurate inverter and EV-power electronics testing under real-world conditions.
- In April 2025, DEWETRON entered a new growth phase by partnering with ANRITSU following separation from TKH Group, reflecting a strategic decision to accelerate its global expansion in test and measurement for EV, renewable-energy and battery testing markets.
- In May 2025, Chroma ATE announced upgrades to its 3650-S2 power-testing platform, including a forthcoming HTMU board integrating AI-guided test flows for power-chip evaluation.
Report Coverage
The research report offers an in-depth analysis based on Current, Product, Phase, Application and Geography. It details leading market players, providing an overview of their business, product offerings, investments, revenue streams, and key applications. Additionally, the report includes insights into the competitive environment, SWOT analysis, current market trends, as well as the primary drivers and constraints. Furthermore, it discusses various factors that have driven market expansion in recent years. The report also explores market dynamics, regulatory scenarios, and technological advancements that are shaping the industry. It assesses the impact of external factors and global economic changes on market growth. Lastly, it provides strategic recommendations for new entrants and established companies to navigate the complexities of the market.
Future Outlook
- The market will expand as industries increasingly adopt advanced power electronics across automotive, renewable energy, and industrial automation.
- Demand for analyzers with high-frequency capability will rise due to wider use of SiC and GaN semiconductor devices.
- R&D labs and manufacturers will prioritize multifunctional AC/DC analyzers to streamline complex testing environments.
- Integration of IoT and cloud-based analytics will enhance real-time monitoring and remote testing efficiency.
- Automated test systems will gain traction as production lines seek higher throughput and repeatability.
- EV growth will significantly boost demand for analyzers used in battery, inverter, and motor drive validation.
- Grid modernization initiatives will strengthen adoption by utilities for power quality, fault detection, and system optimization.
- Miniaturized and portable analyzers will grow in demand to support field diagnostics and onsite performance evaluation.
- Adoption in emerging economies will accelerate as industries upgrade electrical infrastructure and testing standards.
- Vendors will strengthen innovation in accuracy, bandwidth, and software intelligence to address evolving measurement challenges.
Request a Free Sample
Fill in your details and we'll send you a free sample report.
- Sample data tables & charts
- Research methodology
Need a Custom Version of This Report?
Tailor the scope, geography, or segments to your exact requirements.
- Custom geography or segment scope
- Direct access to our analyst team
Frequently Asked Questions
What is the current market size for Power Device Analyzer Market, and what is its projected size in 2032?
At what Compound Annual Growth Rate is the Power Device Analyzer Market projected to grow between 2025 and 2032?
Which Power Device Analyzer Market segment held the largest share in 2024?
What are the primary factors fueling the growth of the Power Device Analyzer Market?
Who are the leading companies in the Power Device Analyzer Market?
Which region commanded the largest share of the Power Device Analyzer Market in 2024?
Table of Content
Chapter 1. Report Introduction
- 1.1 Report Description & Purpose
- 1.1.1 Report Title & Market Definition
- 1.1.2 Unique Selling Propositions (USP) & Key Differentiators
- 1.1.3 Value Proposition for Stakeholders
- 1.2 Research Objectives
- 1.2.1 Market Sizing Objectives (Volume & Revenue)
- 1.2.2 Segmentation Objectives
- 1.2.3 Competitive Intelligence Objectives
- 1.2.4 Forecast & Scenario Objectives
- 1.3 Report Scope
- 1.3.1 Power Device Analyzer Scope – Types & Subtypes Covered
- 1.3.2 Geographic Scope – Regions & Countries Covered
- 1.3.3 Historical Period, Base Year & Forecast Period (2024; forecast to 2032)
- 1.3.4 Inclusions & Exclusions
- 1.4 HS Code & Classification Framework
- 1.5 Currency, Units & Pricing Basis
- 1.6 Target Stakeholders
- 1.7 Limitations & Assumptions
Chapter 2. Executive Summary
- 2.1 Global Power Device Analyzer Market Snapshot
- 2.1.1 Market Size – Historical (2024) & Forecast (2024-2032) (2024: USD 520.53 Million → 2032: USD 744.22 Million)
- 2.1.2 Volume & Revenue – Global Totals
- 2.1.3 Key Market Highlights – Top Five Facts
- 2.2 Power Device Analyzer Market Segmentation Snapshot
- 2.2.1 Market Split by Region – 2024 vs. 2032
- 2.3 Competitive Snapshot
- 2.3.1 Top 10 Players by Revenue Share – 2024
- 2.3.2 Top 10 Players by Volume Share – 2024
- 2.3.3 Recent Strategic Developments (18-Month Summary)
- 2.4 Key Investment Highlights & Strategic Conclusions
Chapter 3. Power Device Analyzer Market Dynamics & Industry Analysis
- 3.1 Market Overview & Context
- 3.1.1 Power Device Analyzer Market Position in the Broader Automotive Value Chain
- 3.1.2 OEM vs. Replacement Market Dynamics
- 3.1.3 Market Maturity & Development Stage by Region
- 3.2 Power Device Analyzer Market Drivers
- 3.3 Power Device Analyzer Market Restraints & Challenges
- 3.4 Power Device Analyzer Market Opportunities
- 3.5 Porter's Five Forces Analysis
- 3.5.1 Threat of New Entrants
- 3.5.2 Bargaining Power of Suppliers
- 3.5.3 Bargaining Power of Buyers
- 3.5.4 Threat of Substitutes
- 3.5.5 Competitive Rivalry – Intensity Assessment
- 3.6 Power Device Analyzer Value Chain Analysis
- 3.6.1 Upstream – Raw Material/Input Suppliers
- 3.6.1.1 Raw Material/Input 1
- 3.6.1.2 Raw Material/Input 2
- 3.6.1.3 Raw Material/Input 3
- 3.6.2 Midstream – Production/Manufacturing/Service Delivery
- 3.6.2.1 Production/Process Overview
- 3.6.2.2 Key Facility Locations & Capacity by Manufacturer
- 3.6.3 Downstream – Distribution & End Consumer
- 3.6.3.1 Primary Channel – B2B/OEM
- 3.6.3.2 Secondary Channels – Dealer, Retail, Online, Direct
- 3.6.4 Value Chain Profitability Analysis
- 3.6.1 Upstream – Raw Material/Input Suppliers
- 3.7 PESTEL Analysis
- 3.7.1 Political Factors
- 3.7.2 Economic Factors
- 3.7.3 Social Factors
- 3.7.4 Technological Factors
- 3.7.5 Environmental Factors
- 3.7.6 Legal Factors
- 3.8 Power Device Analyzer Supply Chain Analysis
- 3.8.1 Raw Material/Input Supply Risk Assessment
- 3.8.2 Manufacturing Concentration Risk (Geographic Exposure)
- 3.8.3 Trade Disruption Impact Analysis
- 3.9 Regulatory & Policy Landscape
Note: The regulatory and policy landscape section covers regulations based on their applicability to the market, Power Device Analyzer category, geography, and scope of the study. Only regulatory frameworks with a material impact on operations, compliance, trade, sustainability, or market access are analyzed in detail.
Chapter 4. Key Investment Pockets & Opportunity Analysis
- 4.1 Power Device Analyzer Market Attractiveness Analysis
- 4.1.1 By Region – Investment Attractiveness Matrix (Volume × CAGR)
- 4.2 Absolute Revenue Growth Opportunity
- 4.2.1 By Region – Absolute USD Growth Through 2032
- 4.3 Incremental Volume Opportunity
- 4.3.1 By Region – Incremental Volume Through 2032
- 4.3.2 Segment – Incremental Volume
- 4.4 Emerging Submarket Opportunity Deep Dive (Subject to Applicability)
- 4.5 Emerging Market Opportunity Scorecards
- 4.5.1 United States
- 4.5.2 Europe
- 4.5.3 Asia
- 4.5.4 Middle East & Africa
Note: Emerging Market Opportunity Scorecards will be included based on relevance and strategic importance. Regions listed are indicative and may vary depending on data availability and market dynamics.
Chapter 5. Power Device Analyzer Import-Export Analysis & Trade Flows
- 5.1 Global Trade Overview
- 5.1.1 Global Export Value by Country (2024)
- 5.1.2 Global Export Volume by Country (2024)
- 5.1.3 Global Import Value by Country (2024)
- 5.1.4 Global Import Volume by Country (2024)
- 5.1.5 Net Trade Balance by Country (2024)
- 5.2 Export Analysis – Segment
- 5.2.1 Type 1 (HS Code)
- 5.2.2 Type 2 (HS Code)
- 5.2.3 Type 3 (HS Code)
- 5.2.4 Type 4 (HS Code)
- 5.2.5 Type 5 (HS Code)
- 5.3 Import Analysis – Segment
- 5.3.1 Type 1 (HS Code)
- 5.3.2 Type 2 (HS Code)
- 5.3.3 Type 3 (HS Code)
- 5.3.4 Type 4 (HS Code)
- 5.3.5 Type 5 (HS Code)
- 5.4 Average Unit Trade Prices
- 5.4.1 Average Export Price – Segment & Country
- 5.4.2 Average Import Price – Segment & Source Country
- 5.4.3 Price Trends (2024)
- 5.5 Key Trade Route Analysis
- 5.5.1 Trade Route 1
- 5.5.2 Trade Route 2
- 5.5.3 Trade Route 3
- 5.5.4 Trade Route 4
- 5.5.5 Trade Route 5
- 5.6 Trade Policy Impact Assessment
- 5.6.1 US Anti-Dumping & Section 301 Tariffs
- 5.6.2 EU Customs Union Impact
- 5.6.3 Major Free Trade Agreements
- 5.6.4 USMCA Rules of Origin
Note: Trade policy analysis will be included only where relevant to the Power Device Analyzer market.
Chapter 6. Competitive Landscape & Company Benchmarking
- 6.1 Power Device Analyzer Market Concentration & Structure
- 6.1.1 Herfindahl-Hirschman Index (HHI) – vs. 2024
- 6.1.2 Tier 1, Tier 2 & Tier 3 Market Structure
- 6.1.3 Global, Regional & Local Player Dynamics
- 6.2 Power Device Analyzer Market Share Analysis – 2024
- 6.2.1 Global Revenue Share by Company
- 6.2.2 Global Volume Share by Company
- 6.2.3 Regional Revenue Share
- 6.2.4 Market Share Evolution ( vs. 2024)
- 6.2.5 OEM Segment Share by Company
- 6.2.6 Replacement Segment Share by Company
- 6.3 Production/Delivery Capacity & Facility Analysis
- 6.3.1 Global Installed Capacity
- 6.3.2 Capacity Utilization Rates
- 6.3.3 Production/Output Volume
- 6.3.4 Facility Locations & Capacity Map
- 6.3.5 Planned Capacity Additions
- 6.4 Power Device Analyzer Competitive Benchmarking Matrix
- 6.4.1 Revenue, Volume, CAGR & Profitability Comparison
- 6.4.2 Channel Revenue Mix
- 6.4.3 Geographic Revenue Exposure
- 6.4.4 R&D Intensity
- 6.4.5 Sustainability Maturity
- 6.5 Strategic Developments in Power Device Analyzer (Last 24 Months)
- 6.5.1 Mergers, Acquisitions & Divestments
- 6.5.2 New Power Device Analyzer Launches
- 6.5.3 Facility Expansions
- 6.5.4 Strategic Alliances, Joint Ventures & Partnerships
- 6.5.5 Distribution Expansion & Market Entry
- 6.5.6 Sustainability & ESG Initiatives
- 6.6 Competitive Strategy Mapping
- 6.6.1 Leader, Challenger, Follower & Niche Classification
- 6.6.2 Pricing Strategy Comparison
- 6.6.3 Channel Strategy Matrix
Note: Strategic developments are included based on their materiality and the availability of reliable information.
Chapter 7. Global Power Device Analyzer Market – By Distribution Channel
- 7.1 Segment Overview
- 7.1.1 Volume & Revenue Split by Channel (2024 & 2032)
- 7.1.2 Channel Mix Evolution (2024-2032)
Chapter 8. Regional Market Analysis – Global Overview
- 8.1 Global Regional Overview
- 8.1.1 Regional Volume Share
- 8.1.2 Regional Revenue Share
- 8.1.3 Regional Volume by Region
- 8.1.4 Regional Revenue by Region
- 8.1.5 Regional Forecast Through 2032
- 8.2 Cross-Regional Segment Analysis
- 8.2.1 By Distribution Channel
- 8.2.2 By Brand/Price Tier
Chapter 9. North America Power Device Analyzer Market
- 9.1 United States
- 9.2 Canada
- 9.3 Mexico
Chapter 10. Europe Power Device Analyzer Market
- 10.1 Germany
- 10.2 France
- 10.3 Italy
- 10.4 United Kingdom
- 10.5 Spain
- 10.6 Poland
- 10.7 Russia
- 10.8 Netherlands
- 10.9 Belgium
- 10.10 Sweden
- 10.11 Denmark
- 10.12 Norway
- 10.13 Rest of Europe
Chapter 11. Asia Pacific Power Device Analyzer Market
- 11.1 China
- 11.2 India
- 11.3 Japan
- 11.4 South Korea
- 11.5 Thailand
- 11.6 Indonesia
- 11.7 Vietnam
- 11.8 Malaysia
- 11.9 Australia
- 11.10 Rest of Asia Pacific
Chapter 12. Latin America Power Device Analyzer Market
- 12.1 Brazil
- 12.2 Argentina
- 12.3 Colombia
- 12.4 Chile
- 12.5 Rest of Latin America
Chapter 13. Middle East Power Device Analyzer Market
- 13.1 Saudi Arabia
- 13.2 United Arab Emirates
- 13.3 Turkey
- 13.4 Israel
- 13.5 Iran
- 13.6 Rest of the Middle East
Chapter 14. Africa Power Device Analyzer Market
- 14.1 South Africa
- 14.2 Egypt
- 14.3 Nigeria
- 14.4 Morocco
- 14.5 Rest of Africa
Chapter 15. Power Device Analyzer Company Profiles
- 15.1 [Company 01]
- 15.1.1 Company Overview
- 15.1.2 Key Management Personnel
- 15.1.3 Products & Services Portfolio
- 15.1.4 Financial Performance
- 15.1.5 Key Market Focus & Geographic Presence
- 15.1.6 Recent Developments & Strategic Initiatives
Note: The company profile list is preliminary and may change based on research findings, market developments, data availability, and client requirements.
Chapter 16. Appendices
- Appendix A – List of Abbreviations & Acronyms
- Appendix B – Industry Classification Code Reference – Full Series
- Appendix C – Production & Capacity Data Tables
- Appendix D – End-Use & Demand Base Tables
- Appendix E – Consumption & Replacement Rate Assumptions
- Appendix F – ASP Reference Tables
- Appendix G – Manufacturing & Facility Database
- Appendix H – Import-Export Data Tables
- Appendix I – Regulatory Summary Tables
- Appendix J – Primary Research Participant List (Anonymized)
- Appendix K – Primary Research Questionnaire Framework
- Appendix L – Data Sources & Bibliography
- Appendix M – Market Size Divergence & Source Comparison
Chapter 17. Research Methodology
- 17.1 Research Framework & Philosophy
- 17.2 Secondary Research – Sources, Hierarchy & Data Extraction
- 17.3 Data Modeling – Bottom-Up & Top-Down Market Sizing
- 17.4 Primary Research – Stakeholder Framework, LOI & Sample Sizes
- 17.5 Forecast Methodology – Regression, Scenario & Sensitivity Analysis
- 17.6 Quality Control – Four-Layer Validation Framework
- 17.7 Limitations & Standard Assumptions
- 17.8 Disclaimer
