
Market Overview
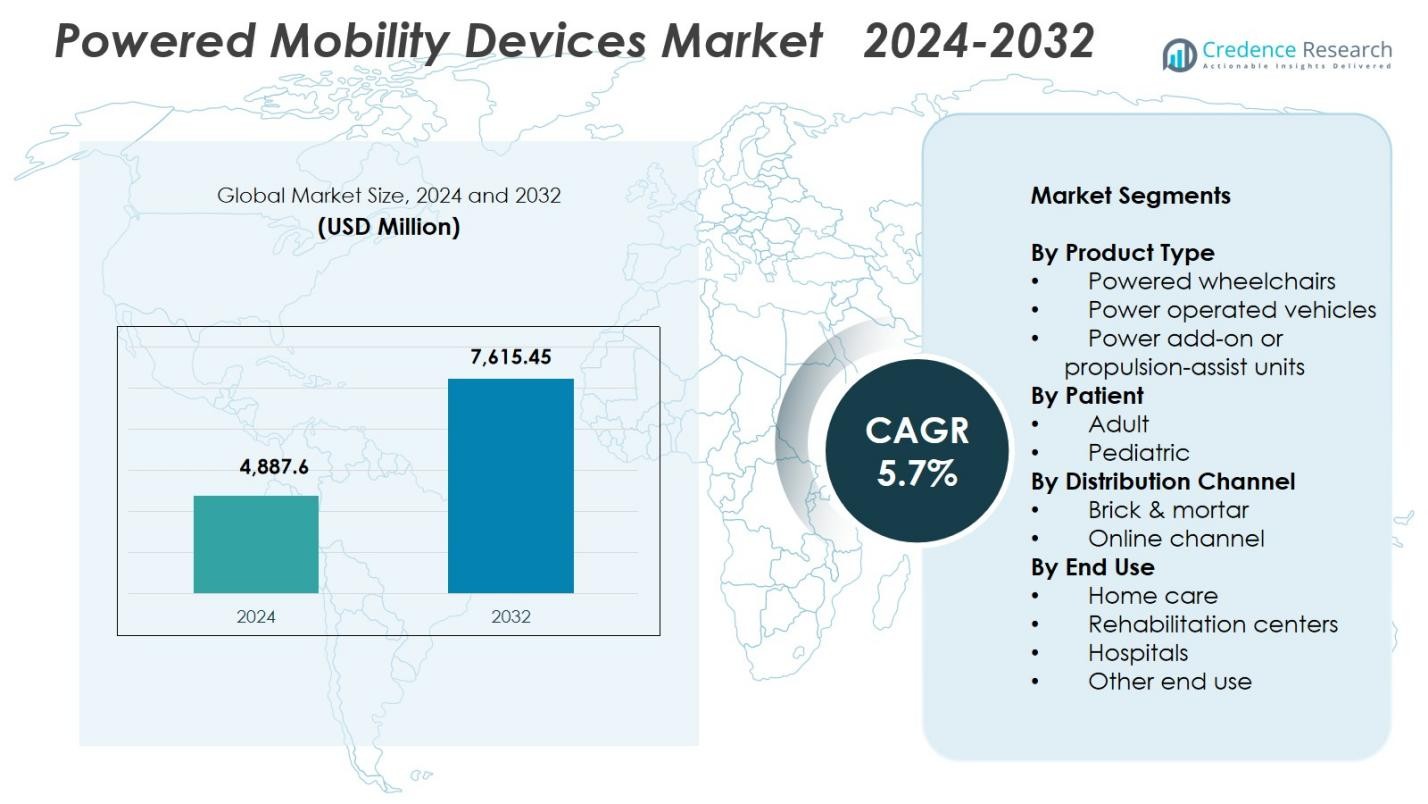
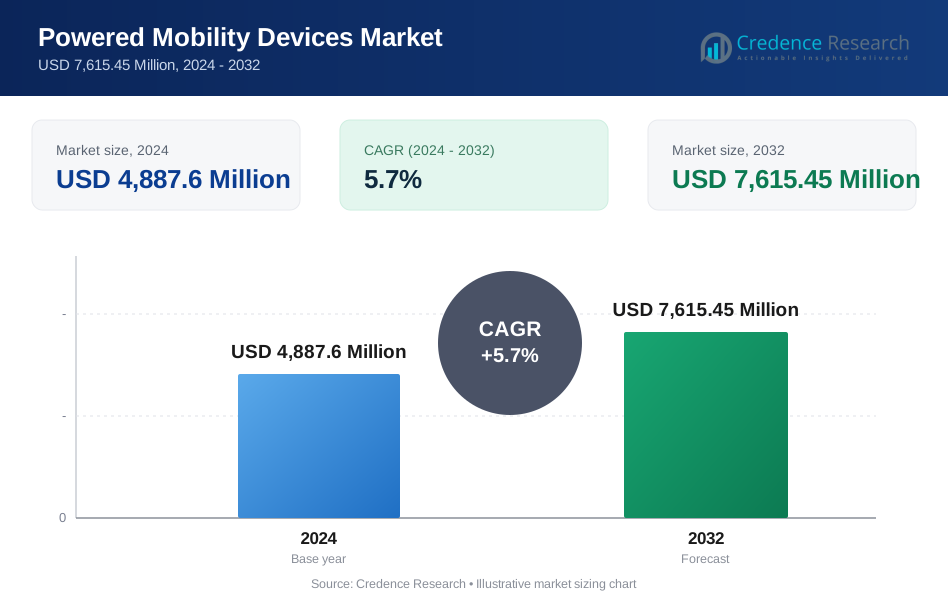
Powered Mobility Devices Market size was valued at USD 4,887.6 Million in 2024 and is anticipated to reach USD 7,615.45 Million by 2032, at a CAGR of 5.7% during the forecast period.
| REPORT ATTRIBUTE | DETAILS |
|---|---|
| Historical Period | 2020-2023 |
| Base Year | 2024 |
| Forecast Period | 2025-2032 |
| Powered Mobility Devices Market Size 2024 | USD 4,887.6 Million |
| Powered Mobility Devices Market, CAGR | 5.7% |
| Powered Mobility Devices Market Size 2032 | USD 7,615.45 Million |
Powered Mobility Devices Market features strong participation from leading manufacturers such as GOLDEN, Frido, LEVO, Airwheel, Merits, Hoveround Mobility Solutions, Drive DeVilbiss Healthcare, Invacare, Karman, and Decon, all of which focus on advancing device ergonomics, intelligent control systems, and premium mobility performance. These companies strengthen their presence through expanded product portfolios and technologically enhanced powered wheelchairs and mobility units designed for homecare and clinical use. Regionally, North America leads the market with 41.8% share, supported by high mobility aid adoption and strong healthcare infrastructure, while Europe and Asia-Pacific follow as significant contributors driven by rising disability support programs and growing elderly populations.
Market Insights
- Powered Mobility Devices Market recorded USD 4,887.6 Million in 2024 and will grow at a CAGR of 5.7% through 2032.
- Rising prevalence of mobility disorders and a growing geriatric population accelerate demand, with powered wheelchairs holding 52.4% share as the dominant product segment.
- Smart mobility trends such as AI-assisted navigation, remote diagnostics, and customizable ergonomic designs continue to reshape product innovation and expand adoption across homecare and rehabilitation settings.
- Key players including GOLDEN, Frido, LEVO, Airwheel, Merits, Hoveround Mobility Solutions, Drive DeVilbiss Healthcare, Invacare, Karman, and Decon strengthen the market through technological upgrades and broader channel expansion.
- North America leads with 41.8% share, followed by Europe at 29.6% and Asia-Pacific at 20.7%, while brick-and-mortar channels dominate distribution with 67.3% share due to strong patient preference for in-person evaluation and professional fitting services.
Market Segmentation Analysis:
By Product Type
The Powered Mobility Devices Market by product type is led by powered wheelchairs, holding 52.4% share in 2024, driven by rising adoption among individuals with permanent mobility impairments and growing demand for advanced maneuverability in indoor and outdoor environments. Manufacturers increasingly integrate AI-driven navigation, joystick enhancements, long-range lithium batteries, and customizable seating systems, strengthening the preference for powered wheelchairs over power-operated vehicles and propulsion-assist units. Power-operated vehicles captured 34.7% share, supported by elderly users seeking stability, while propulsion-assist units held 12.9% share, driven by hybrid mobility needs.
- For instance, Mobilis Drive Assist equips powered wheelchairs with an AI co-pilot sensor attached to the joystick bottom, analyzing objects within 2 meters ahead in real time for steering assistance and collision avoidance while users direct via joystick.
By Patient
The Powered Mobility Devices Market by patient segment is dominated by adult users, accounting for 78.6% share in 2024, driven by the high prevalence of age-related mobility disorders, increased disability incidence, and rising rehabilitation needs across long-term care settings. Adults increasingly choose powered wheelchairs and POVs due to improved comfort features, enhanced safety technologies, and broader reimbursement coverage in many regions. The pediatric segment, representing 21.4% share, grows as clinical adoption expands for children with neuromuscular disorders and congenital conditions, supported by lightweight frames, customizable seating, and ergonomic control systems designed for younger users.
- For instance, Pride Mobility's Jazzy Air 2 power wheelchair elevates up to 12 inches in 11 seconds for easier access to counters and improved eye-level interaction, while offering a lower seat-to-floor height for table use.
By Distribution Channel
The Powered Mobility Devices Market by distribution channel is led by brick-and-mortar outlets, commanding 67.3% share in 2024, driven by consumer preference for in-person product trials, clinical assessments, and professional fitting services. Hospitals, mobility clinics, and specialty retailers offer personalized consultations and after-sales maintenance, strengthening physical channel dominance. The online channel, with 32.7% share, expands rapidly as digital purchasing platforms, virtual product demos, and doorstep delivery options improve convenience. E-commerce adoption is further supported by broader product availability, transparent pricing, and rising consumer confidence in remote decision-making for mobility solutions.
Key Growth Drivers
Rising Prevalence of Mobility Disorders
The increasing incidence of mobility-impairing conditions such as arthritis, spinal cord injuries, multiple sclerosis, and age-related musculoskeletal disorders significantly drives demand for powered mobility devices. As global disability rates rise, healthcare systems prioritize accessible mobility support to enhance patient independence and quality of life. Advancements in clinical rehabilitation practices and wider adoption of power wheelchairs in hospitals and long-term care facilities further accelerate market expansion. The growing geriatric population plays a major role in strengthening long-term demand for these mobility solutions.
- For instance, Sunrise Medical introduced the QUICKIE Q50 R Carbon in March 2024, a foldable power wheelchair weighing 32 lbs with a 300 lbs user capacity and up to 15-mile range on dual batteries.
Expanding Geriatric Population
Rapid global aging remains a major catalyst for powered mobility device adoption, particularly in regions with rising life expectancy and an increasing share of elderly individuals requiring movement assistance. Older adults experience higher rates of mobility loss, prompting greater use of powered wheelchairs, POVs, and propulsion-assist units. Governments and private healthcare providers expand elderly care programs, home-care services, and insurance coverage to support mobility independence. Improved device ergonomics, lightweight frames, and customizable controls enhance safety and usability for seniors, reinforcing sustained market growth.
- For instance, Pride Mobility's Jazzy Elite HD power wheelchair provides front-wheel drive with 14-inch drive wheels for superior uphill climbing and tight indoor turns, aiding elderly outdoor freedom.
Technological Advancements in Mobility Solutions
Continuous innovation in mobility technology significantly boosts market growth as manufacturers integrate AI-based navigation, improved joystick control systems, long-lasting lithium battery packs, and advanced seating ergonomics. These enhancements improve user comfort, maneuverability, and device efficiency across indoor and outdoor environments. Smart connectivity features, tilt-and-recline systems, and customizable user interfaces broaden adoption across clinical and homecare settings. Technological improvements also support rehabilitation outcomes, enabling users with severe disabilities to achieve greater independence, thereby strengthening market acceptance and long-term device utilization.
Key Trends & Opportunities
Integration of Smart and Connected Mobility Features
A leading trend in the Powered Mobility Devices Market is the rapid integration of smart mobility technologies, including IoT-enabled monitoring, remote diagnostics, GPS navigation, and adaptive driving controls. These capabilities enhance safety, optimize battery performance, and allow real-time tracking for caregivers and healthcare providers. Manufacturers increasingly adopt sensor-based obstacle detection and AI-driven navigation systems, expanding opportunities for premium device offerings. The shift toward connected mobility solutions supports personalized rehabilitation plans and opens new avenues for subscription-based remote support services.
- For instance, Sunrise Medical integrates Bluetooth modules in its power wheelchairs, such as those with R-Net electronics, enabling connection to smartphones for IoT-based environmental control and the Switch-It Remote Seating App, which tracks seating angles to prevent pressure sores through acoustic and visual alerts.
Growing Demand for Customizable and Ergonomic Designs
Rising consumer preference for personalized mobility solutions creates strong opportunities for manufacturers offering modular, ergonomically enhanced, and highly customizable powered devices. Users increasingly require adjustable seating systems, compact frames, and adaptive control interfaces tailored to specific disabilities and lifestyle needs. Advances in lightweight materials, foldable designs, and hybrid indoor-outdoor wheelbases expand usability across diverse environments. Rehabilitation specialists and healthcare providers also emphasize device customization to improve posture, safety, and long-term clinical outcomes, positioning ergonomic innovation as a major growth opportunity.
- For instance, Invacare’s AVIVA FX Power Wheelchair leverages a compact base and customizable control interfaces, allowing users to select joystick styles and program control responses for specific clinical conditions.
Key Challenges
High Cost of Advanced Mobility Devices
The high cost of powered mobility devices remains a key barrier to widespread adoption, particularly in low- and middle-income regions. Premium powered wheelchairs and POVs equipped with advanced control systems, smart features, and durable components often exceed affordability thresholds for individual patients. Limited reimbursement coverage in several markets further restricts access. Manufacturers face the challenge of balancing technological advancements with cost-efficiency, while healthcare providers struggle to widen adoption among economically disadvantaged groups, slowing overall market penetration.
Limited Infrastructure and Accessibility Barriers
Inadequate infrastructure, such as poorly designed public spaces, limited wheelchair-friendly transportation, and barriers within residential and commercial buildings, continues to hinder effective use of powered mobility devices. Many regions lack standardized accessibility regulations, restricting mobility independence despite device availability. These limitations reduce user confidence and limit the functional benefits of powered devices, especially in developing regions. Insufficient maintenance support, limited service networks, and uneven distribution channels further compound challenges, making accessibility enhancement critical for broader market adoption.
Regional Analysis
North America
North America leads the Powered Mobility Devices Market with 41.8% share in 2024, supported by advanced healthcare infrastructure, strong reimbursement frameworks, and high adoption of powered wheelchairs among aging populations. The U.S. accounts for the largest demand, driven by increased prevalence of mobility disorders, strong purchasing power, and continuous product innovations from regional manufacturers. Rising home-care utilization and adoption of electronic mobility aids strengthen growth. Canada contributes steady expansion due to supportive public funding programs, growing geriatric demographics, and increasing integration of smart mobility technologies across rehabilitation centers and long-term care facilities.
Europe
Europe holds 29.6% share in 2024, driven by expanding assistive technology programs, strong regulatory emphasis on patient mobility rights, and increasing usage of powered wheelchairs in rehabilitation and geriatric care settings. Germany, the U.K., and France represent major markets with high mobility aid penetration, supported by structured insurance coverage and national disability support schemes. Innovations in lightweight power-assisted units and indoor-outdoor hybrid wheelchairs accelerate adoption. Rising chronic disease burden, demand for ergonomic mobility equipment, and the presence of leading manufacturers contribute to continued market expansion across Western and Northern Europe.
Asia-Pacific
Asia-Pacific accounts for 20.7% share in 2024, fueled by a rapidly aging population, expanding healthcare access, and rising demand for affordable powered mobility solutions in China, Japan, India, and South Korea. Government-backed disability support programs and increasing urbanization strengthen adoption of powered wheelchairs and power-operated vehicles. Local manufacturing growth and the availability of cost-efficient devices broaden accessibility for middle-income users. Japan leads technologically advanced solutions, while China sees surging domestic production. Growing rehabilitation infrastructure and digital sales channels further accelerate market penetration across emerging economies.
Latin America
Latin America captures 5.3% share in 2024, with growth supported by increasing incidence of mobility-limiting conditions and expanding rehabilitation services across Brazil, Mexico, Chile, and Argentina. Adoption rises as governments enhance disability inclusion programs and invest in mobility assistive technologies. Brazil leads regional demand due to large patient populations and expanding private healthcare. Import-driven availability of powered wheelchairs and POVs supports broader access, while rising e-commerce penetration enhances product reach. Economic recovery and increasing medical tourism strengthen opportunities for international manufacturers.
Middle East & Africa
The Middle East & Africa region holds 2.6% share in 2024, driven by increasing investments in healthcare modernization, growing demand for assistive devices in urban centers, and rising disability awareness initiatives. Gulf countries such as Saudi Arabia and the UAE lead adoption due to strong healthcare spending and government-backed mobility support programs. Africa shows gradual growth as rehabilitation infrastructure improves and NGOs expand mobility assistance programs. Import-driven availability, technological upgrades in hospitals, and growing emphasis on patient-centric mobility solutions contribute to steady but developing market expansion across the region.
Market Segmentations:
By Product Type
- Powered wheelchairs
- Power operated vehicles
- Power add-on or propulsion-assist units
By Patient
- Adult
- Pediatric
By Distribution Channel
- Brick & mortar
- Online channel
By End Use
- Home care
- Rehabilitation centers
- Hospitals
- Other end use
By Geography
- North America
- U.S.
- Canada
- Mexico
- Europe
- Germany
- France
- U.K.
- Italy
- Spain
- Rest of Europe
- Asia Pacific
- China
- Japan
- India
- South Korea
- South-east Asia
- Rest of Asia Pacific
- Latin America
- Brazil
- Argentina
- Rest of Latin America
- Middle East & Africa
- GCC Countries
- South Africa
- Rest of the Middle East and Africa
Competitive Landscape
The competitive landscape of the Powered Mobility Devices Market includes key players such as GOLDEN, Frido, LEVO, Airwheel, Merits, Hoveround Mobility Solutions, Drive DeVilbiss Healthcare, Invacare, Karman, and Decon. The market features strong innovation-driven activity as manufacturers focus on expanding product portfolios, enhancing device ergonomics, and integrating smart mobility technologies to meet evolving patient needs. Companies emphasize lightweight materials, AI-assisted navigation, long-range battery systems, and customizable seating configurations to strengthen clinical and homecare applications. Strategic collaborations with healthcare providers, rehabilitation centers, and insurance networks support wider market penetration. Producers also invest heavily in R&D to introduce compact, foldable, and hybrid indoor-outdoor mobility solutions. Growing online sales channels and regional distribution partnerships enable companies to broaden customer reach. Additionally, manufacturers increasingly adopt patient-centric designs and cost-efficient production models to address accessibility challenges and meet rising global demand for powered mobility assistance.
Key Player Analysis
- GOLDEN
- Frido
- LEVO
- Airwheel
- merits
- Hoveround Mobility Solutions
- drive DeVilbiss Healthcare
- INVACARE
- KARMAN
- decon
Recent Developments
- In July 2025 Sunrise Medical acquired neuro-rehabilitation specialist Made for Movement (MfM), strengthening its powered mobility and therapeutic device offerings.
- In December 2025 ALIMCO launched a new three-wheeled electric scooter and a “clip-on” motorised device converting manual wheelchairs into battery-powered mobility aids, marking a shift toward affordable assistive mobility in India.
- In May 2025 Sunrise Medical launched the Empulse® M90 power-add-on unit to convert manual wheelchairs into powered mobility devices, enhancing accessibility for existing wheelchair users.
- In April 2024 Golden launched the GP303 Golden Ally™, a lightweight foldable power wheelchair, expanding its mobility product line and improving portability for users.
Report Coverage
The research report offers an in-depth analysis based on Product Type, Patient, Distribution Channel, End Use and Geography. It details leading market players, providing an overview of their business, product offerings, investments, revenue streams, and key applications. Additionally, the report includes insights into the competitive environment, SWOT analysis, current market trends, as well as the primary drivers and constraints. Furthermore, it discusses various factors that have driven market expansion in recent years. The report also explores market dynamics, regulatory scenarios, and technological advancements that are shaping the industry. It assesses the impact of external factors and global economic changes on market growth. Lastly, it provides strategic recommendations for new entrants and established companies to navigate the complexities of the market.
Future Outlook
- The market will experience steady adoption as aging populations drive long-term demand for powered mobility solutions.
- Technological advancements will strengthen product capabilities, with AI-driven navigation and smart connectivity becoming standard features.
- Manufacturers will expand customization options, enabling users to personalize controls, seating, and mobility configurations more effectively.
- Lightweight materials and compact foldable designs will gain traction, improving portability and user convenience.
- Healthcare reimbursement frameworks will evolve, supporting broader access to advanced mobility devices across multiple regions.
- Online distribution channels will expand rapidly as virtual demos and remote purchasing options increase consumer confidence.
- Integration of remote diagnostics and tele-rehabilitation support will enhance device performance monitoring and patient outcomes.
- Emerging markets will show stronger adoption as local manufacturing improves affordability and accessibility.
- Partnerships between mobility device companies and healthcare providers will accelerate product innovation and clinical acceptance.
- Sustainability-focused design initiatives will influence material selection, battery systems, and production processes across the industry.
Request a Free Sample
Fill in your details and we'll send you a free sample report.
- Sample data tables & charts
- Research methodology
Need a Custom Version of This Report?
Tailor the scope, geography, or segments to your exact requirements.
- Custom geography or segment scope
- Direct access to our analyst team
Frequently Asked Questions
What is the current market size for Powered Mobility Devices Market, and what is its projected size in 2032?
At what Compound Annual Growth Rate is the Powered Mobility Devices Market projected to grow between 2025 and 2032?
Which Powered Mobility Devices Market segment held the largest share in 2024?
What are the primary factors fueling the growth of the Powered Mobility Devices Market?
Who are the leading companies in the Powered Mobility Devices Market?
Which region commanded the largest share of the Powered Mobility Devices Market in 2024?
Table of Content
Chapter 1. Report Introduction
- 1.1 Report Description & Purpose
- 1.1.1 Report Title & Market Definition
- 1.1.2 Unique Selling Propositions (USP) & Key Differentiators
- 1.1.3 Value Proposition for Stakeholders
- 1.2 Research Objectives
- 1.2.1 Market Sizing Objectives (Volume & Revenue)
- 1.2.2 Segmentation Objectives
- 1.2.3 Competitive Intelligence Objectives
- 1.2.4 Forecast & Scenario Objectives
- 1.3 Report Scope
- 1.3.1 Powered Mobility Devices Scope – Types & Subtypes Covered
- 1.3.2 Geographic Scope – Regions & Countries Covered
- 1.3.3 Historical Period, Base Year & Forecast Period (2024; forecast to 2032)
- 1.3.4 Inclusions & Exclusions
- 1.4 HS Code & Classification Framework
- 1.5 Currency, Units & Pricing Basis
- 1.6 Target Stakeholders
- 1.7 Limitations & Assumptions
Chapter 2. Executive Summary
- 2.1 Global Powered Mobility Devices Market Snapshot
- 2.1.1 Market Size – Historical (2024) & Forecast (2024-2032) (2024: USD 4,887.6 Million → 2032: USD 7,615.45 Million)
- 2.1.2 Volume & Revenue – Global Totals
- 2.1.3 Key Market Highlights – Top Five Facts
- 2.2 Powered Mobility Devices Market Segmentation Snapshot
- 2.2.1 Market Split by Region – 2024 vs. 2032
- 2.3 Competitive Snapshot
- 2.3.1 Top 10 Players by Revenue Share – 2024
- 2.3.2 Top 10 Players by Volume Share – 2024
- 2.3.3 Recent Strategic Developments (18-Month Summary)
- 2.4 Key Investment Highlights & Strategic Conclusions
Chapter 3. Powered Mobility Devices Market Dynamics & Industry Analysis
- 3.1 Market Overview & Context
- 3.1.1 Powered Mobility Devices Market Position in the Broader Automotive Value Chain
- 3.1.2 OEM vs. Replacement Market Dynamics
- 3.1.3 Market Maturity & Development Stage by Region
- 3.2 Powered Mobility Devices Market Drivers
- 3.3 Powered Mobility Devices Market Restraints & Challenges
- 3.4 Powered Mobility Devices Market Opportunities
- 3.5 Porter's Five Forces Analysis
- 3.5.1 Threat of New Entrants
- 3.5.2 Bargaining Power of Suppliers
- 3.5.3 Bargaining Power of Buyers
- 3.5.4 Threat of Substitutes
- 3.5.5 Competitive Rivalry – Intensity Assessment
- 3.6 Powered Mobility Devices Value Chain Analysis
- 3.6.1 Upstream – Raw Material/Input Suppliers
- 3.6.1.1 Raw Material/Input 1
- 3.6.1.2 Raw Material/Input 2
- 3.6.1.3 Raw Material/Input 3
- 3.6.2 Midstream – Production/Manufacturing/Service Delivery
- 3.6.2.1 Production/Process Overview
- 3.6.2.2 Key Facility Locations & Capacity by Manufacturer
- 3.6.3 Downstream – Distribution & End Consumer
- 3.6.3.1 Primary Channel – B2B/OEM
- 3.6.3.2 Secondary Channels – Dealer, Retail, Online, Direct
- 3.6.4 Value Chain Profitability Analysis
- 3.6.1 Upstream – Raw Material/Input Suppliers
- 3.7 PESTEL Analysis
- 3.7.1 Political Factors
- 3.7.2 Economic Factors
- 3.7.3 Social Factors
- 3.7.4 Technological Factors
- 3.7.5 Environmental Factors
- 3.7.6 Legal Factors
- 3.8 Powered Mobility Devices Supply Chain Analysis
- 3.8.1 Raw Material/Input Supply Risk Assessment
- 3.8.2 Manufacturing Concentration Risk (Geographic Exposure)
- 3.8.3 Trade Disruption Impact Analysis
- 3.9 Regulatory & Policy Landscape
Note: The regulatory and policy landscape section covers regulations based on their applicability to the market, Powered Mobility Devices category, geography, and scope of the study. Only regulatory frameworks with a material impact on operations, compliance, trade, sustainability, or market access are analyzed in detail.
Chapter 4. Key Investment Pockets & Opportunity Analysis
- 4.1 Powered Mobility Devices Market Attractiveness Analysis
- 4.1.1 By Region – Investment Attractiveness Matrix (Volume × CAGR)
- 4.2 Absolute Revenue Growth Opportunity
- 4.2.1 By Region – Absolute USD Growth Through 2032
- 4.3 Incremental Volume Opportunity
- 4.3.1 By Region – Incremental Volume Through 2032
- 4.3.2 Segment – Incremental Volume
- 4.4 Emerging Submarket Opportunity Deep Dive (Subject to Applicability)
- 4.5 Emerging Market Opportunity Scorecards
- 4.5.1 United States
- 4.5.2 Europe
- 4.5.3 Asia
- 4.5.4 Middle East & Africa
Note: Emerging Market Opportunity Scorecards will be included based on relevance and strategic importance. Regions listed are indicative and may vary depending on data availability and market dynamics.
Chapter 5. Powered Mobility Devices Import-Export Analysis & Trade Flows
- 5.1 Global Trade Overview
- 5.1.1 Global Export Value by Country (2024)
- 5.1.2 Global Export Volume by Country (2024)
- 5.1.3 Global Import Value by Country (2024)
- 5.1.4 Global Import Volume by Country (2024)
- 5.1.5 Net Trade Balance by Country (2024)
- 5.2 Export Analysis – Segment
- 5.2.1 Type 1 (HS Code)
- 5.2.2 Type 2 (HS Code)
- 5.2.3 Type 3 (HS Code)
- 5.2.4 Type 4 (HS Code)
- 5.2.5 Type 5 (HS Code)
- 5.3 Import Analysis – Segment
- 5.3.1 Type 1 (HS Code)
- 5.3.2 Type 2 (HS Code)
- 5.3.3 Type 3 (HS Code)
- 5.3.4 Type 4 (HS Code)
- 5.3.5 Type 5 (HS Code)
- 5.4 Average Unit Trade Prices
- 5.4.1 Average Export Price – Segment & Country
- 5.4.2 Average Import Price – Segment & Source Country
- 5.4.3 Price Trends (2024)
- 5.5 Key Trade Route Analysis
- 5.5.1 Trade Route 1
- 5.5.2 Trade Route 2
- 5.5.3 Trade Route 3
- 5.5.4 Trade Route 4
- 5.5.5 Trade Route 5
- 5.6 Trade Policy Impact Assessment
- 5.6.1 US Anti-Dumping & Section 301 Tariffs
- 5.6.2 EU Customs Union Impact
- 5.6.3 Major Free Trade Agreements
- 5.6.4 USMCA Rules of Origin
Note: Trade policy analysis will be included only where relevant to the Powered Mobility Devices market.
Chapter 6. Competitive Landscape & Company Benchmarking
- 6.1 Powered Mobility Devices Market Concentration & Structure
- 6.1.1 Herfindahl-Hirschman Index (HHI) – vs. 2024
- 6.1.2 Tier 1, Tier 2 & Tier 3 Market Structure
- 6.1.3 Global, Regional & Local Player Dynamics
- 6.2 Powered Mobility Devices Market Share Analysis – 2024
- 6.2.1 Global Revenue Share by Company
- 6.2.2 Global Volume Share by Company
- 6.2.3 Regional Revenue Share
- 6.2.4 Market Share Evolution ( vs. 2024)
- 6.2.5 OEM Segment Share by Company
- 6.2.6 Replacement Segment Share by Company
- 6.3 Production/Delivery Capacity & Facility Analysis
- 6.3.1 Global Installed Capacity
- 6.3.2 Capacity Utilization Rates
- 6.3.3 Production/Output Volume
- 6.3.4 Facility Locations & Capacity Map
- 6.3.5 Planned Capacity Additions
- 6.4 Powered Mobility Devices Competitive Benchmarking Matrix
- 6.4.1 Revenue, Volume, CAGR & Profitability Comparison
- 6.4.2 Channel Revenue Mix
- 6.4.3 Geographic Revenue Exposure
- 6.4.4 R&D Intensity
- 6.4.5 Sustainability Maturity
- 6.5 Strategic Developments in Powered Mobility Devices (Last 24 Months)
- 6.5.1 Mergers, Acquisitions & Divestments
- 6.5.2 New Powered Mobility Devices Launches
- 6.5.3 Facility Expansions
- 6.5.4 Strategic Alliances, Joint Ventures & Partnerships
- 6.5.5 Distribution Expansion & Market Entry
- 6.5.6 Sustainability & ESG Initiatives
- 6.6 Competitive Strategy Mapping
- 6.6.1 Leader, Challenger, Follower & Niche Classification
- 6.6.2 Pricing Strategy Comparison
- 6.6.3 Channel Strategy Matrix
Note: Strategic developments are included based on their materiality and the availability of reliable information.
Chapter 7. Global Powered Mobility Devices Market – By Distribution Channel
- 7.1 Segment Overview
- 7.1.1 Volume & Revenue Split by Channel (2024 & 2032)
- 7.1.2 Channel Mix Evolution (2024-2032)
Chapter 8. Regional Market Analysis – Global Overview
- 8.1 Global Regional Overview
- 8.1.1 Regional Volume Share
- 8.1.2 Regional Revenue Share
- 8.1.3 Regional Volume by Region
- 8.1.4 Regional Revenue by Region
- 8.1.5 Regional Forecast Through 2032
- 8.2 Cross-Regional Segment Analysis
- 8.2.1 By Distribution Channel
- 8.2.2 By Brand/Price Tier
Chapter 9. North America Powered Mobility Devices Market
- 9.1 United States
- 9.2 Canada
- 9.3 Mexico
Chapter 10. Europe Powered Mobility Devices Market
- 10.1 Germany
- 10.2 France
- 10.3 Italy
- 10.4 United Kingdom
- 10.5 Spain
- 10.6 Poland
- 10.7 Russia
- 10.8 Netherlands
- 10.9 Belgium
- 10.10 Sweden
- 10.11 Denmark
- 10.12 Norway
- 10.13 Rest of Europe
Chapter 11. Asia Pacific Powered Mobility Devices Market
- 11.1 China
- 11.2 India
- 11.3 Japan
- 11.4 South Korea
- 11.5 Thailand
- 11.6 Indonesia
- 11.7 Vietnam
- 11.8 Malaysia
- 11.9 Australia
- 11.10 Rest of Asia Pacific
Chapter 12. Latin America Powered Mobility Devices Market
- 12.1 Brazil
- 12.2 Argentina
- 12.3 Colombia
- 12.4 Chile
- 12.5 Rest of Latin America
Chapter 13. Middle East Powered Mobility Devices Market
- 13.1 Saudi Arabia
- 13.2 United Arab Emirates
- 13.3 Turkey
- 13.4 Israel
- 13.5 Iran
- 13.6 Rest of the Middle East
Chapter 14. Africa Powered Mobility Devices Market
- 14.1 South Africa
- 14.2 Egypt
- 14.3 Nigeria
- 14.4 Morocco
- 14.5 Rest of Africa
Chapter 15. Powered Mobility Devices Company Profiles
- 15.1 [Company 01]
- 15.1.1 Company Overview
- 15.1.2 Key Management Personnel
- 15.1.3 Products & Services Portfolio
- 15.1.4 Financial Performance
- 15.1.5 Key Market Focus & Geographic Presence
- 15.1.6 Recent Developments & Strategic Initiatives
Note: The company profile list is preliminary and may change based on research findings, market developments, data availability, and client requirements.
Chapter 16. Appendices
- Appendix A – List of Abbreviations & Acronyms
- Appendix B – Industry Classification Code Reference – Full Series
- Appendix C – Production & Capacity Data Tables
- Appendix D – End-Use & Demand Base Tables
- Appendix E – Consumption & Replacement Rate Assumptions
- Appendix F – ASP Reference Tables
- Appendix G – Manufacturing & Facility Database
- Appendix H – Import-Export Data Tables
- Appendix I – Regulatory Summary Tables
- Appendix J – Primary Research Participant List (Anonymized)
- Appendix K – Primary Research Questionnaire Framework
- Appendix L – Data Sources & Bibliography
- Appendix M – Market Size Divergence & Source Comparison
Chapter 17. Research Methodology
- 17.1 Research Framework & Philosophy
- 17.2 Secondary Research – Sources, Hierarchy & Data Extraction
- 17.3 Data Modeling – Bottom-Up & Top-Down Market Sizing
- 17.4 Primary Research – Stakeholder Framework, LOI & Sample Sizes
- 17.5 Forecast Methodology – Regression, Scenario & Sensitivity Analysis
- 17.6 Quality Control – Four-Layer Validation Framework
- 17.7 Limitations & Standard Assumptions
- 17.8 Disclaimer
