
Market Overview
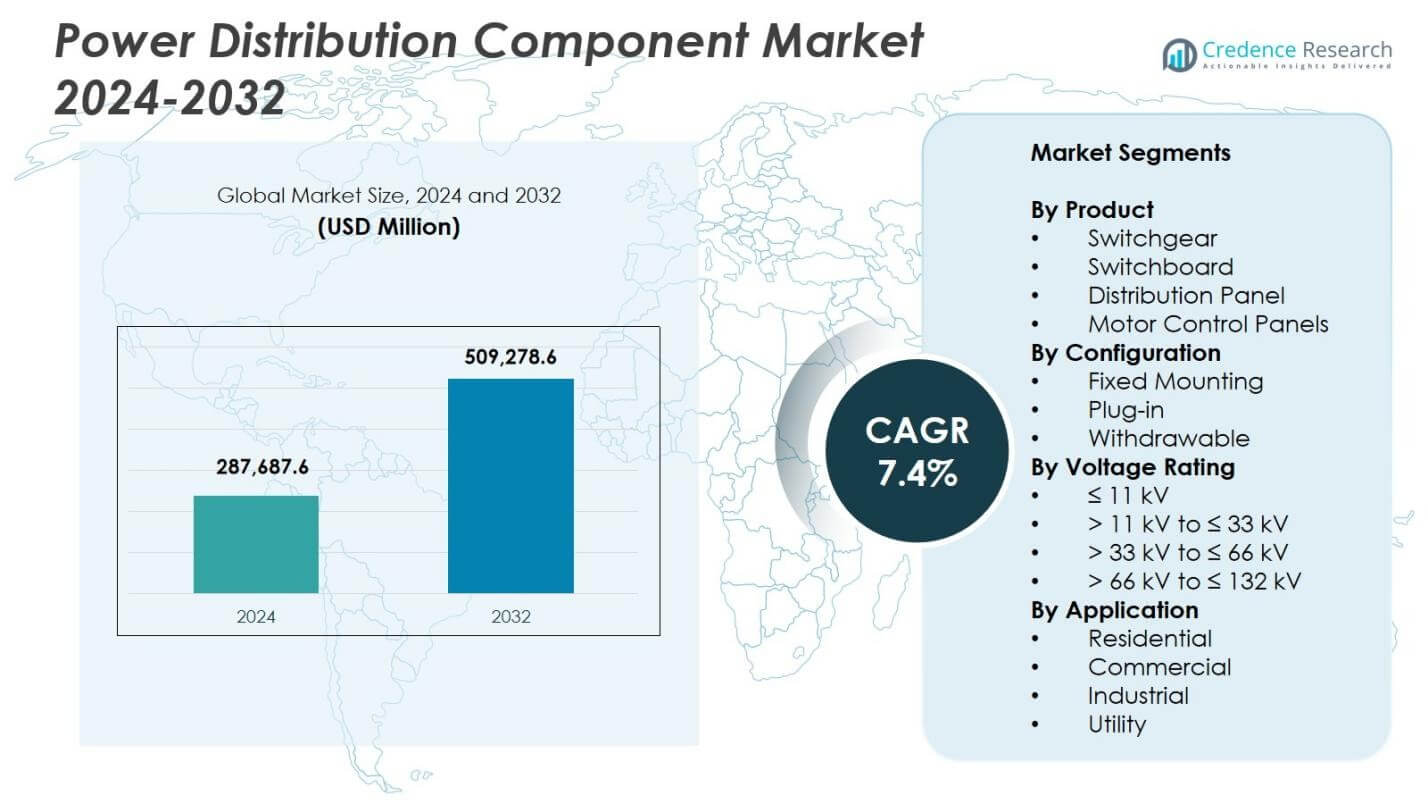
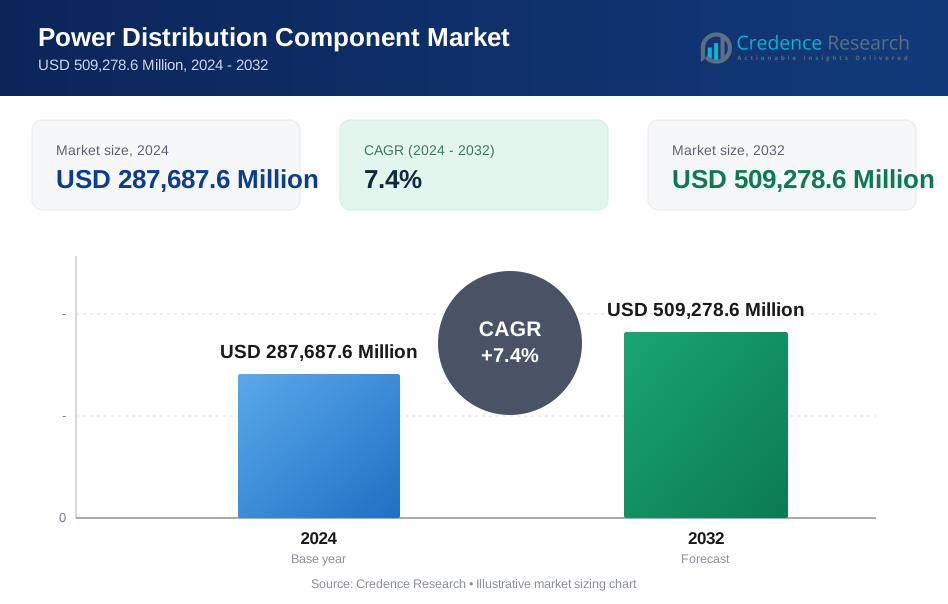
Power Distribution Component Market size was valued at USD 287,687.6 Million in 2024 and is anticipated to reach USD 509,278.6 Million by 2032, at a CAGR of 7.4% during the forecast period.
| REPORT ATTRIBUTE | DETAILS |
|---|---|
| Historical Period | 2020-2023 |
| Base Year | 2024 |
| Forecast Period | 2025-2032 |
| Power Distribution Component Market Size 2024 | USD 287,687.6 Million |
| Power Distribution Component Market, CAGR | 7.4% |
| Power Distribution Component Market Size 2032 | USD 509,278.6 Million |
Power Distribution Component Market features leading players such as ABB, Eaton, General Electric, Hitachi Energy, Fuji Electric, Hubbell, Hyundai Electric, Hyosung Heavy Industries, L&T Electrical, and Lucy Group, all advancing technology portfolios to meet rising demand for efficient distribution infrastructure. These companies focus on intelligent switchgear, modular distribution panels, and IoT-enabled monitoring systems to support grid modernization, renewable energy integration, and industrial expansion. Regionally, Asia-Pacific leads the market with 34.7% share in 2024, driven by large-scale electrification and infrastructure growth, followed by North America with 32.8% share and Europe at 28.4% share, reflecting strong modernization and regulatory-driven upgrades across their networks.
Market Insights
- Power Distribution Component Market was valued at USD 287,687.6 Million in 2024 and will reach USD 509,278.6 Million by 2032 at a 4% CAGR.
- Switchgear led the market with a 6% share, supported by rising grid modernization, industrial electrification, and renewable energy integration across major economies.
- Smart and IoT-enabled distribution components continued to gain traction as utilities prioritize automation, predictive maintenance, and improved operational visibility.
- Key players such as ABB, Eaton, General Electric, Hitachi Energy, and Hyundai Electric expanded portfolios through smart systems, modular designs, and digital monitoring technologies.
- Asia-Pacific dominated with 7% share, followed by North America at 32.8% and Europe at 28.4%, driven by strong infrastructure upgrades, while Latin America and Middle East & Africa showed emerging demand due to electrification and grid expansion.
Market Segmentation Analysis:
By Product
The Power Distribution Component Market by product is dominated by Switchgear, accounting for 41.6% share in 2024, driven by rising grid modernization projects, increasing renewable energy integration, and expanding industrial electrification. Switchboards hold a strong secondary position due to their use in commercial and utility substations, while distribution panels and motor control panels gain traction in manufacturing, oil & gas, and infrastructure upgrades. Demand for high-reliability protection systems, enhanced operational safety, and advanced monitoring features continues to fuel growth, positioning switchgear as the preferred choice for efficient and secure power distribution networks.
- For instance, Eaton’s Arcflash Reduction Maintenance System cuts fault clearing time to as low as 16 milliseconds, improving worker safety.
By Configuration
The configuration segment is led by Fixed Mounting, holding 48.3% share in 2024, supported by its widespread adoption in utilities, commercial establishments, and heavy industrial facilities. Its advantages include cost-effectiveness, simplified installation, and minimal maintenance requirements, which strengthen its demand in large-scale distribution systems. Plug-in and withdrawable configurations show rising adoption in environments requiring rapid maintenance and improved operational flexibility. The market growth is driven by the need for enhanced system reliability, reduced downtime, and increasing deployment of modular electrical distribution architectures across smart grids and automated industrial applications.
- For instance, ABB's MNS switchgear uses withdrawable modules, available in ratings up to and beyond 630 A, enabling equipment replacement in less than a minute and significantly reducing operational downtime.
By Voltage Rating
Within the voltage rating segment, ≤ 11 kV emerged as the leading category with 37.4% share in 2024, propelled by substantial demand across commercial buildings, residential infrastructure, small industries, and utility distribution networks. This range is preferred for secondary distribution applications where safety, cost efficiency, and compact designs are critical. Higher voltage classes—including >11 kV to ≤33 kV, >33 kV to ≤66 kV, and >66 kV to ≤132 kV—are witnessing rising deployment in transmission reinforcement, renewable power evacuation, and large industrial units. Growth is supported by increasing electrification, expansion of distribution substations, and grid digitalization initiatives.
Key Growth Drivers
Rising Grid Modernization and Infrastructure Expansion
Grid modernization initiatives remain a major driver for the Power Distribution Component Market as utilities invest in upgrading aging infrastructure and enhancing network reliability. Governments and private operators accelerate reinforcement of transmission and distribution networks to support rising electricity demand, renewable energy integration, and urban expansion. These initiatives increase the deployment of switchgear, distribution panels, and motor control systems. Digital substations, automated protection equipment, and advanced monitoring solutions further propel market adoption, strengthening the demand for high-efficiency and intelligent power distribution components.
- For instance, Schneider Electric’s GM AirSeT medium‑voltage primary switchgear is being deployed by German DSO EAM Netz as an SF₆‑free, pure‑air insulated solution with integrated IoT sensors and EcoStruxure‑based digital monitoring, enabling real‑time health insights and supporting condition‑based maintenance for distribution networks.
Rapid Industrialization and Manufacturing Sector Growth
Accelerated industrialization across emerging economies fuels strong demand for power distribution components as manufacturing plants, petrochemical units, metal processing facilities, and logistics hubs expand their electrical infrastructure. Industries require reliable, high-capacity components to ensure uninterrupted operations, safety compliance, and energy efficiency. Motor control panels and medium-voltage switchgear gain traction as companies upgrade production facilities and deploy automation. The trend toward Industry 4.0 drives the integration of smart control systems and real-time diagnostics, increasing the need for advanced distribution architectures that support high-performance industrial operations.
- For instance, Siemens’ SIMOVAC and SIMOVAC-AR medium-voltage motor controllers, rated from 2.3 kV to 6.9 kV with short-time withstand currents up to 63 kA, are used alongside medium-voltage switchgear to supply high-capacity drives in power generation and process industries, ensuring reliable motor starting and protection in demanding applications.
Increasing Renewable Energy Deployment and Electrification
The growing shift toward clean energy and electrification drives the need for modern distribution systems capable of handling variable power flows from renewable sources. Solar and wind projects demand robust switchgear, protection devices, and high-voltage components for safe and efficient energy evacuation. Electrification of transport, heating, and rural infrastructure increases distribution network loads, accelerating investments in new substations and distribution panels. The push for grid stability, voltage regulation, and automated energy management strengthens demand for innovative power distribution components designed for decentralized and renewable-heavy energy systems.
Key Trends & Opportunities
Adoption of Smart and IoT-Enabled Power Distribution Systems
A major trend reshaping the market is the rapid adoption of smart, IoT-enabled power distribution components that offer real-time monitoring, predictive maintenance, and advanced analytics. Utilities and industries integrate connected switchgear and distribution panels to enhance operational efficiency and reduce downtime. These systems enable automated fault detection, load optimization, and enhanced safety features. As digital transformation accelerates across power networks, opportunities emerge for manufacturers offering intelligent, cloud-integrated, and communication-enabled components that support next-generation grid management and energy automation strategies.
- For instance, ABB’s ReliaGear smart power distribution solution links low-voltage switchboards and breakers to a cloud-computing platform that monitors, optimizes, and controls electrical distribution in real time.
Expansion of Modular and Compact Distribution Architectures
The shift toward modular, space-efficient, and plug-and-play distribution systems presents significant opportunities for market players. Compact switchgear, modular distribution boards, and withdrawable designs gain prominence in urban infrastructure, commercial buildings, and data centers where space constraints and rapid installation are priorities. These configurations support easy maintenance, scalability, and reduced downtime, making them attractive for modern electrical networks. Manufacturers innovating in arc-resistant designs, hybrid insulation systems, and pre-engineered modular units stand to benefit from growing demand for flexible and high-performance distribution solutions.
- For instance, ABB’s MNS-Up low-voltage switchgear-UPS system combines modular switchgear with integrated UPS in a single plug-and-play unit, allowing data centers to expand power capacity without major rewiring while improving uptime and space utilization in prefabricated and edge facilities.
Key Challenges
High Installation and Upgradation Costs
Despite growing demand, high installation and upgrade costs remain a significant challenge for utilities and industries adopting advanced power distribution components. Modern switchgear, digital control systems, and smart monitoring devices require substantial capital investment, which can slow adoption in budget-constrained regions. Retrofitting aging infrastructure further increases costs due to compatibility issues, structural modifications, and downtime during replacement. These financial barriers particularly affect small industries and utilities, limiting large-scale deployment of technologically advanced distribution architectures.
Supply Chain Disruptions and Raw Material Volatility
Price fluctuations in essential materials such as copper, aluminum, and steel pose a persistent challenge for component manufacturers. Supply chain disruptions, geopolitical tensions, and logistics delays impact production cycles and increase operational costs. Extended lead times for semiconductors and electronic components further hinder the delivery of advanced switchgear and monitoring systems. These uncertainties reduce profitability for manufacturers and complicate long-term project planning for utilities and industrial users, slowing the pace of new infrastructure deployments and modernization activities.
Regional Analysis
North America
North America held 32.8% share in the Power Distribution Component Market in 2024, driven by strong investments in grid modernization, renewable integration, and replacement of aging transmission and distribution networks. The United States leads regional demand due to large-scale utility upgrades, data center expansion, and rising electrification of transport. Canada contributes with steady infrastructure reinforcement and renewable project installations. The region’s emphasis on smart grids, digital substations, and advanced protection systems accelerates adoption of high-efficiency switchgear and distribution panels. Strong regulatory support and reliability-focused standards further enhance market growth across utilities and industrial sectors.
Europe
Europe accounted for 28.4% share in 2024, supported by stringent energy-efficiency regulations, renewable energy expansion, and widespread deployment of digital grid technologies. Countries such as Germany, the U.K., and France lead adoption due to modernization of distribution networks and integration of high-voltage components for wind and solar power. The region’s focus on low-carbon infrastructure drives demand for intelligent switchgear, modular distribution systems, and automation-enabled control panels. Ongoing cross-border grid interconnections and investments in EV charging infrastructure strengthen market penetration, while aging electrical assets across Western and Central Europe continue to create significant replacement demand.
Asia-Pacific
Asia-Pacific dominated the global landscape with 34.7% share in 2024, fueled by rapid industrialization, large-scale urban development, and massive power infrastructure expansion in China, India, and Southeast Asia. Growing electricity consumption and the need for stable distribution networks drive substantial uptake of medium-voltage switchgear, distribution panels, and motor control systems. Government-led electrification programs and renewable additions intensify demand for modern grid components. The region also experiences rising adoption of smart distribution technologies as utilities transition toward digital monitoring and automation. Strong manufacturing output and competitive production capabilities further position Asia-Pacific as the fastest-growing regional market.
Latin America
Latin America captured 2.6% share in 2024, with growth supported by ongoing electrification projects, renewable energy development, and modernization of distribution infrastructure. Brazil and Mexico remain primary revenue contributors due to industrial expansion, infrastructure upgrades, and rising deployment of medium-voltage components. The region experiences increasing demand for durable switchgear and distribution panels to support grid stability and expanding commercial construction. However, budget constraints and slower regulatory reforms limit the pace of modernization. Despite challenges, the growing focus on clean energy and grid resilience continues to create opportunities for advanced power distribution solutions.
Middle East & Africa
The Middle East & Africa region held 1.5% share in 2024, driven by utility investments in transmission and distribution expansion, industrial diversification, and electrification of remote areas. Gulf countries fuel demand through large-scale infrastructure and commercial projects requiring modern switchgear and control systems. Africa’s need for reliable electricity access and grid expansion accelerates adoption of low- and medium-voltage distribution components. Renewable initiatives, particularly in solar power, boost deployment of advanced protection and switching devices. Despite economic and supply-chain constraints, the region offers long-term growth potential through continuous power sector development and modernization programs.
Market Segmentations:
By Product
- Switchgear
- Switchboard
- Distribution Panel
- Motor Control Panels
By Configuration
- Fixed Mounting
- Plug-in
- Withdrawable
By Voltage Rating
- ≤ 11 kV
- > 11 kV to ≤ 33 kV
- > 33 kV to ≤ 66 kV
- > 66 kV to ≤ 132 kV
By Application
- Residential
- Commercial
- Industrial
- Utility
By Geography
- North America
- U.S.
- Canada
- Mexico
- Europe
- Germany
- France
- U.K.
- Italy
- Spain
- Rest of Europe
- Asia Pacific
- China
- Japan
- India
- South Korea
- South-east Asia
- Rest of Asia Pacific
- Latin America
- Brazil
- Argentina
- Rest of Latin America
- Middle East & Africa
- GCC Countries
- South Africa
- Rest of the Middle East and Africa
Competitive Landscape
The competitive landscape of the Power Distribution Component Market features major players such as ABB, Eaton, General Electric, Hitachi Energy, Fuji Electric, Hubbell, Hyosung Heavy Industries, Hyundai Electric, L&T Electrical, and Lucy Group, each strengthening their position through technological advancements and portfolio expansions. Market participants focus on developing intelligent switchgear, modular distribution panels, and IoT-enabled monitoring systems to meet rising demand for grid modernization and operational reliability. Strategic initiatives including product launches, manufacturing capacity expansion, and partnerships with utilities and industrial operators drive deeper market penetration. Companies increasingly invest in digital substations, predictive maintenance technologies, and energy-efficient designs to align with evolving regulatory and sustainability requirements. As competition intensifies, global and regional manufacturers differentiate through innovation, customized solutions, and enhanced after-sales service, shaping a dynamic and technology-driven market environment.
Key Player Analysis
- Hyundai Electric
- Lucy Group
- Hitachi Energy
- Fuji Electric
- Hubbell
- L&T Electrical
- General Electric
- Hyosung Heavy Industries
- ABB
- Eaton
Recent Developments
- In August 2025, Hubbell announced acquisition of DMC Power for US$ 825 million to strengthen its portfolio of high-voltage electrical components.
- In October 2025, CG Power & Industrial Solutions (part of Murugappa Group) approved a ₹ 748 crore investment for a new greenfield switchgear manufacturing facility in western India, aimed at boosting their medium- and high-voltage switchgear output.
- In October 2024, PGC acquired Vizimax, Inc., a firm specializing in solutions to measure, control, and switch high- and medium-voltage electric power systems.
Report Coverage
The research report offers an in-depth analysis based on Product, Configuration, Voltage Rating, Application and Geography. It details leading market players, providing an overview of their business, product offerings, investments, revenue streams, and key applications. Additionally, the report includes insights into the competitive environment, SWOT analysis, current market trends, as well as the primary drivers and constraints. Furthermore, it discusses various factors that have driven market expansion in recent years. The report also explores market dynamics, regulatory scenarios, and technological advancements that are shaping the industry. It assesses the impact of external factors and global economic changes on market growth. Lastly, it provides strategic recommendations for new entrants and established companies to navigate the complexities of the market.
Future Outlook
- The market will experience strong growth as utilities accelerate grid modernization and digital transformation initiatives.
- Adoption of smart, IoT-enabled distribution components will increase as operators prioritize real-time monitoring and predictive maintenance.
- Demand for medium-voltage switchgear will rise with expanding renewable energy integration and distributed power generation.
- Industrial automation and manufacturing expansion will drive higher deployment of advanced motor control panels and distribution boards.
- Modular, compact, and withdrawable systems will gain traction due to easier installation, scalability, and reduced downtime.
- Investments in digital substations and automated protection systems will intensify across emerging and developed economies.
- Electrification of transport, infrastructure, and rural regions will boost consumption of low- and medium-voltage distribution components.
- Manufacturers will increasingly adopt energy-efficient designs and sustainable materials to meet regulatory and ESG requirements.
- Rising data center development will fuel demand for high-reliability switchgear and continuous power management solutions.
- Global players will expand through strategic partnerships, capacity upgrades, and technology-focused product innovations.
Request a Free Sample
Fill in your details and we'll send you a free sample report.
- Sample data tables & charts
- Research methodology
Need a Custom Version of This Report?
Tailor the scope, geography, or segments to your exact requirements.
- Custom geography or segment scope
- Direct access to our analyst team
Frequently Asked Questions
What is the current market size for Power Distribution Component Market, and what is its projected size in 2032?
At what Compound Annual Growth Rate is the Power Distribution Component Market projected to grow between 2025 and 2032?
Which Power Distribution Component Market segment held the largest share in 2024?
What are the primary factors fueling the growth of the Power Distribution Component Market?
Who are the leading companies in the Power Distribution Component Market?
Which region commanded the largest share of the Power Distribution Component Market in 2024?
Table of Content
Chapter 1. Report Introduction
- 1.1 Report Description & Purpose
- 1.1.1 Report Title & Market Definition
- 1.1.2 Unique Selling Propositions (USP) & Key Differentiators
- 1.1.3 Value Proposition for Stakeholders
- 1.2 Research Objectives
- 1.2.1 Market Sizing Objectives (Volume & Revenue)
- 1.2.2 Segmentation Objectives
- 1.2.3 Competitive Intelligence Objectives
- 1.2.4 Forecast & Scenario Objectives
- 1.3 Report Scope
- 1.3.1 Power Distribution Component Scope – Types & Subtypes Covered
- 1.3.2 Geographic Scope – Regions & Countries Covered
- 1.3.3 Historical Period, Base Year & Forecast Period (2024; forecast to 2032)
- 1.3.4 Inclusions & Exclusions
- 1.4 HS Code & Classification Framework
- 1.5 Currency, Units & Pricing Basis
- 1.6 Target Stakeholders
- 1.7 Limitations & Assumptions
Chapter 2. Executive Summary
- 2.1 Global Power Distribution Component Market Snapshot
- 2.1.1 Market Size – Historical (2024) & Forecast (2024-2032) (2024: USD 287,687.6 Million → 2032: USD 509,278.6 Million)
- 2.1.2 Volume & Revenue – Global Totals
- 2.1.3 Key Market Highlights – Top Five Facts
- 2.2 Power Distribution Component Market Segmentation Snapshot
- 2.2.1 Market Split by Region – 2024 vs. 2032
- 2.3 Competitive Snapshot
- 2.3.1 Top 10 Players by Revenue Share – 2024
- 2.3.2 Top 10 Players by Volume Share – 2024
- 2.3.3 Recent Strategic Developments (18-Month Summary)
- 2.4 Key Investment Highlights & Strategic Conclusions
Chapter 3. Power Distribution Component Market Dynamics & Industry Analysis
- 3.1 Market Overview & Context
- 3.1.1 Power Distribution Component Market Position in the Broader Automotive Value Chain
- 3.1.2 OEM vs. Replacement Market Dynamics
- 3.1.3 Market Maturity & Development Stage by Region
- 3.2 Power Distribution Component Market Drivers
- 3.3 Power Distribution Component Market Restraints & Challenges
- 3.4 Power Distribution Component Market Opportunities
- 3.5 Porter's Five Forces Analysis
- 3.5.1 Threat of New Entrants
- 3.5.2 Bargaining Power of Suppliers
- 3.5.3 Bargaining Power of Buyers
- 3.5.4 Threat of Substitutes
- 3.5.5 Competitive Rivalry – Intensity Assessment
- 3.6 Power Distribution Component Value Chain Analysis
- 3.6.1 Upstream – Raw Material/Input Suppliers
- 3.6.1.1 Raw Material/Input 1
- 3.6.1.2 Raw Material/Input 2
- 3.6.1.3 Raw Material/Input 3
- 3.6.2 Midstream – Production/Manufacturing/Service Delivery
- 3.6.2.1 Production/Process Overview
- 3.6.2.2 Key Facility Locations & Capacity by Manufacturer
- 3.6.3 Downstream – Distribution & End Consumer
- 3.6.3.1 Primary Channel – B2B/OEM
- 3.6.3.2 Secondary Channels – Dealer, Retail, Online, Direct
- 3.6.4 Value Chain Profitability Analysis
- 3.6.1 Upstream – Raw Material/Input Suppliers
- 3.7 PESTEL Analysis
- 3.7.1 Political Factors
- 3.7.2 Economic Factors
- 3.7.3 Social Factors
- 3.7.4 Technological Factors
- 3.7.5 Environmental Factors
- 3.7.6 Legal Factors
- 3.8 Power Distribution Component Supply Chain Analysis
- 3.8.1 Raw Material/Input Supply Risk Assessment
- 3.8.2 Manufacturing Concentration Risk (Geographic Exposure)
- 3.8.3 Trade Disruption Impact Analysis
- 3.9 Regulatory & Policy Landscape
Note: The regulatory and policy landscape section covers regulations based on their applicability to the market, Power Distribution Component category, geography, and scope of the study. Only regulatory frameworks with a material impact on operations, compliance, trade, sustainability, or market access are analyzed in detail.
Chapter 4. Key Investment Pockets & Opportunity Analysis
- 4.1 Power Distribution Component Market Attractiveness Analysis
- 4.1.1 By Region – Investment Attractiveness Matrix (Volume × CAGR)
- 4.2 Absolute Revenue Growth Opportunity
- 4.2.1 By Region – Absolute USD Growth Through 2032
- 4.3 Incremental Volume Opportunity
- 4.3.1 By Region – Incremental Volume Through 2032
- 4.3.2 Segment – Incremental Volume
- 4.4 Emerging Submarket Opportunity Deep Dive (Subject to Applicability)
- 4.5 Emerging Market Opportunity Scorecards
- 4.5.1 United States
- 4.5.2 Europe
- 4.5.3 Asia
- 4.5.4 Middle East & Africa
Note: Emerging Market Opportunity Scorecards will be included based on relevance and strategic importance. Regions listed are indicative and may vary depending on data availability and market dynamics.
Chapter 5. Power Distribution Component Import-Export Analysis & Trade Flows
- 5.1 Global Trade Overview
- 5.1.1 Global Export Value by Country (2024)
- 5.1.2 Global Export Volume by Country (2024)
- 5.1.3 Global Import Value by Country (2024)
- 5.1.4 Global Import Volume by Country (2024)
- 5.1.5 Net Trade Balance by Country (2024)
- 5.2 Export Analysis – Segment
- 5.2.1 Type 1 (HS Code)
- 5.2.2 Type 2 (HS Code)
- 5.2.3 Type 3 (HS Code)
- 5.2.4 Type 4 (HS Code)
- 5.2.5 Type 5 (HS Code)
- 5.3 Import Analysis – Segment
- 5.3.1 Type 1 (HS Code)
- 5.3.2 Type 2 (HS Code)
- 5.3.3 Type 3 (HS Code)
- 5.3.4 Type 4 (HS Code)
- 5.3.5 Type 5 (HS Code)
- 5.4 Average Unit Trade Prices
- 5.4.1 Average Export Price – Segment & Country
- 5.4.2 Average Import Price – Segment & Source Country
- 5.4.3 Price Trends (2024)
- 5.5 Key Trade Route Analysis
- 5.5.1 Trade Route 1
- 5.5.2 Trade Route 2
- 5.5.3 Trade Route 3
- 5.5.4 Trade Route 4
- 5.5.5 Trade Route 5
- 5.6 Trade Policy Impact Assessment
- 5.6.1 US Anti-Dumping & Section 301 Tariffs
- 5.6.2 EU Customs Union Impact
- 5.6.3 Major Free Trade Agreements
- 5.6.4 USMCA Rules of Origin
Note: Trade policy analysis will be included only where relevant to the Power Distribution Component market.
Chapter 6. Competitive Landscape & Company Benchmarking
- 6.1 Power Distribution Component Market Concentration & Structure
- 6.1.1 Herfindahl-Hirschman Index (HHI) – vs. 2024
- 6.1.2 Tier 1, Tier 2 & Tier 3 Market Structure
- 6.1.3 Global, Regional & Local Player Dynamics
- 6.2 Power Distribution Component Market Share Analysis – 2024
- 6.2.1 Global Revenue Share by Company
- 6.2.2 Global Volume Share by Company
- 6.2.3 Regional Revenue Share
- 6.2.4 Market Share Evolution ( vs. 2024)
- 6.2.5 OEM Segment Share by Company
- 6.2.6 Replacement Segment Share by Company
- 6.3 Production/Delivery Capacity & Facility Analysis
- 6.3.1 Global Installed Capacity
- 6.3.2 Capacity Utilization Rates
- 6.3.3 Production/Output Volume
- 6.3.4 Facility Locations & Capacity Map
- 6.3.5 Planned Capacity Additions
- 6.4 Power Distribution Component Competitive Benchmarking Matrix
- 6.4.1 Revenue, Volume, CAGR & Profitability Comparison
- 6.4.2 Channel Revenue Mix
- 6.4.3 Geographic Revenue Exposure
- 6.4.4 R&D Intensity
- 6.4.5 Sustainability Maturity
- 6.5 Strategic Developments in Power Distribution Component (Last 24 Months)
- 6.5.1 Mergers, Acquisitions & Divestments
- 6.5.2 New Power Distribution Component Launches
- 6.5.3 Facility Expansions
- 6.5.4 Strategic Alliances, Joint Ventures & Partnerships
- 6.5.5 Distribution Expansion & Market Entry
- 6.5.6 Sustainability & ESG Initiatives
- 6.6 Competitive Strategy Mapping
- 6.6.1 Leader, Challenger, Follower & Niche Classification
- 6.6.2 Pricing Strategy Comparison
- 6.6.3 Channel Strategy Matrix
Note: Strategic developments are included based on their materiality and the availability of reliable information.
Chapter 7. Global Power Distribution Component Market – By Distribution Channel
- 7.1 Segment Overview
- 7.1.1 Volume & Revenue Split by Channel (2024 & 2032)
- 7.1.2 Channel Mix Evolution (2024-2032)
Chapter 8. Regional Market Analysis – Global Overview
- 8.1 Global Regional Overview
- 8.1.1 Regional Volume Share
- 8.1.2 Regional Revenue Share
- 8.1.3 Regional Volume by Region
- 8.1.4 Regional Revenue by Region
- 8.1.5 Regional Forecast Through 2032
- 8.2 Cross-Regional Segment Analysis
- 8.2.1 By Distribution Channel
- 8.2.2 By Brand/Price Tier
Chapter 9. North America Power Distribution Component Market
- 9.1 United States
- 9.2 Canada
- 9.3 Mexico
Chapter 10. Europe Power Distribution Component Market
- 10.1 Germany
- 10.2 France
- 10.3 Italy
- 10.4 United Kingdom
- 10.5 Spain
- 10.6 Poland
- 10.7 Russia
- 10.8 Netherlands
- 10.9 Belgium
- 10.10 Sweden
- 10.11 Denmark
- 10.12 Norway
- 10.13 Rest of Europe
Chapter 11. Asia Pacific Power Distribution Component Market
- 11.1 China
- 11.2 India
- 11.3 Japan
- 11.4 South Korea
- 11.5 Thailand
- 11.6 Indonesia
- 11.7 Vietnam
- 11.8 Malaysia
- 11.9 Australia
- 11.10 Rest of Asia Pacific
Chapter 12. Latin America Power Distribution Component Market
- 12.1 Brazil
- 12.2 Argentina
- 12.3 Colombia
- 12.4 Chile
- 12.5 Rest of Latin America
Chapter 13. Middle East Power Distribution Component Market
- 13.1 Saudi Arabia
- 13.2 United Arab Emirates
- 13.3 Turkey
- 13.4 Israel
- 13.5 Iran
- 13.6 Rest of the Middle East
Chapter 14. Africa Power Distribution Component Market
- 14.1 South Africa
- 14.2 Egypt
- 14.3 Nigeria
- 14.4 Morocco
- 14.5 Rest of Africa
Chapter 15. Power Distribution Component Company Profiles
- 15.1 [Company 01]
- 15.1.1 Company Overview
- 15.1.2 Key Management Personnel
- 15.1.3 Products & Services Portfolio
- 15.1.4 Financial Performance
- 15.1.5 Key Market Focus & Geographic Presence
- 15.1.6 Recent Developments & Strategic Initiatives
Note: The company profile list is preliminary and may change based on research findings, market developments, data availability, and client requirements.
Chapter 16. Appendices
- Appendix A – List of Abbreviations & Acronyms
- Appendix B – Industry Classification Code Reference – Full Series
- Appendix C – Production & Capacity Data Tables
- Appendix D – End-Use & Demand Base Tables
- Appendix E – Consumption & Replacement Rate Assumptions
- Appendix F – ASP Reference Tables
- Appendix G – Manufacturing & Facility Database
- Appendix H – Import-Export Data Tables
- Appendix I – Regulatory Summary Tables
- Appendix J – Primary Research Participant List (Anonymized)
- Appendix K – Primary Research Questionnaire Framework
- Appendix L – Data Sources & Bibliography
- Appendix M – Market Size Divergence & Source Comparison
Chapter 17. Research Methodology
- 17.1 Research Framework & Philosophy
- 17.2 Secondary Research – Sources, Hierarchy & Data Extraction
- 17.3 Data Modeling – Bottom-Up & Top-Down Market Sizing
- 17.4 Primary Research – Stakeholder Framework, LOI & Sample Sizes
- 17.5 Forecast Methodology – Regression, Scenario & Sensitivity Analysis
- 17.6 Quality Control – Four-Layer Validation Framework
- 17.7 Limitations & Standard Assumptions
- 17.8 Disclaimer
