Market Overview
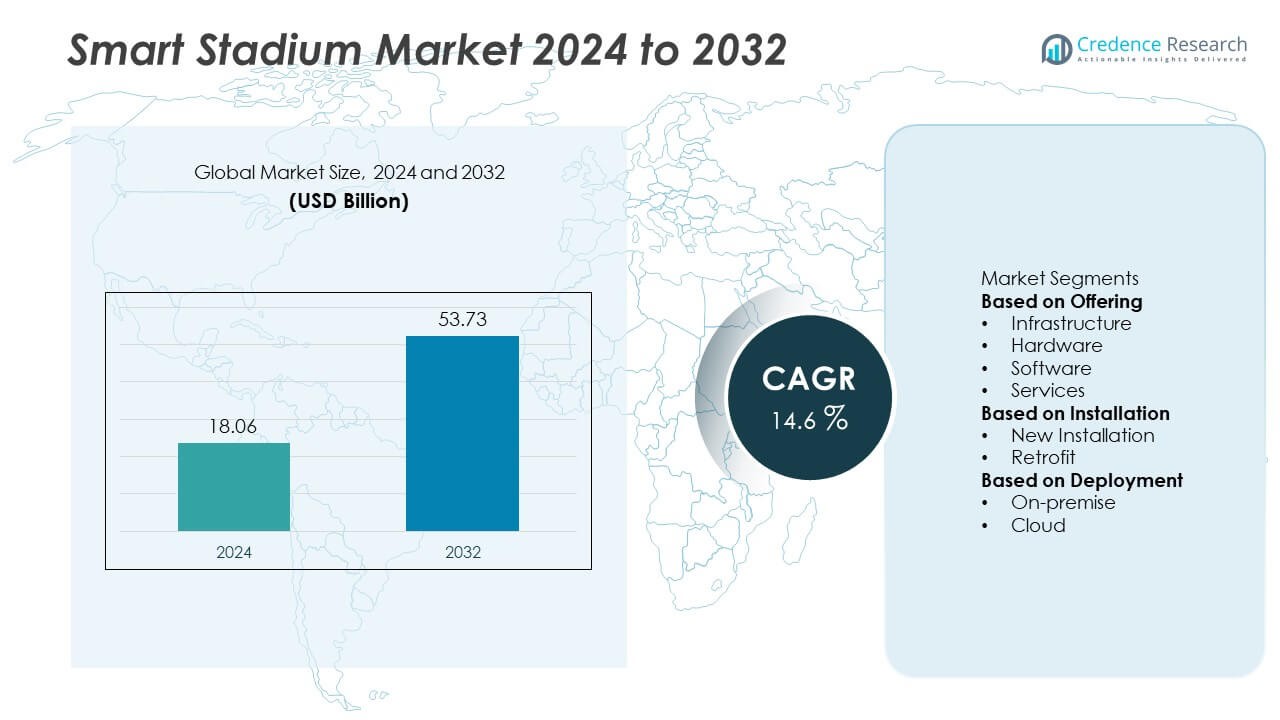
The Smart Stadium market was valued at USD 18.06 billion in 2024 and is projected to reach USD 53.73 billion by 2032, growing at a CAGR of 14.6% during the forecast period.
| REPORT ATTRIBUTE |
DETAILS |
| Historical Period |
2020-2023 |
| Base Year |
2024 |
| Forecast Period |
2025-2032 |
| Smart Stadium Market Size 2024 |
USD 18.06 Billion |
| Smart Stadium Market, CAGR |
14.6% |
| Smart Stadium Market Size 2032 |
USD 53.73 Billion |
The Smart Stadium market is driven by major players such as Intel Corporation, Huawei Technologies Co., Ltd., Fujitsu, GP Smart Stadium, NXP Semiconductors, IBM Corporation, Cisco Systems, Inc., Johnson Controls, NEC Corporation, and Mapsted Corp. These companies lead through advanced IoT integration, AI-powered analytics, and cloud-based solutions that enhance operational efficiency and fan engagement. North America dominates the global market with a 38.2% share, supported by strong technology adoption and high investments in digital infrastructure. Europe follows with 27.5%, driven by sustainability-focused projects and modernization of major football venues across the United Kingdom, Germany, and Spain.
Access crucial information at unmatched prices!
Request your sample report today & start making informed decisions powered by Credence Research Inc.!
Download Sample
Market Insights
- The Smart Stadium market was valued at USD 18.06 billion in 2024 and is expected to reach USD 53.73 billion by 2032, growing at a CAGR of 14.6% during the forecast period.
- Rising adoption of IoT, AI, and cloud-based systems is driving demand for real-time data management, crowd control, and fan engagement solutions across major sports venues.
- Growing focus on sustainability, smart energy systems, and immersive technologies such as AR and VR are key trends shaping future stadium developments.
- The market is moderately consolidated with major players like Intel, Huawei, IBM, Cisco, and Johnson Controls focusing on R&D, partnerships, and digital infrastructure innovation.
- North America leads with a 38.2% share, followed by Europe at 27.5% and Asia-Pacific at 22.6%, while the infrastructure segment dominates with 42.5% share due to heavy investments in connectivity, automation, and digital modernization.
Market Segmentation Analysis:
By Offering
The infrastructure segment dominated the Smart Stadium market in 2024, accounting for around 42.5% of the total share. Its dominance is driven by growing investments in high-speed connectivity, IoT-enabled surveillance, and energy management systems. Smart seating, lighting, and digital display integration enhance audience engagement and operational efficiency. The increasing adoption of 5G networks and edge computing further supports real-time data processing. Infrastructure upgrades are critical for transforming traditional venues into connected environments, enabling improved crowd management, safety, and entertainment experiences.
- For instance, Cisco Systems, Inc. deployed approximately 2,500 Wi-Fi 6 access points at the SoFi Stadium in California, enabling ultra-fast connectivity and real-time analytics for spectators. This deployment improved data throughput and reduced latency across connected devices during live events.
By Installation
The new installation segment held the largest 59.8% share of the Smart Stadium market in 2024. The rise in global construction of advanced sports venues, particularly in North America, Europe, and the Middle East, drives this dominance. Governments and sports organizations are investing in new facilities equipped with integrated digital systems, including AI-powered monitoring and automated ticketing. New installations allow seamless integration of modern technologies such as facial recognition, cashless payments, and connected parking systems, ensuring superior scalability and user experience compared to retrofitted structures.
- For instance, Huawei Technologies Co., Ltd. has developed its Intelligent Stadium Solution, which it has proposed and showcased globally, highlighting capabilities such as 5G connectivity, AI-based crowd management, and digital sensing for security and energy optimization.
By Deployment
The cloud segment accounted for approximately 54.2% of the total share in 2024, emerging as the leading deployment model. Cloud-based solutions enable real-time analytics, data accessibility, and scalability across multiple venues. Stadium operators favor cloud platforms for cost efficiency and simplified management of digital services like fan engagement, security analytics, and predictive maintenance. The growing adoption of SaaS models and hybrid cloud infrastructure further strengthens this segment. Cloud deployment supports integration with AI and IoT ecosystems, offering agility and faster implementation of digital upgrades.
Key Growth Drivers
Rising Adoption of IoT and Connected Devices
The growing use of IoT-enabled systems is a key driver for smart stadium expansion. Connected sensors, cameras, and lighting systems enable real-time monitoring and efficient crowd management. These technologies improve security, energy use, and maintenance. Smart devices also enhance fan experiences by supporting mobile engagement, digital ticketing, and personalized services. The push toward connected infrastructure is helping stadium operators boost efficiency while creating new revenue streams.
- For instance, Johnson Controls provided integrated solutions for Allegiant Stadium in Nevada, including the Metasys building automation system, security management, access control, and fire suppression systems, contributing to an efficient and safe environment across the venue.
Increasing Focus on Fan Engagement and Experience
Sports venues are emphasizing digital engagement to improve audience satisfaction. Features such as high-speed connectivity, mobile ordering, and contactless payments enhance convenience and comfort. Augmented and virtual reality applications deliver immersive, interactive experiences that attract younger audiences. Data analytics tools are used to study fan behavior, optimize marketing, and customize in-stadium services. This growing focus on engagement helps build stronger fan loyalty and long-term event attendance.
- For instance, Intel Corporation deployed its True View 360-degree video technology in more than 30 major stadiums worldwide, including venues for the NFL, NBA, and top global soccer leagues. Each stadium utilized 38 high-definition 5K cameras to enable real-time replays and immersive fan viewing.
Growing Investments in Infrastructure Modernization
Public and private investments in stadium modernization are accelerating digital transformation. Smart lighting, automated HVAC systems, and advanced security solutions improve energy management and operational reliability. Modern infrastructure supports multi-event usage and aligns with sustainability goals. Automated ticketing, crowd control, and waste management systems further optimize performance. Continuous upgrades in digital facilities ensure stadiums remain competitive and compliant with international event standards.
Key Trends & Opportunities
Integration of Artificial Intelligence and Data Analytics
Artificial intelligence and analytics are transforming stadium management. Predictive maintenance tools reduce downtime, while real-time data improves crowd flow and security. AI-driven insights help operators understand fan preferences and optimize pricing or promotions. Advanced analytics also enhance sustainability planning and resource allocation. As data-driven decision-making grows, AI solutions are becoming essential for improving stadium performance and fan engagement.
- For instance, the Mercedes-Benz Stadium in Atlanta utilizes extensive Internet of Things (IoT) capabilities and AI-driven systems to enhance the fan experience and optimize operations, such as guiding fans to their seats, providing real-time parking availability, and allowing them to order food and drinks through an app to reduce wait times.
Shift Toward Sustainable and Energy-Efficient Stadiums
Sustainability is becoming a defining trend in smart stadium design. Energy-efficient systems manage power use based on occupancy and weather conditions. Renewable energy sources, waste recycling, and water conservation technologies reduce environmental impact. Sports organizations and governments are supporting eco-friendly infrastructure initiatives. The move toward carbon-neutral and green-certified stadiums presents new opportunities for technology suppliers and facility managers.
- For instance, NEC Corporation was the systems-integrator for five stadiums in Brazil (including Arena Fonte Nova, Arena Pernambuco, Estádio das Dunas, Arena do Grêmio and Arena da Baixada) for the 2014 FIFA World Cup. The project included integration of 13 ICT equipment categories — from IP networks and Wi-Fi to CCTV, access control and fire detection systems.
Key Challenges
High Implementation and Maintenance Costs
The shift to smart infrastructure requires significant investment in technology, integration, and training. Maintaining advanced systems like IoT networks, sensors, and automation tools adds recurring costs. Smaller or older venues often face financial barriers to digital transformation. Compatibility issues between legacy and modern systems can further increase expenses. These challenges make cost optimization and phased implementation critical for market growth.
Data Security and Privacy Concerns
Smart stadiums rely on vast data collection from connected devices and digital platforms. This creates vulnerabilities related to cyberattacks and data breaches. Ensuring strong encryption, access controls, and compliance with data protection regulations is essential. Security lapses can compromise fan information and damage public trust. Operators must prioritize cybersecurity investments to maintain safety, privacy, and uninterrupted operations.
Regional Analysis
North America
North America held the largest share of 38.2% in the Smart Stadium market in 2024. The region’s dominance is driven by high adoption of advanced technologies such as IoT, AI, and cloud computing across major sports venues in the United States and Canada. Strong investments in digital infrastructure and the popularity of leagues like the NFL and MLB accelerate modernization efforts. Stadiums such as SoFi Stadium and Allegiant Stadium showcase cutting-edge connectivity and automation systems. Government support for smart city initiatives further strengthens market growth in this technologically advanced region.
Europe
Europe accounted for 27.5% of the Smart Stadium market share in 2024, supported by the region’s growing focus on sustainability and fan engagement. Leading football clubs in the United Kingdom, Germany, and Spain are integrating digital ticketing, smart lighting, and AI-based security systems. Investments ahead of large-scale events such as UEFA tournaments are accelerating adoption. Partnerships between sports organizations and tech firms drive innovations in analytics and connectivity. The region’s emphasis on reducing carbon footprints through energy-efficient solutions is further reinforcing smart stadium deployment.
Asia-Pacific
Asia-Pacific captured 22.6% of the global Smart Stadium market in 2024, fueled by rapid urbanization and digital transformation. Countries like China, Japan, India, and Australia are actively investing in smart sports infrastructure. Growing popularity of cricket, football, and esports encourages large-scale development of tech-enabled arenas. Government initiatives supporting smart city projects further promote connected venue adoption. Expanding mobile internet usage and increasing consumer demand for immersive fan experiences also drive this regional growth. Major events such as the Olympics and Asian Games continue to boost technology integration across new stadiums.
Middle East & Africa
The Middle East and Africa region accounted for 7.8% of the Smart Stadium market share in 2024. The growth is led by massive investments in world-class venues in countries like Qatar, the United Arab Emirates, and Saudi Arabia. Hosting of international tournaments has accelerated the adoption of advanced connectivity, climate control, and crowd management technologies. Governments are focusing on creating multipurpose smart sports hubs to attract tourism and global events. Africa’s market is gradually emerging, with countries like South Africa and Egypt investing in digital upgrades for existing stadiums.
Latin America
Latin America held a 3.9% share of the Smart Stadium market in 2024, supported by growing digital infrastructure investments in Brazil, Mexico, and Argentina. Rising interest in football and major sporting events drives the need for enhanced fan engagement technologies. Adoption of mobile ticketing, surveillance systems, and smart displays is expanding in newly built and renovated stadiums. Economic growth and private investments are enabling gradual digital transformation. However, budget constraints and uneven internet penetration continue to limit large-scale adoption compared to developed markets.
Market Segmentations:
By Offering
- Infrastructure
- Hardware
- Software
- Services
By Installation
- New Installation
- Retrofit
By Deployment
By Geography
- North America
- Europe
- Germany
- France
- U.K.
- Italy
- Spain
- Rest of Europe
- Asia Pacific
- China
- Japan
- India
- South Korea
- South-east Asia
- Rest of Asia Pacific
- Latin America
- Brazil
- Argentina
- Rest of Latin America
- Middle East & Africa
- GCC Countries
- South Africa
- Rest of the Middle East and Africa
Competitive Landscape
The competitive landscape of the Smart Stadium market features leading players such as Intel Corporation, Huawei Technologies Co., Ltd., Fujitsu, GP Smart Stadium, NXP Semiconductors, IBM Corporation, Cisco Systems, Inc., Johnson Controls, NEC Corporation, and Mapsted Corp. These companies compete through innovation in IoT connectivity, data analytics, and integrated software platforms designed to enhance fan engagement and stadium management efficiency. Strategic partnerships with sports organizations and technology providers are common, enabling large-scale deployment of connected infrastructure. Vendors are focusing on scalable cloud-based solutions, AI-driven analytics, and sustainable energy systems to strengthen their market presence. Continuous advancements in automation, cybersecurity, and real-time monitoring technologies allow key players to deliver improved performance, operational safety, and cost efficiency. The market remains moderately consolidated, with global leaders leveraging R&D investments and smart city collaborations to expand their portfolios and capture emerging opportunities in new sports infrastructure projects worldwide.
Shape Your Report to Specific Countries or Regions & Enjoy 30% Off!
Key Player Analysis
- Intel Corporation
- Huawei Technologies Co., Ltd.
- Fujitsu
- GP Smart Stadium
- NXP Semiconductors
- IBM Corporation
- Cisco Systems, Inc.
- Johnson Controls
- NEC Corporation
- Mapsted Corp.
Recent Developments
- In March 2025, Huawei introduced its latest intelligent-campus suite—including its Intelligent Stadium Solutions—at MWC Barcelona, incorporating 5G, Wi-Fi 7, AI, cloud and digital twin capabilities for next-generation venues.
- In 2025, Cisco Systems, Inc.’s Connected Stadium Solution was featured in industry commentary as a leading offering for fan experience enhancement and operations optimisation in stadiums.
- In October 2024, Huawei Technologies Co., Ltd. unveiled its Intelligent Stadium Solution at the GITEX Global 2024 forum in Dubai, aimed at enabling the digital and intelligent transformation of stadium campuses.
- In June 2024, Johnson Controls International plc announced a collaboration with a Middle East sustainability firm (IGCC) to integrate advanced energy and operational-efficiency solutions into smart stadiums.
Report Coverage
The research report offers an in-depth analysis based on Offering, Installation, Deployment and Geography. It details leading market players, providing an overview of their business, product offerings, investments, revenue streams, and key applications. Additionally, the report includes insights into the competitive environment, SWOT analysis, current market trends, as well as the primary drivers and constraints. Furthermore, it discusses various factors that have driven market expansion in recent years. The report also explores market dynamics, regulatory scenarios, and technological advancements that are shaping the industry. It assesses the impact of external factors and global economic changes on market growth. Lastly, it provides strategic recommendations for new entrants and established companies to navigate the complexities of the market.
Future Outlook
- Growing digital transformation in sports infrastructure will drive large-scale adoption of connected and automated stadium systems.
- Increasing fan demand for interactive and personalized experiences will encourage integration of AI and AR-based engagement tools.
- Expansion of 5G networks will enable faster data processing and real-time analytics across major stadiums worldwide.
- Rising focus on sustainability will push investments in smart lighting, HVAC optimization, and renewable energy systems.
- Cloud-based platforms will dominate due to their scalability, lower maintenance, and better data accessibility.
- Key players will continue forming strategic partnerships with sports organizations and technology vendors.
- Government support for smart city projects will enhance funding and adoption in developing markets.
- Cybersecurity and data privacy management will remain top priorities for connected infrastructure.
- North America, Europe, and Asia-Pacific will remain key revenue-generating regions in the forecast period.
- Infrastructure and software segments will lead adoption due to their critical role in digital stadium operations.


