Market Overview:
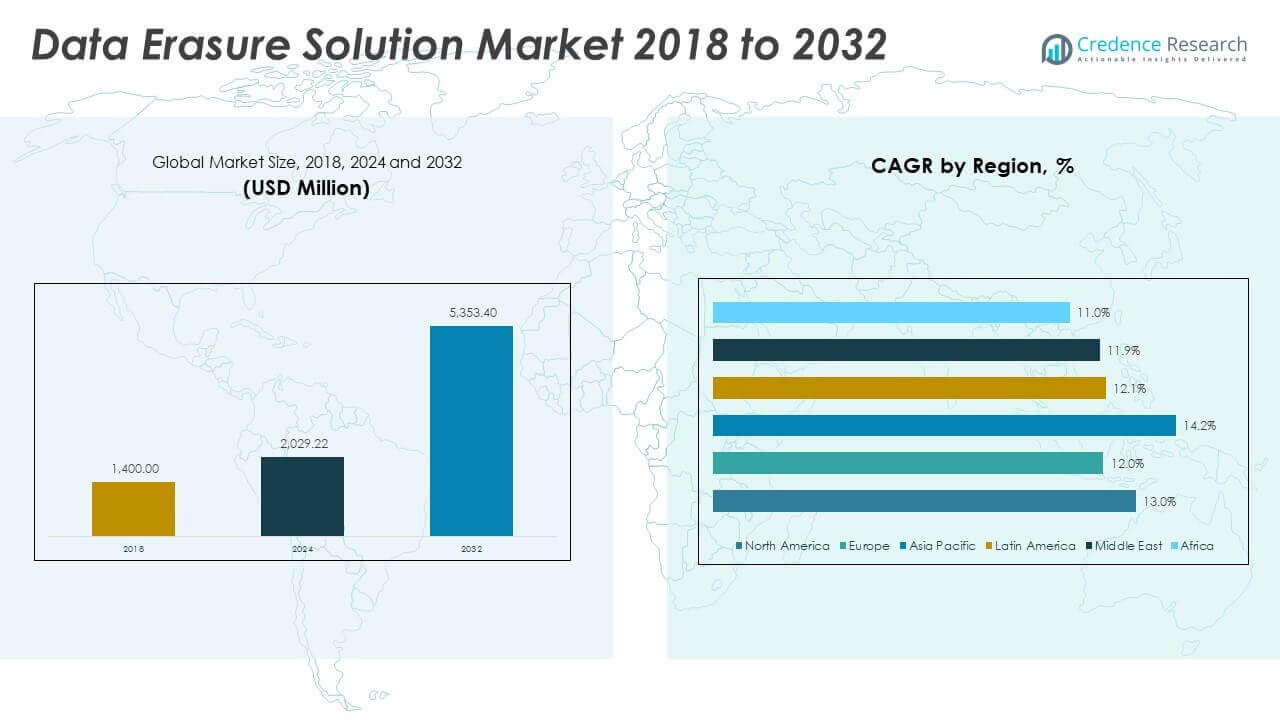
The Data Erasure Solution Market size was valued at USD 1,400.00 million in 2018 to USD 2,029.22 million in 2024 and is anticipated to reach USD 5,353.40 million by 2032, at a CAGR of 12.99% during the forecast period.
| REPORT ATTRIBUTE |
DETAILS |
| Historical Period |
2020-2023 |
| Base Year |
2024 |
| Forecast Period |
2025-2032 |
| Data Erasure Solution Market Size 2024 |
USD 2,029.22 Million |
| Data Erasure Solution Market, CAGR |
12.99% |
| Data Erasure Solution Market Size 2032 |
USD 5,353.40 Million |
The market is witnessing significant growth due to rising concerns about data privacy, compliance, and secure disposal of sensitive information. Organizations across banking, healthcare, telecom, and government sectors are adopting advanced erasure solutions to ensure customer data protection. Companies recognize that secure sanitization helps prevent breaches while meeting strict regulatory requirements, including GDPR and HIPAA. The transition to cloud-based operations is also fueling adoption, as businesses require certified tools to manage virtual and physical assets. Enterprise storage modernization further supports investment in robust erasure systems for scalable environments.
North America holds a dominant share, supported by strong regulatory frameworks and strict compliance enforcement. Enterprises across healthcare, finance, and technology sectors adopt HIPAA and GDPR-aligned solutions to safeguard data integrity. Europe follows closely, emphasizing privacy-focused regulations and rising investments in IT infrastructure security. Asia-Pacific is emerging as the fastest-growing market, driven by digital transformation, increased cyberattacks, and expanding technology adoption in India and China. Local enterprises and multinational corporations alike prioritize secure data disposal to protect business continuity and customer trust.
Market Insights:
- The Data Erasure Solution Market size was USD 1,400.00 million in 2018, USD 2,029.22 million in 2024, and is projected to reach USD 5,353.40 million by 2032, at a CAGR of 12.99%.
- North America (35.7%), Asia Pacific (28.7%), and Europe (20.3%) held the top regional shares in 2024, driven by strong compliance standards, rapid IT modernization, and robust data protection laws.
- Asia Pacific, the fastest-growing region with 28.7% share, is expanding rapidly due to digitization, cloud adoption, and rising cyber threats in countries like China and India.
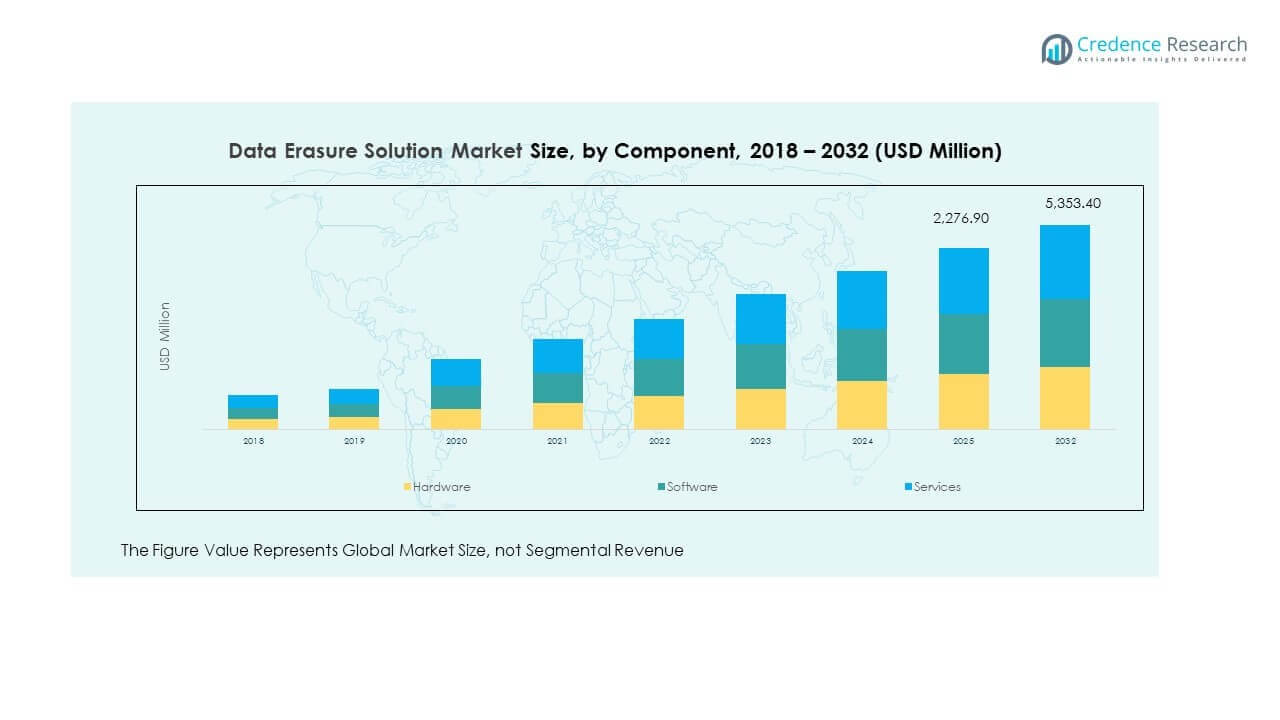
- In 2024, software solutions accounted for nearly 53% of the market, reflecting enterprise demand for scalable and automated erasure tools.
- Hardware and services combined represented about 47%, with services gaining traction through outsourcing of IT asset disposition and compliance-driven audits.
Access crucial information at unmatched prices!
Request your sample report today & start making informed decisions powered by Credence Research Inc.!
Download Sample
Market Drivers:
Growing Importance of Regulatory Compliance and Data Protection Standards
Strict regulatory requirements are shaping corporate investments in data erasure technologies. Governments worldwide enforce rules such as GDPR, HIPAA, and CCPA to safeguard consumer data. Companies must comply with these standards or face heavy penalties, reputational damage, and potential loss of customer trust. The Data Erasure Solution Market benefits from this compliance-driven demand. Firms operating across global regions are prioritizing certified erasure methods to protect client information. It drives adoption across industries including finance, healthcare, and IT services. Businesses view compliance as a strategic necessity rather than a legal burden. The push for secure erasure aligns corporate security with customer expectations, making compliance a key growth driver.
- For example, Blancco Technology Group has obtained over 15 global certifications and approvals including France’s ANSSI, Germany’s TÜV Saarland, and Mexico’s NYCE verifying that its software meets rigorous standards for secure data erasure and regulatory compliance with frameworks such as GDPR, HIPAA, and CCPA.
Rising Cybersecurity Threats and Enterprise Risk Mitigation Strategies
Cybercrime is growing in scale and complexity, pressuring enterprises to upgrade security practices. The Data Erasure Solution Market addresses this concern by providing reliable disposal methods for sensitive data. Breaches often occur when obsolete devices and drives are improperly sanitized. It ensures that residual data cannot be recovered by malicious actors. Executives focus on data sanitization to reduce operational risk and safeguard brand reputation. The growing awareness among enterprises of post-retirement risks for storage devices enhances demand. Advanced erasure techniques reassure customers that data protection extends beyond active usage. Organizations are investing heavily to mitigate these risks, strengthening demand for secure erasure solutions.
Expansion of Cloud Infrastructure and Data Center Modernization Efforts
The global expansion of cloud platforms creates higher demand for secure data erasure tools. Cloud providers must maintain trust by offering complete data sanitization across virtualized and physical assets. The Data Erasure Solution Market benefits from strong investments in scalable cloud infrastructure. It drives adoption among enterprises shifting workloads from legacy systems to digital platforms. Growing data center upgrades worldwide require effective end-of-life management for hardware. Businesses seek erasure solutions that integrate seamlessly with automated IT asset disposition frameworks. Providers offering certified erasure for both cloud and hybrid environments gain a competitive edge. Rapid adoption of cloud-first strategies continues to push demand upward.
Growing Awareness of Environmental Sustainability and E-Waste Reduction Practices
The rise of sustainability goals promotes secure reuse and recycling of IT equipment. Corporations emphasize responsible practices for reducing electronic waste through certified erasure. The Data Erasure Solution Market supports this by enabling equipment to reenter secondary markets safely. It allows businesses to extend hardware lifecycles without security risks. Global initiatives to reduce e-waste motivate companies to choose secure erasure over physical destruction. Certified solutions also reduce landfill waste and minimize environmental impact. Clients prefer vendors that align with corporate sustainability commitments. This alignment of security and sustainability objectives accelerates adoption across multiple industries.
- For example, Blancco’s 2023 ESG report states that its secure erasure solutions processed nearly 64 million devices in fiscal year 2023 (July 2022 to June 2023), preventing approximately 107 million kilograms of IT equipment from entering landfills. This suggests that successfully wiped devices such as computers, servers, and mobile devices could be reused, recycled, donated, or sold in a circular economy model
Market Trends:
Integration of Automation and Artificial Intelligence in Erasure Tools
Automation and AI capabilities are transforming the efficiency of erasure solutions. Intelligent systems help organizations manage large-scale sanitization processes with minimal manual oversight. The Data Erasure Solution Market benefits from AI-driven tools that detect anomalies and optimize processes. It enhances compliance by automating record-keeping and reporting for audits. Predictive analytics further improve reliability by identifying hardware likely to fail soon. Automated workflows reduce labor costs and streamline IT asset disposition. Enterprises with complex data environments prefer AI-enabled solutions for speed and accuracy. Growing reliance on AI-powered erasure strengthens this emerging trend.
Expansion of Remote and Distributed Workforces Requiring Secure Data Disposal
The shift toward hybrid and remote work environments is creating new security needs. Devices used outside corporate networks increase risks when retired without proper sanitization. The Data Erasure Solution Market addresses this trend with tools enabling remote erasure protocols. It allows IT teams to sanitize endpoints regardless of employee location. Secure disposal supports organizations maintaining compliance in dispersed workforce structures. Businesses demand flexible erasure processes that integrate into mobile device management systems. Vendors offering remote erasure features gain wider adoption in global enterprises. Growth of distributed workforces sustains this market trend.
- For example, Stellar’s BitRaser Drive Eraser v3.0.0.7 (launched in 2024) supports remote data erasure of Windows devices via MSI packages deployed directly or through endpoint management tools like Microsoft SCCM, Ivanti, and ManageEngine, and generates tamper-proof, digitally signed erasure certificates accessible via its cloud console. It adheres to international standards including NIST SP 800-88 and holds certifications such as Common Criteria and ADISA.
Adoption of Cloud-Based Erasure Platforms and Service-Oriented Models
Cloud-native erasure platforms are expanding across industries seeking scalable solutions. Enterprises prefer subscription-based models offering flexibility and predictable costs. The Data Erasure Solution Market is shifting toward service-driven solutions supporting hybrid IT infrastructures. It provides organizations with centralized visibility and control over sanitization processes. Cloud delivery ensures faster updates and compliance with evolving standards. Service-oriented models also appeal to small and mid-sized enterprises with limited budgets. It lowers upfront investment while ensuring enterprise-grade security standards. Widespread adoption of cloud-based erasure services reflects this strong trend.
- For example, Kroll Ontrack provides a cloud-based data erasure management console that centralizes control and produces certified audit trails with tamper-proof certificates. Its verification services validate data destruction and ensure compliance with global regulations for secure device decommissioning.
Increasing Demand for Multi-Device and Cross-Platform Compatibility in Erasure Solutions
Enterprises manage diverse devices across laptops, servers, mobile phones, and storage arrays. Demand grows for solutions capable of handling cross-platform data sanitization efficiently. The Data Erasure Solution Market recognizes this shift by enhancing multi-device compatibility. It helps companies maintain uniform standards across various IT assets. Unified platforms reduce complexity in managing multiple erasure tools. Growing device diversity in enterprises highlights the importance of versatile solutions. Vendors focusing on wide compatibility gain stronger traction in global deployments. This trend underscores the need for flexible erasure frameworks supporting diverse technologies.
Market Challenges Analysis:
High Cost of Certified Erasure Solutions and Integration Complexity
The rising need for certified erasure solutions creates significant financial pressure on enterprises. Smaller organizations often hesitate to adopt advanced erasure systems due to upfront costs. The Data Erasure Solution Market faces hurdles in expanding adoption among cost-sensitive businesses. It struggles when firms rely on less-secure alternatives like basic overwriting tools. Integration with legacy IT infrastructure remains another barrier. Complex environments often require customization, leading to longer implementation cycles. Vendors must address these challenges with cost-effective solutions. Affordability and ease of deployment are critical for wider adoption.
Limited Awareness and Shortage of Skilled Professionals
Many enterprises remain unaware of the risks linked to improper data disposal. This knowledge gap limits the adoption of advanced erasure technologies across industries. The Data Erasure Solution Market must overcome education barriers to achieve broad acceptance. It also suffers from a shortage of skilled personnel who can implement and manage solutions effectively. The lack of expertise increases dependency on third-party providers. Growing reliance on external vendors raises concerns about trust and transparency. Building awareness campaigns and training programs is essential for market expansion. Overcoming these human capital challenges remains a pressing need.
Market Opportunities:
Rising Demand for IT Asset Disposition Services in Emerging Economies
Emerging economies present strong opportunities for vendors offering secure IT asset disposal. Enterprises in these regions face rising cyber threats and stricter compliance expectations. The Data Erasure Solution Market benefits by aligning with digital transformation initiatives. It allows organizations to manage decommissioned hardware securely while meeting sustainability goals. Companies expanding operations in Asia-Pacific, Latin America, and Africa look for certified erasure solutions. It supports safe hardware reuse, generating financial and environmental benefits. Vendors that tailor affordable offerings for these markets gain a competitive edge. Demand growth in developing regions ensures robust opportunities.
Growth Potential from Partnerships with Cloud and Managed Service Providers
Partnerships with cloud service providers open new revenue streams for erasure vendors. Enterprises seek integrated services that combine storage, security, and certified data disposal. The Data Erasure Solution Market capitalizes on collaborations with managed service providers. It enables vendors to reach mid-tier businesses with bundled services. Integration with existing cloud ecosystems enhances scalability and visibility. Service providers that embed erasure into IT lifecycle management increase adoption. This channel-driven model strengthens customer trust and reduces procurement complexity. Growing reliance on third-party IT services ensures continued market opportunities.
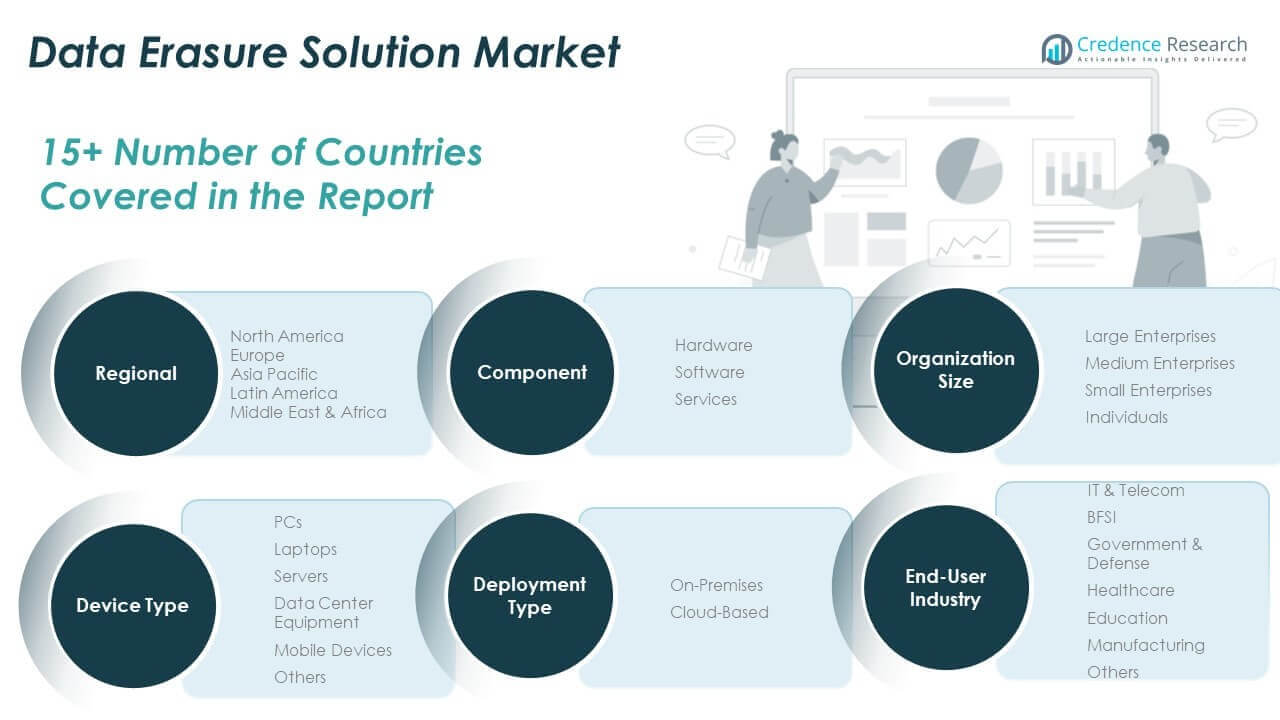
Market Segmentation Analysis:
The Data Erasure Solution Market is structured across multiple segments, reflecting diverse adoption needs.
By component, hardware holds significance in physical drive sanitization, while software solutions dominate demand with scalable, automated features tailored for enterprise and cloud environments. Services are expanding quickly, driven by managed erasure offerings and compliance-focused audits. It reflects a balanced mix where software leads growth, but services gain strong traction among industries seeking outsourcing models.
By device type, laptops and PCs form a core segment due to high replacement cycles in enterprises. Servers and data center equipment account for significant adoption, aligning with global cloud expansion and infrastructure modernization. Mobile devices are emerging as a critical focus area, influenced by remote work and the rising use of personal devices for business. Other devices such as external storage media maintain consistent but smaller demand. It underscores the breadth of data erasure needs across IT environments.
- For example, BitRaser Drive Eraser v3.0.0.7 enables remote erasure of Windows laptops and PCs at scale via MSI deployment or through Microsoft SCCM integration. It generates tamper-proof certificates and supports the newest Mac (M3, M2, M1) models for hybrid enterprises.
By end-user industries show varied adoption patterns. IT and telecom lead deployment, followed by BFSI and government sectors with strict compliance requirements. Healthcare demonstrates rising demand driven by data sensitivity and patient privacy. Education, manufacturing, and others continue to incorporate secure disposal practices.
By organization size, large enterprises dominate adoption, but small and medium enterprises increasingly recognize data protection as essential. Individuals contribute marginally but reflect a growing awareness.
- For example, BitRaser Drive Eraser offers cloud portal management, low-cost licensing, and remote operation, making secure erasure feasible for SMBs with distributed IT.
By deployment type, on-premises solutions remain vital for security-sensitive industries, while cloud-based deployments record strong momentum with enterprises seeking scalability, centralized control, and flexible service models.
Segmentation:
By Component
- Hardware
- Software
- Services
By Device Type
- PCs
- Laptops
- Servers
- Data Center Equipment
- Mobile Devices
- Others
By End-User Industry
- IT & Telecom
- BFSI
- Government & Defense
- Healthcare
- Education
- Manufacturing
- Others
By Organization Size
- Large Enterprises
- Medium Enterprises
- Small Enterprises
- Individuals
By Deployment Type
By Region
- North America
- Europe
- UK
- France
- Germany
- Italy
- Spain
- Russia
- Belgium
- Netherlands
- Austria
- Sweden
- Poland
- Denmark
- Switzerland
- Rest of Europe
- Asia Pacific
- China
- Japan
- South Korea
- India
- Australia
- Thailand
- Indonesia
- Vietnam
- Malaysia
- Philippines
- Taiwan
- Rest of Asia Pacific
- Latin America
- Brazil
- Argentina
- Peru
- Chile
- Colombia
- Rest of Latin America
- Middle East
- UAE
- KSA
- Israel
- Turkey
- Iran
- Rest of Middle East
- Africa
- Egypt
- Nigeria
- Algeria
- Morocco
- Rest of Africa
Regional Analysis:
North America
The North America Data Erasure Solution Market size was valued at USD 506.80 million in 2018 to USD 725.64 million in 2024 and is anticipated to reach USD 1,911.71 million by 2032, at a CAGR of 13.0% during the forecast period. North America holds the largest share of the Data Erasure Solution Market with 35.7% in 2024. The region’s dominance is driven by strict compliance frameworks including HIPAA and GDPR-aligned solutions. Enterprises in IT, BFSI, and healthcare prioritize certified tools to safeguard sensitive data. It benefits from mature digital infrastructure, high cybersecurity awareness, and strong regulatory enforcement. Organizations actively invest in scalable cloud-based and on-premises solutions to strengthen compliance. Demand for services also grows due to outsourcing of IT asset disposition. The presence of global leaders and continuous innovation further consolidate market leadership in this region.
Europe
The Europe Data Erasure Solution Market size was valued at USD 299.60 million in 2018 to USD 413.50 million in 2024 and is anticipated to reach USD 1,015.82 million by 2032, at a CAGR of 12.0% during the forecast period. Europe accounts for 20.3% of the 2024 market share. The Data Erasure Solution Market in Europe benefits from the region’s strong emphasis on data protection laws. Enterprises across government, BFSI, and healthcare sectors integrate certified erasure to meet strict regulations. It is supported by high investment in IT infrastructure modernization and cybersecurity readiness. Demand is particularly strong in Germany, the UK, and France. Vendors gain traction by offering solutions aligned with GDPR and national policies. Growing focus on secure hardware reuse and sustainable IT practices further supports expansion. Europe remains a stable yet steadily advancing market.
Asia Pacific
The Asia Pacific Data Erasure Solution Market size was valued at USD 386.82 million in 2018 to USD 582.68 million in 2024 and is anticipated to reach USD 1,678.83 million by 2032, at a CAGR of 14.2% during the forecast period. Asia Pacific secures a 28.7% share of the Data Erasure Solution Market in 2024. Rapid digital transformation, expanding IT industries, and growing cyber threats drive demand across China, India, Japan, and South Korea. It reflects strong adoption in data centers and enterprises embracing cloud-first strategies. Rising smartphone and device usage contributes to mobile erasure growth. Governments introduce stricter regulations to manage data privacy and e-waste. The market is also boosted by increasing reliance on outsourced IT services. Local and global vendors expand aggressively to capture high-growth opportunities. Asia Pacific emerges as the fastest-growing regional market.
Latin America
The Latin America Data Erasure Solution Market size was valued at USD 99.40 million in 2018 to USD 142.84 million in 2024 and is anticipated to reach USD 352.63 million by 2032, at a CAGR of 12.1% during the forecast period. Latin America represents 7.0% of the Data Erasure Solution Market in 2024. Growing digitalization across industries like BFSI and telecom strengthens regional adoption. It is supported by rising awareness of cybersecurity risks and compliance obligations. Brazil dominates the market, followed by Mexico and Argentina. Enterprises are increasingly investing in certified tools to reduce data breach risks. Cloud expansion across the region enhances adoption of service-oriented erasure platforms. The demand for affordable, scalable solutions continues to shape vendor strategies. Latin America is gradually transitioning into a more compliance-driven market.
Middle East
The Middle East Data Erasure Solution Market size was valued at USD 67.20 million in 2018 to USD 92.52 million in 2024 and is anticipated to reach USD 225.41 million by 2032, at a CAGR of 11.9% during the forecast period. The Middle East contributes 4.5% share to the Data Erasure Solution Market in 2024. The region is shaped by strong investments in IT modernization and government-led cybersecurity initiatives. It gains momentum in sectors like oil & gas, BFSI, and telecom. Enterprises adopt certified erasure tools to manage sensitive business data securely. GCC countries, Israel, and Turkey emerge as high-demand hubs. It reflects growing alignment with global compliance standards and sustainability practices. Vendors offering hybrid deployment models gain strong traction. The market in this region shows steady, compliance-led growth with long-term potential.
Africa
The Africa Data Erasure Solution Market size was valued at USD 40.18 million in 2018 to USD 72.05 million in 2024 and is anticipated to reach USD 169.00 million by 2032, at a CAGR of 11.0% during the forecast period. Africa holds 3.5% share of the Data Erasure Solution Market in 2024. The market is supported by rising digital adoption and expansion of mobile-driven services. It is influenced by growing awareness of cybersecurity and data privacy risks. South Africa leads adoption, followed by Egypt and Nigeria. The market benefits from gradual investments in IT and telecom infrastructure. Enterprises look for cost-effective erasure solutions suited to resource-constrained environments. Vendors focusing on affordable and flexible platforms can capture opportunities. Africa’s growth is modest but supported by ongoing digital transformation initiatives.
Shape Your Report to Specific Countries or Regions & Enjoy 30% Off!
Key Player Analysis:
- Blancco Technology Group (Finland)
- Ontrack (a subsidiary of Clearwater, US)
- Ibas GmbH (Germany)
- Magoshare (China)
- Certus Software Ltd. (UK)
- Extreme Protocol Solutions (US)
- Stellar Information Technology Pvt. Ltd. (India)
- Hitachi Vantara (US)
- CHG-Meridian (US)
- WipeOS (Switzerland)
Competitive Analysis:
The Data Erasure Solution Market is highly competitive, with vendors focusing on innovation, compliance, and service integration. Leading companies such as Blancco Technology Group, Ontrack, Certus Software, and Stellar Information Technology emphasize certified erasure methods and scalable platforms. It reflects a strong push toward cloud-based solutions and service-oriented models. Global players expand footprints through partnerships, mergers, and regional expansions, while local firms target niche markets with cost-effective offerings. Vendors differentiate through multi-device compatibility, regulatory alignment, and sustainability-focused features. Competitive intensity continues to rise as enterprises demand secure, automated, and compliant erasure solutions across diverse industries.
Recent Developments:
- In August 2025, Rubrik unveiled a new product called Agent Rewind, designed to address data loss resulting from AI agent errors, immediately following the closure of its acquisition of Predibase. In September 2025, OneTrust announced a partnership with Databricks, enabling real-time automation of data policy enforcement for customers using the Databricks Data Intelligence Platform.
- In May 2025, Blancco Technology Group announced the acquisition of Key Deploy from Blair Technology Group. This software technology enables automated Windows asset reimaging after data sanitization, further accelerating the deployment of refurbished Windows-based laptops and desktops
Report Coverage:
The research report offers an in-depth analysis based on Component, Device Type, End-User Industry, Organization Size and Deployment Type. It details leading market players, providing an overview of their business, product offerings, investments, revenue streams, and key applications. Additionally, the report includes insights into the competitive environment, SWOT analysis, current market trends, as well as the primary drivers and constraints. Furthermore, it discusses various factors that have driven market expansion in recent years. The report also explores market dynamics, regulatory scenarios, and technological advancements that are shaping the industry. It assesses the impact of external factors and global economic changes on market growth. Lastly, it provides strategic recommendations for new entrants and established companies to navigate the complexities of the market.
Future Outlook:
- The Data Erasure Solution Market will expand with stronger enterprise adoption of certified erasure platforms.
- Cloud-based deployment will accelerate as organizations prioritize scalable and centralized erasure solutions.
- Demand for mobile and cross-platform erasure tools will grow with rising device diversity.
- IT asset disposition services will integrate more erasure offerings, driving outsourcing opportunities.
- Regulatory frameworks will intensify, pushing enterprises toward advanced compliance-focused solutions.
- AI and automation will enhance efficiency and reliability in large-scale erasure processes.
- Sustainability goals will increase reliance on erasure over physical destruction for hardware reuse.
- SMEs will adopt cost-effective software and service solutions to address growing security needs.
- Regional growth in Asia Pacific will outpace other markets due to rapid digitalization.
- Strategic alliances with cloud and managed service providers will create new revenue streams.


